VIET NAM country case story
Bạn đang xem bản rút gọn của tài liệu. Xem và tải ngay bản đầy đủ của tài liệu tại đây (779.97 KB, 135 trang )
Background Paper for the Chronic Poverty
Report 2008-09
Viet Nam Country Case Study
Pham Anh Tuan
What is Chronic Poverty?
The distinguishing feature
of chronic poverty is
extended duration in
absolute poverty.
Therefore, chronically poor
people always, or usually,
live below a poverty line,
which is normally defined in
terms of a money indicator
(e.g. consumption, income,
etc.), but could also be
defined in terms of wider or
subjective aspects of
deprivation.
This is different from the
transitorily poor, who move
in and out of poverty, or
only occasionally fall below
the poverty line.
www.chronicpoverty.org
The research for this Background Paper was made possible by CPRC core
funding from the United Kingdom's Department for International Development
(DFID).
Electronic copy available at: />
Table of Contents
Summary
7
1
Introduction
8
1.1
Poverty analysis
8
1.2
Policy focus
8
The Chronic Poverty
Research Centre
1.3
Research
questions
9
(CPRC) is an international
1.4
Recommendations
10
partnership ofniversities,
research institutes and NGOs,
2
Q1:
Who
are
the
chronically
poor
in
the
country?
14
with the central aim of creating
2.1
Definition
of
poverty
14
knowledge that contributes to
both the speed and quality of
2.2
Measurement of poverty
14
poverty reduction, and a focus
19
on assisting those2.3
who are Poverty Analysis
trapped in poverty, particularly in
2.4
Causes of poverty
24
sub-Saharan Africa and South
3
Q2: Does the PRS contain one or more policies that have been identified as being targeted
Asia.
at/inclusive of/directly beneficial to chronically poor groups?
30
3.1
Policy focus
31
3.1.1 National Targeted Programme on Hunger Eradication and Poverty Reduction (NTP ON
HEPR) 32
Partners:
3.1.2 Programme 135
34
Bangladesh Institute of
4
Q3:
How have policies intended to benefit the chronically poor been enacted?
38
Development Studies
(BIDS),
Bangladesh
4.1
Evolution of NPT on HEPR
38
4.2 UKObjectives of NPT on HEPR
40
Development Initiatives,
4.3
Objectives of Programme 135
41
Development Research and
5
Q4: What happens to policies following enactment?
42
Training, Uganda
5.1
The main structural or institutional responsibilities for implementation
42
Economic Policy Research
5.1.1 Implementation Arrangement of NTP on HEPR
42
Center, Uganda
5.1.2 Responsibilities for HEPR programme management
43
FIDESPRA, Benin
5.1.3 Programme 135: Implementation Arrangement
44
HelpAge International,
UK
5.1.4
Responsibilities for Programme 135 management
45
5.2
Story
1:
Poverty
Reduction
in
Dien
Bien
province
45
Indian Institute of Public
Administration, India 5.2.1 Period from1998 to 2005
46
5.2.2
Period
of
2006-2010
48
IED Afrique, Senegal
5.3
Story 2: Hai Phong eradication of thatched houses programme
51
Institute of Development
5.3.1
Factors
constraining
credit
access
to
poor
households
55
Studies, UK
5.3.2 Factors limiting healthcare access to the poor
56
Overseas Development
5.3.3
Factors
constraining
implementation
of
Programme
135
at
commune
level
57
Institute, UK
5.3.4 Factors constraining implementation of Programme 135 at provincial level
58
Programme for Land and
6
Q5:
How
much
of
what
is
expected
in
terms
of
tangible
implementation
actually
occurs?
59
Agrarian Studies, South Africa
6.1
What is prioritised for spending/ action, and what isn’t and why?
59
University of Legon, Ghana
6.1.1 NTP on HEPR spending
59
University of Manchester,
6.1.2UK Programme 135 spending:
59
6.2UK What evidence is there that things are changing due to the trickle down of policy?
61
University of Sussex,
6.2.1 Pro-poor Public Spending and Investments in Infrastructure
61
6.3
Is there any M&E?
62
6.3.1 Monitoring Programme Performance
62
6.4
Does anyone know what is or is not being delivered/enforced?
63
6.5
What do representatives of chronically poor groups think about the record on
implementation?
63
Contact:
© Chronic Poverty Research
Centre 2008
Electronic copy available at: />
Viet Nam Country Case Study
7
Q6: Is there any evidence that implementation is delivering outcome/impact
improvements?
66
7.1
Healthcare benefits for the poor: Evidence
66
7.2
Education for the Poor
68
8
Q7: Finally, what are the implications for the PRS?
73
8.1
Are implementation problems linked to policy definition/ data and analysis issues?
73
8.2
Is it a problem of policy enactment i.e. turning a specific policy proposal into a piece of
legislation or a budget commitment?
73
8.3
Is the problem administrative follow-through? (lack of resources, weak technical capacity,
disinterest from field level bureaucrats, lack of M&E and clear lines of accountability)
73
8.3.1 Lack of resources
74
8.3.2 Weak technical capacity.
74
8.4
Is it the absence of clear policy constituencies for the chronically poor within government at
all levels?
75
8.5
Or is it an issue of complexity or multi-sectorality – i.e. CP policies are simply harder to do,
and PRSPs have helped do the ‘easy’ things better but have not yet really helped with the harder
and more politically sensitive things on the poverty agenda, at least not yet.
75
9
Recommendations
77
9.1
Definition of poverty should be revised to include text that contains disagregation of chronic
poverty77
9.2
Better targeting mechanism
77
9.3
Better system for monitoring and evaluation.
78
9.4
Further decentralisation
78
9.5
More participation from the bottom up
78
9.6
Rethinking of the development strategy of the upland areas.
79
9.7
Communication
79
9.8
Poverty reduction must work hand in hand with other ongoing reforms
79
9.9
Private sector involvement
80
9.10 More international technical support to government
80
Appendix 1
81
Vietnam Living Standard Surveys (VLSSs) and Vietnam Household Living Standard Survey
(VLHSSs)
81
Vietnam Living Standard Survey 1992-1993, VLSS 1993
81
9.10.1
Vietnam Living Standard Survey 1997-1998, VLSS 1998
82
Vietnam Household Living Standard Survey- VHLSS 2002
82
Vietnam Household Living Standard Survey- VHLSS 2004
83
Appendix 2
85
Administrative system and legislation enactment in Viet Nam
85
The state administrative system in Viet Nam
85
Ministries
86
Government-affiliated agencies
90
People’s committees at all levels
93
Appendix 3
97
Selected important government documents
97
Appendix 4
104
Independent studies on the impacts of the Policy on Healthcare for the Poor
104
Appendix 5
107
Ethnic minority development in Viet Nam: A socio-economic perspective
107
Appendix 6
110
Policy matrix of CPRGS
110
3
Viet Nam Country Case Study
Appendix 7
123
Characteristics of Dien Bien province
123
H'mong
125
Administrative unit
126
Appendix 8
127
Hai Phong city and Hien Hao commune of Cat Hai district
127
Appendix 9
128
Extracts from the UNDP/MOLISA Report 2005: Implications for design of NTP on HEPR for 20062010
128
Appendix 10
131
List of provinces in seven regions of Viet Nam
131
References
134
Figure 1: Maps of poverty incidence and density, poverty depth and severity across regions of
Viet Nam
18
Figure 2: Growth in real per capital expenditure by region, 1993-2004
21
Figure 3: Poverty rate by ethnic groups over time
23
Figure 4: Map of the population by ethnicity and commune level poverty rates
24
Figure 5: Organisational structure of the NTP for HEPR
36
Figure 6: Financial allocation for Programme 135 in 1999-2005
61
Figure 7: Provincial poverty rates in 2002 and net government transfers to and from provinces
in 2003
62
Table 1: GSO-WB expenditure poverty lines and poverty rates in Viet Nam
15
Table 2: MOLISA poverty lines and poverty rates in Viet Nam
15
Table 3: Poverty rates and poverty gap
19
Table 4: Poverty rates across regions
20
Table 5: Distribution of poor people across regions
22
Table 6: Distribution of the ethnic minority population and the poor ethnic minority population
23
Table 7: The results for overall HEPR efforts for 1999-2005 in Dien Bien province
47
Table 8: Results of Programme 135 for 1999-2005 in Dien Bien province
48
Table 9: Number of communes benefiting from Programme 135 over time
57
Table 10: Results of the implementation of Programme 135 during 1999-2004
59
Table 11: Financial allocation for implementation of Programme 135 during 1999-2005
60
Table 12: Budget transfers per capita 1999-2004 by regions
61
Table 13: Health insurance and free health card - expenditure quintiles
67
Table 14: Health outcomes, 2002-2004
68
Table 15: Access to water and sanitation
68
Table 16: School enrolment rates
69
Box 1: Perceived causes of poverty in Dak Lak province, Viet Nam
Box 2: Perceived causes of poverty in Ninh Thuan province, Viet Nam
Box 3: List of all NTPs
Box 4: Constraints in application of poverty thresholds
Box 5: Delays and errors in Poor Household Cards
Box 6: Factors constraining credit access to poor households
Box 7: Discrepant opinions on grass roots democracy in Ninh Thuan province
Box 8: A poor family in Hien Hao commune 39, Cat Hai district, Hai Phong province
4
24
25
35
54
54
55
64
70
Viet Nam Country Case Study
Abbreviations
ADB
Asian Development Bank
CEM
Committee for Ethnic Minorities
CPC
Commune Peoples’ Committee
CPRGS
Comprehensive Poverty Reduction and Growth Strategy
CRP
The Centre for Rural Progress
DARD
Department of Agriculture and Rural Development
DFID
Department for International Development (UK)
DOET
Department of Education and Training
DOH
Department of Health
DOLISA
Department of Labour, War Invalids and Social Affairs
DPC
District Peoples’ Committee
DPI
Department of Planning and Investment
EA
Executing Agency
GOVN
Government of Viet Nam
GSO
General Statistical Office
HEPR
Hunger Eradication and Poverty Reduction (Programme 133)
HEPR-JC
Hunger Eradication Poverty Reduction and Job Creation (Programme 143)
ICD
International Cooperation Department
IDS
Institute of Development Studies (Sussex, UK)
ILSSA
Institute of Labour and Social Science Affairs
M&E
Monitoring and Evaluation
MARD
Ministry of Agriculture and Rural Development
MDGs
Millennium Development Goals
MRDP
Viet Nam-Sweden Mountainous Rural Development Programme
MOET
Ministry of Education and Training
MOF
Ministry of Finance
MOLISA
Ministry of Labour, Invalids and Social Affairs
5
Viet Nam Country Case Study
MOH
Ministry of Health
MPI
Ministry of Planning and Investment
NTP
National Targeted Programme
P135
Programme 135
PER
Public Expenditure Review
PPA
Participatory Poverty Assessment
PPC
Provincial Peoples’ Committee
PRA
Participatory Rural Appraisal
PRSP
Poverty Reduction Strategy Paper
QHS
Qualitative Household Survey
SBV
State Bank of Viet Nam
UNDP
United Nations Development Programme
VBARD
Viet Nam Bank for Agriculture and Rural Development
VCP
Viet Nam Communist Party
VDGs
Viet Nam Development Goals
VFF
Viet Nam Fatherland Front
VHLSS
Viet Nam Household Living Standards Survey
Acknowledgements
The research for this Background Paper was made possible by CPRC core funding from the
United Kingdom's Department for International Development (DFID)
Author
Pham Anh Tuan is a Partner at Viet Insight, Vietnam.
Email:
6
Viet Nam Country Case Study
Summary
As part of the world chronic poverty report 2007-08, the Viet Nam case study attempts to
look at the various steps of implementation of policies meant to serve the chronically poor.
Specifically, the report will provide a thorough analysis of the two most important
programmes. The first is the National Targeted Programme on Hunger Eradication and
Poverty Reduction (NTP on HEPR). This programme is directly aimed at a demographic
group that is living below the poverty line (poor households). The second is the Programme
on Socio-economic Development for Communes faced with Extreme Difficulties in
mountainous and remote areas (Programme 135). This programme is directly aimed at a
geographic group who live in mountainous and remote areas of Viet Nam. The majority of
this group is comprised of people of ethnic minorities.
Research tools: The research projects make use of extensive literature reviews, interviews
and in-depth discussions with development
Dien Bien
Ha Noi
specialists and researchers in Ha Noi.
Hai Phong
Location of the field trips: Field trips were
conducted in Dien Bien province in the Northwest
mountainous areas and Hai Phong in the Red River
Delta. Dien Bien province was chosen because it
belongs to the poorest mountainous region with a
high density of ethnic minorities. Hien Hao
commune of Cat Hai district, Hai Phong City was
chosen because it presents a pocket of poverty in
one of the fastest growing regions. The selection of
the sites provides a West-to-East transect for the
study. The choice of the field trip sites is planned to
provide
a
cross-region
comparison
of
implementation of policy focus.
Structure of the report: Guided by the TOR, the
report follows the questions therein. Appendixes are
provided to help explain the specific settings of Viet
Nam and form an important part of the report,
providing information in the Viet Nam context for
understanding the specific points discussed in the main report.
7
Viet Nam Country Case Study
1
1.1
Introduction
Poverty analysis
In the formal document of CPRGS (Vietnamese version of PRSP), Viet Nam adopts the
definition of poverty introduced by the Asia-Pacific Conference on Poverty Reduction
organised by ESCAP in Bangkok, Thailand in September 1993, which reads:
[Poverty] “is a situation in which a proportion of the population does not enjoy the
satisfaction of basic human needs that have been recognised by the society
depending on the level of economic and social development and local customs and
practices.”
There is no disaggregation of chronic poverty within this statement.
In Viet Nam, some 20% of the population was poor in 2004compared to 58% in 1993.
Poverty is mainly a rural phenomenon as about 90% of the poor live in the rural areas.
Poverty rates are highest in the mountainous and remote areas in the Northwest and Central
Highlands. Pockets of persistent poverty can be found in the urban areas and in fast-growing
lowland areas. Poverty severity is also high in the mountainous areas. The poverty gap for
ethnic minorities is the widest. The poverty reduction rate for Viet Nam as a whole is
impressive, but not for ethnic minorities. Food poverty for ethnic minorities is very high and
improving slowly. This suggests that pro-poor growth policies alone may not work for ethnic
minorities.
1.2
Policy focus
Two programmes are selected as policy foci for this study. They are (i) the National Targeted
Programme on Hunger Eradication and Poverty Reduction (NTP on HEPR); and (ii)
Programme on Socio-economic Development for Communes faced with Extreme Difficulties
in mountainous and remote areas (Programme 135). These two programmes came into
existence long before CPRGS (PRSP of Viet Nam) and after the introduction of CPRGS.
These two programmes continue to be the most important programmes directly targeted at
the poor and the poor regions of Viet Nam.
The selection of the two programmes is based on the following reasons. Firstly, the two
programmes are most relevant to the chronically poor in that while NTP on HEPR targets the
socially and economically disadvantaged group (i.e. the economically poor and food poor),
Programme 135 targets geographically isolated groups (mountainous areas). Secondly, both
programmes are big enough and have been operating for a long time, allowing for
meaningful analysis and comparison over time. Finally, being highly prolific, there are a lot of
literatures about the two programmes. These include government reports, research reports,
reviews, assessment, and PPAs and media coverage. In addition, data extracted from
VLSSs and VHLSSs contains a lot of information on the programmes. This provides a rich
source of information for this case study.
8
Viet Nam Country Case Study
1.3
Research questions
1) How have policies intended to benefit the chronically poor been enacted?
The recent history of Viet Nam since the French colonisation has been one characterised by
poverty. Therefore, the society has deep sympathy for the poor. The Communist party of Viet
Nam seized power from the French colonists in 1945 and won the war against America in
1975 because it had the support from the poor. Recently, the crises at the grassroots level in
the late 1980s and during the 1990s put heavy pressure on the Government to make policies
more pro-poor and to create special programmes directly targeted at the poor. Poverty
reduction has been given high priority in the development agenda in Viet Nam since reform,
which started in the late 1980s.
At the national level, poverty reduction was first reflected in the Communist party's
resolutions. Then it got progressed through to the Government long-term (5 years) and
annual socio-economic development plans (normally in terms of targets and indicators, most
recent ones are the Viet Nam millennium development goals). National targeted programmes
were designed to improve the indicators for the poor. Fund allocation for these national
targeted programmes are included in the annual national budget and then get disbursed to
the executing agencies at both national and local levels through the national treasury system.
The Prime Minister will sign an executive order1 to launch a national targeted programme.
Such an executive order would indicate the programme objectives, target groups, fund
allocation and sources, implementation arrangement, executing agencies and their
responsibilities, monitoring and evaluation.
2) What happens to policies following enactment?
At the national level, after the executive order, the relevant government ministries, basing on
the content of the order and their mandates, would prepare and issue guidelines for
implementation. The executing agencies would form the Steering committee represented by
various ministries/agencies. The chairperson, who is the Deputy Prime Minister, often leads
this steering committee. A programme management office would be set up, often hosted by
the lead ministry/agency, to prepare detailed annual work plans, budgets, and programmes
of activities, monitoring and evaluation for approval by the Steering committee. It also serves
as the coordination agency of the programme to manage the daily work of the programme.
At the local level, the provincial party cell and the government are responsible for carrying
out the national targeted programmes in accordance to the guidelines set out by the national
government agencies (ministries). These implementation plans would get reflected at the
local level socio-economic development plans. Relevant local government agencies would
be assigned to implement the plan. At the same time, local governments also initiated their
own programmes, using their own funds from the local budget revenues.2 The
implementation sep up is similar to that at the central level. The Vice Chair of the People’s
Committee heads the steering committee.
1
2
Decision- see Appendix 2 for more information on the administrative and legislation system.
Please see "Evolution of NTP on HEPR' in Question 3 and story 1: "Poverty reduction in Dien Bien" in Question 4.
9
Viet Nam Country Case Study
In the implementation process changes are being made in areas of budget, services,
capacity building, communication and public awareness. Reports of executing agencies
(MOLISA, CEM etc.) and evaluation report conducted by UNDP and MOLISA cited
improvement in the budgeting process, whereby planning and budgeting for the programmes
are becoming a routine and normal planning process of the line ministries (executing
agencies) and the local authorities and are becoming more transparent. After evaluation of
NTP on HEPR and Programme 135 jointly conducted by UNDP and MOLISA in 2005,
recommendations have been take into account in the preparation of the two programmes for
the 2006-2020 period. Major changes include more emphasis on implementation at the local
level by giving more power and budget to local level executing agencies, more emphasis on
communication to the public and the beneficiaries and more attention to "soft" component
(capacity building, training and institutional development) as compared to the 2000-2005
implementation period. In addition, international donor community including UNDP, World
Bank and other bilateral donors is providing more and more support to the implementation of
the two programmes. Support comes into two forms: i) technical assistance given to
management of the programme (UNDP supports the management of Programme 135) and
budget support. The World Bank is preparing a budget support of around USD 150 million for
Programme 135 for 2006-2010.
Important to the chronically poor are the tangible results of the programmes. This include the
improved in household welfare in terms of increased income and access to education,
healthcare services, electricity, clean water and better transportation. The programmes have
made important contribution in improving these aspects for the poor and the poor
communities across Viet Nam. Another area that is important to the chronically poor is
participation in the programme. This requires good communication about the benefits of the
programmes to the poor, responsibilities/mandates of the executing agencies, results and
impacts of the programmes. This also requires a high level of decentralised power given to
lower level implementing agencies. To some extent, participation of the poor into the
implementation of the programmes is not only a mean to an end, but an end in itself. In this
regard, the two programmes still have room for improvement. However, the lessons have
been learnt and recommendations to correct these shortcomings have been incorporated
into the next phase of implementation of 2006-2010 period.
There are a number of factors that block implementation. These include targeting
mechanism, difficult operating conditions (transportation, mountainous areas), poor capacity
both human and financial resources, poor administration and poor design of the subprogramme and projects. There are cases of conflict of interests.
1.4
Recommendations
1) Definition of poverty should be revised to include text that contains disaggregation of
chronic poverty.
This would make chronically poor group visible in policy process and therefore induce
associated policies most relevant to help the chronically poor. Viet Nam has entered into a
new stage of the fight against poverty, whereas growth alone does not bring the same
poverty reduction effect as before. This new thinking should take into account the diverse
10
Viet Nam Country Case Study
needs of the different poor and vulnerable groups in different areas, with different ethnic and
cultural backgrounds. The diversity of causes of poverty calls for a greater policy diversity.
2) Better targeting mechanism.
There is a need to improve the current practices used to identify poor households. Targeting
mechanism should be more sensitive to vulnerable groups that are normally invisible in the
policy process. These groups include those who live in geographically remote and isolated
areas, mostly ethnic minorities, and single mothers, chronically ill, disabled and elderly
people. Also, we should not forget that there are pockets of persistent poverty in the middle
of the more developed urban parts of the country. These normally include street children;
people contracted HIV/AIDS, jobless or homeless. Also, there should be efforts to include
those who are referred to as "social evils" in HEPR programmes. These include "lazy"
people, drunken, drug addicts, gamblers etc.
3) Better system for monitoring and evaluation.
There was no systematic mechanism installed in the NTP on HEPR and Programme 135 in
the previous period of 2001-2005 to collect data and information to monitor
progress/performance or evaluate impacts of the interventions. However, an M&E is being
installed for the next phase of implementation (2006-2010). Among other things, capacity
building for government officers on this area of expertise is important. In addition, there is a
need to make monitoring and evaluation increasingly participatory at the grassroots level to
encourage the local people and institutions to supervise the implementation process.
4) Further decentralisation.
Too little decentralisation was done in the implementation of Programme 135 for 2001-2005.
One of the principles of Programme 135 was to decentralise implementation to commune
level and this was not materialised. The explanation was the inadequate capacity of the
commune level to manage. Some fear of misuse of funds. Clearly, these concerns are real
and legitimate. But, it is also clear that little was done to build up capacity at the grassroots
level to manage and there was not much effort from the Programme to provide guidelines on
the responsibilities and accountabilities of the various agencies and individuals at the
commune level. Discussions with officers at different levels revealed a reluctance of officers
at higher levels to delegate power to the lower levels. The success of the future phase of the
programmes is dependent on the ownership and leadership of the local government to push
implementation to higher and more difficult limit.
5) More participation from the bottom up.
An encouraging trend is that planning and implementing development programmes have
become increasingly participatory. Nation-wide, government effort in improving planning
process in the preparation of national and provincial socio-economic development plans3 has
promoted participation of various stakeholders through consultative process. In order to
further institutionalise this participatory process, it is advisable to include scholars, members
3
MPI report on streamlining CPRGS into national and provincial annual and 5-year socioeconomic development planns,
November 2005
11
Viet Nam Country Case Study
of the emerging civil society and journalists into the HEPR committees at all levels when
possible.
6) Rethinking of the development strategy of the upland areas.
Many scholars criticise that socioeconomic development plans for the upland areas are
based on the lowland perceptions, which are often ungrounded. Current social and economic
development trends and movements such as decentralisation, grassroots democracy and
accelerating integration into the global market give a better chance as well as necessitate a
new approach to development issues in the upland areas. This new approach should move
towards the direction of delegating more authority to the provincial, district and commune
level, putting the interest of the poor and ethnic minorities at the central stage of the
development while protecting the national interest regarding national defence and security,
and integrating the uplands into the mainstream development of the country.
7) Communication.
This area was considered weak in the implementation period 2001-2005. CEM report (CEM
2005) revealed that the Programme did not meet the target regarding mobilisation of funds
contributed from businesses and individuals. This was partly due to the absence of an
effective communication strategy to enlist the support of the public at large to the
Programme. Various studies reported that knowledge about the programmes and the
associated benefits to the poor was very limited. In addition, limited information on the
programmes' coverage and status of the implementation bred corruption and created
suspicions. The communication strategy for the next phase of Programme 135, which was
already designed, has taken into account these shortcomings. But the challenge is to push it
through the bureaucracy in the implementation stage.
8) Poverty reduction must work hand in hand with other ongoing reforms.
Participation of the grassroots people in planning, implementation, supervision and
evaluation will not be possible if grassroots democracy is not materialised; empowering
people will not be made possible if decentralisation is slow and officers in charge are clinging
to power; accountability of the officers in power will not be checked and the voice of the weak
will not be heard if the role of press is limited. Currently, the Government is pushing on all
fronts including accelerating PAR, intensifying the fight against corruption, promoting
grassroots democracy and delegating more power to the lower level of government. As the
pace of change in this country is fast, these reforms need to accelerate further.
9) Private sector involvement.
The second phase of NTP on HEPR and Programme 135 will see more coverage and
outreach and inclusion of services that are delivered at the households level, such as training
of farmers, organising farmer into groups and creating demonstration models. This will
require a lot of human resources to carry out these activities. The present capacity at all
levels has already strained. Therefore, there is a need to promote the participation of the
private sector into the implementation of the programmes. This requires, among other things,
12
Viet Nam Country Case Study
the change in the role of government from the providers of services to facilitators of the
transaction.
10) More international technical support to government.
Ultimately the international community will phase out, as Viet Nam is getting richer. This
means that Vietnamese have to take over many tasks that are currently performed and
delivered by specialist employed by the donors. In order to ensure smooth handover, Viet
Nam needs to learn about a lot of things. This means an overall upgrade of human capacity
from the part of the government. This works best in the form of technological transfers when
Vietnamese officers or professional working together in tackling specific problems in real life.
The range of issues involved includes setting up institutions, procedures and building
capacity.
13
Viet Nam Country Case Study
2
Q1: Who are the chronically poor in the country?
Undertake an initial mapping of national chronic poverty, where possible this should be
broken down into geographical areas as well as socio-economic analysis (see definition of
Chronic Poverty below).
2.1
Definition of poverty
In the official document of the Comprehensive Poverty Reduction and Growth Strategy
(CPRGS), the government of Viet Nam accepts the definition of poverty introduced by the
Asia- Pacific Conference on Poverty Reduction organised by ESCAP in Bangkok, Thailand in
September 1993 which reads:
[Poverty] “is a situation in which a proportion of the population does not enjoy the
satisfaction of basic human needs that have been recognised by the society
depending on the level of economic and social development and local customs and
practices.”
The definition does not provide any disaggregation of the chronic poverty, but the objective of
Viet Nam's very first national targeted programme on hunger eradication and poverty
reduction is to eradicate chronic hunger. Despite the absence of chronic poverty
disaggregation a number of policies and programmes were designed and implemented
targeting at chronic hunger since early 1990s.
2.2
Measurement of poverty
Presently, there are two parallel methods of measuring poverty in Viet Nam- International
Poverty Line Measurement Method and National Poverty Line Measurement Method.
The first method to define the poverty lines based on international standards was developed
by the General Statistical Office4 (GSO) with support from the World Bank and was used
since the first Viet Nam Living Standards Surveys (VLSS) in 1993.
The definition of the food poverty line is based on the standard used by most developing
countries and WHO as well as international organisations, i.e. average 2,100 Kcal daily
calorie intake per capita. People whose expenditures are lower than this minimum level are
considered poor in terms of food.
The method to define the total poverty line is to add the costs of non-food to the minimum
expenditures. By adding this amount to the amount for the food poverty line, we have the
total poverty line.
There have been four surveys to obtain panel data5, two focusing on living standards (1993
and 1998) and two recent ones set focus on household living standards (2002 and 2004)
(See Appendix 1 for more information on these survey). During this period, the poverty lines
have also been revised to reflect the new developments in the social and economic picture of
4
General Statistical Office (GSO) is the government agency responsible for collecting socio-economic data, building and
managing national socio-economic database.
5
There is no data to track down the poverty mobility.
14
Viet Nam Country Case Study
Viet Nam. The table below gives the changes in absolute values at current prices of the
poverty lines over the years and the associated poverty rates.
Table 1: GSO-WB expenditure poverty lines and poverty rates in Viet Nam
Year
1993
1998
2002
2004
Poverty lines
Food Poverty
750,000
1,287,000
1,382,000
1,500,000
Overall Poverty
1,160,000
1,790,000
1,917,000
2,077,000
Food poverty
25%
15%
11%
7.8%
Overall Poverty
58%
37.4%
29%
24.1%
Poverty rate
VND/person/year
The second method, developed by Ministry of Labour, Invalids and Social Affairs (MOLISA)
of Vietnam is based on the level of the economy and the rate of economic growth, the
financial resources committed for poverty reduction for each period of time, and actual living
standards of Vietnamese in specific regions. The welfare indicator is then measured by per
capita income adjusted for regional differences by expressing in terms of the number of kg of
rice. The purposes of this compilation are:
1. To identify who are the poor and which communes are poor with specific numbers
and addresses in order to develop a list of poor households from the village and
commune level; and
2. That of poor communes from the district level upward, who are eligible for support
from the National Targeted Poverty Reduction Program and other support policies.
The first effort in developing the poverty line also took place in 1993 and then, revised in
1995 for national periodical report of poverty situation. Overtime, the poverty lines and
poverty rates according to this method have evolved as depicted in Table 2.
Table 2: MOLISA poverty lines and poverty rates in Viet Nam
Year
1996- 1997
1998- 2000
2001- 2005
2006- 2010
Urban
840,000
960,000
1,800,000
3,120,000
Rural
600,000
840,000
1,200,000
2,400,000
660,000
960,000
2,400,0006
1998
2002(*)
2004(**)
Poverty lines
Mountainous
Poverty rate
6
1994
There was no separate measurement of poverty line for mountainous areas in the 2005 definition of poverty. It falls under rural
category.
15
Viet Nam Country Case Study
Overall Poverty
23.1%
17.2%
14%
9%
VND/person/year
Note: (*) the revised poverty line was introduced in 2001, then 2005 making the poverty rate of 2005 of
22%
Source: IDRC (2004)
As a matter of fact, these two methods are moving towards harmonising. The most currently
revised poverty lines of MOLISA7 was also based on consumption needs using expenditure
of households with a basket of around 40 products to ensure the average 2,100 Kcal daily
calorie intake per capita as recommended by the World Bank as well as some other nonfood items.
Another method is the poverty mapping developed by the Inter- Ministerial Poverty Mapping
Task Force in 2003 (supported by New Zealand Agency for International Development). This
is the result of the application of a relatively new method called “small area estimation” which
combines household survey and census data to generate estimates poverty and inequality at
the provincial, district, and commune levels in Vietnam with the poverty rate is measured by
the number of people, not household, living under the poverty line which is the same one
applied by GSO-WB approach. It then explores the ability of agro-climatic variables and
market access to "explain" the spatial variation in poverty. The calculation also helps to
reveal how the geographic determinants of poverty vary across the country. One key result of
this indicates that poverty is greatest in the north and in rural upland areas and least in urban
areas, with the delta areas having intermediate poverty rates. The results generally match
conventional wisdom, though they differ markedly from district poverty estimates currently
used by the government's anti-poverty programs to identify the eligible target groups and
individuals. (See Figure 1)8.
There are certain strengths and shortcomings of each method of measuring and monitoring
poverty.
For the WB/GSO method, the surveys were conducted with high standards, which provide
very important and reliable source of information (large panel data) for evaluating and
designing socio-economic plans, programs and policies (Nguyen, Phong (2005)). However,
there requires very high associated costs. In addition, due to the sample size, while
inferences on poverty rates at the national and regional level are robust, inferences at the
provincial and district levels are not reliable. Therefore, while useful for comparison over time
and across regions, this method is not useful for targeting purpose as it can not point to who
the poor are and where they live.
MOLISA method, making use of current administrative system to conduct annual poverty
assessment, is not as costly. The main disadvantages of this system include the different
poverty lines and the variety of data collection in terms of guidelines and enumerators across
certain provinces (The Inter- ministerial poverty mapping task force, 2003). As a result,
7
8
Issued accordingly to Decision 170/2005/QD- TTg on 08 July 2005 of the Prime Minister.
For more detail please see "The Inter- Ministerial Poverty Mapping Task- Force, N. Minot, B. Baulch and M. Epprecht, 2003,
Poverty and Inequality in Vietnam: Spatial patterns and geographic determinants.
16
Viet Nam Country Case Study
poverty rates computed by MOLISA is normally lower than local perceptions, hence, missing
out many poor. The limited resources committed to poverty reduction the Government faces
explain this weakness. In addition, the identification of the poor households is driven by the
pressure to meet the poverty reduction targets by higher government level. (MOLISA& UNDP
2005). The strength of this method, though, lies in the fact that it is useful for targeting
purpose.
Poverty mapping, although allowing for low level poverty estimates with consideration of
agro- climatic and market factors, can not be done regularly due to the need of national
census data which is conducted only once for every ten years. Even with the use of
agricultural census, the estimates is valid for every five years and only rural poverty
estimates can be possible. Besides, there is still a question of the discrepancies between the
estimates and the results of MOLISA, which requires research to find out further insights to
the issue.
17
Viet Nam Country Case Study
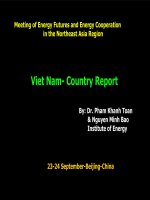
Figure 1: Maps of poverty incidence and density, poverty depth and severity across regions of
Viet Nam
Poverty Incidence
Poverty Density
Poverty Depth
Poverty Severity
Source: The Inter- Ministerial Poverty Mapping Task Force (2003)
Poverty gaps reflect the average distance between the expenditures of the poor and the poverty line.
The poverty gap (P1) measures the depth of poverty, the average distance of the poor to the poverty
line in relation to the poverty line.
The poverty gap squared (P2) depicts the severity of poverty, reporting the degree of inequality among
the poor.
18
Viet Nam Country Case Study
2.3
Poverty Analysis9
Our poverty analysis will mainly make use of the data generated through VLSS and VHLSSViet Nam Households Living Standards conducted by GSO.
Table 3 below depicts impressive poverty reduction records in Viet Nam. Over a period of a
decade or so, expenditure-based poverty rate went down from 58.1% in 1993 to 19.5% in
2004 representing a drop of 37% percentage points allowing the country to cut two thirds of
the poor population. In other words, more than 20 million people have been lifted out of
poverty for a decade. However, ethnic minorities as a group have been lagging behind. More
than 60% of them are poor and more than one third of them go to bed hungry (34.2% food
poor). The poverty gap for ethnic minorities is widest and improving very slowly.
Table 3: Poverty rates and poverty gap
In percent
1993
1998
2002
2004
General poverty
58.1
37.4
28.9
19.5
Urban
25.1
9.2
6.6
3.6
Rural
66.4
45.5
35.6
25.0
Kinh and Chinese
53.9
31.1
23.1
13.5
Ethnic minorities
86.4
75.2
69.3
60.7
24.9
15.0
10.9
7.4
Urban
7.9
2.5
1.9
0.8
Rural
29.1
18.6
13.6
9.7
Kinh and Chinese
20.8
10.6
6.5
3.5
Ethnic minorities
52.0
41.8
41.5
34.2
18.5
9.5
6.9
4.7
Urban
6.4
1.7
1.3
0.7
Rural
21.5
11.8
8.7
6.1
Kinh and Chinese
16.0
7.1
4.7
2.6
Ethnic minorities
34.7
24.2
22.8
19.2
Food poverty
Poverty gap
Note: Poverty rates are measured as a percentage of the population. Poverty gaps reflect the average
distance between the expenditures of the poor and the poverty line, in percentage of the latter.
Source: VLSS 1993- 1994, 1997- 1998 and VHLSS 2002 and 2004. Data for 2004 was computed by
Nguyen Viet Cuong.
9
This session draws heavily on WB, 2004, Nguyen Viet Cuong and Nguyen Thang.
19
Viet Nam Country Case Study
Table 4: Poverty rates across regions
In percent
1993
1998
2002
2004
General Poverty
58.1
37.4
28.9
19.48
Northern Mountains
81.5
64.2
43.9
35.39
North East
86.1
62
38.4
29.38
North West
81
73.4
68
58.57
Red River Delta
62.7
29.3
22.4
12.14
North Central Coast
74.5
48.1
43.9
31.90
South Central Coast
47.2
34.5
25.2
19.01
Central Highlands
70
52.4
51.8
33.15
South East
37
12.2
10.6
5.37
Mekong Delta
47.1
36.9
23.4
15.82
24.9
15
10.9
7.39
Northern Mountains
42.3
32.4
21.1
16.19
North East
29.6
17.6
15.4
11.38
North West
26.2
22.1
46.1
34.77
Red River Delta
24.2
8.5
5.3
2.33
North Central Coast
35.5
19
17.5
13.57
South Central Coast
22.8
15.9
9
8.13
Central Highlands
32
31.5
29.5
18.81
South East
11.7
5
3
1.46
Mekong Delta
17.7
11.3
6.5
3.95
18.5
9.5
6.9
4.72
Northern Mountains
29.0
18.5
12.3
9.50
North East
29.6
17.6
9.6
7.01
North West
24.1
22.1
24.1
19.11
Red River Delta
18.3
6.2
4.3
2.11
North Central Coast
24.7
11.8
10.6
8.09
South Central Coast
17.2
10.2
6
5.10
Central Highlands
26.3
19.1
16.7
10.64
South East
10.1
3
2.2
1.20
Mekong Delta
13.8
8.1
4.7
2.99
Food Poverty
Poverty Gap
Note: Poverty rates are measured as a percentage of the population. Poverty gaps reflect the average
distance between the expenditures of the poor and the poverty line, in percentage of the latter.
Source: VLSS 1993- 1994, 1997- 1998 and VHLSS 2002 and 2004Data for 2004 were computed by
Nguyen Viet Cuong.
The lower part of Table 4 shows how the poverty gap changed over time across regions.
North West has the widest gap and has shown slowest progress. Though still high, poverty
gap in Central Highlands has been reduced quite substantially. Poverty gap in other regions
20
Viet Nam Country Case Study
also has been reduced. Red River Delta and South East in particular managed to reduce
poverty gap by 9 times to make it quite small in 2004.
Figure 3 below shows the rates of the growth of real per capita expenditure vary substantially
across regions during the 1993-2004 period. The South East, North East and the Red River
Delta grew faster at 133%, 117% and 111% respectively, while the North West, the Mekong
River Delta and the South Central Coast grew at 52%, 63% and 67% respectively. As a
consequence, gap between the best performing regions and the lagging region have
widened. Specifically, if in 1993, per capita expenditure in the South East and the Red River
Delta were respectively equal to 1.91 and 1.37 times of that in the North West, these ratios
rose to 2.93 and 1.89 respectively in 2004.
Figure 2: Growth in real per capital expenditure by region, 1993-2004
1993
1998
2002
4000
3554
3500
3072
2696
3000
2500
2004
4175
4500
2296
1996
2000
1500 1279
2375
2039
1822 1799
1579
1492
1424
2046
1752
943
1427
1241
1064
988
936
North East
North West
1349
1000
1950
1521
1256
1140
1788
2361
2034
1722
1451
500
0
Red River
Delta
North
Central
Coast
South
Central
Coast
Central
Highlands
South East
Mekong
River Delta
Unit: VND in thousands, 1993 prices
Source: Nguyen Thang, 2006
Table 5 looks at the distribution of poverty across regions in percentage of the total poor,
collated with their shares of the total population. This table tells an identical story as Table 4.
The North Mountains accounts for 14% of the population, but 26% of the total poor. The
situation is worsening over time, reflecting the fact that the gap between this region and the
rest of the nation is widening. Next is the Central Highlands, which accounts for 6% of the
population but 10% of the total poor, and the situation is not improving. The situation is the
same with North Central Coast. Regards to food poverty, the contrast is starker. While the
three regions combined accounts for 33% of the total population, their share of food poverty
is 69% and general poverty is 57%.
21
Viet Nam Country Case Study
Table 5: Distribution of poor people across regions
1993
1998
2002
2004
2004 Population
100
100
100
100
100
Northern Mountains
23
25
22
26
14
North East
19
20
16
17
11
North West
4
6
7
9
3
Red River Delta
24
18
17
14
22
North Central Coast
16
18
20
21
13
South Central Coast
5
8
7
8
9
Central Highlands
3
5
10
10
6
South East
11
5
5
4
16
Mekong Delta
17
21
17
17
21
100
100
100
100
100
Northern Mountains
26
32
28
31
14
North East
22
24
17
18
11
North West
4
7
11
14
3
Red River Delta
24
13
11
7
22
North Central Coast
18
18
22
24
13
South Central Coast
5
9
7
9
9
Central Highlands
3
8
16
14
6
South East
9
5
4
3
16
Mekong Delta
15
16
13
11
21
In percent
General Poverty
Food Poverty
Note: Poverty rates are measured as a percentage of the population.
Source: VLSS 1993- 1994, 1997- 1998 and VHLSS 2002 and 2004Data for 2004 were computed by
Nguyen Viet Cuong.
Further analysis of ethnic minorities reveals that although they live in all regions of the
country, more than half of them live in the northern uplands. Nevertheless, the North East
and Mekong delta regions have a larger share of the total ethnic minority population than of
the poor ethnic minority population. By contrast, poor ethnic minorities are disproportionately
concentrated in the North West and Central Highland regions (Table 6), most intensified in
the North West with the share of poor ethnic minorities has risen from 12 percent to 20
percent in the period between 1998 and 2002 (Swinkels and Turk, 2004).
22
Viet Nam Country Case Study
Table 6: Distribution of the ethnic minority population and the poor ethnic minority population
1998 poor ethnic
minorities
2002 poor ethnic
minorities
2002 all ethnic
minorities
100
100
100
North East
36
31
36
North West
12
20
17
Red River Delta
4
2
2
North Central Coast
2
9
8
South Central Coast
12
4
3
Central Highlands
22
21
18
South East
3
3
4
Mekong Delta
9
9
12
In percent
All Vietnam
Source: Swinkels, R. and Turk, C., 2004
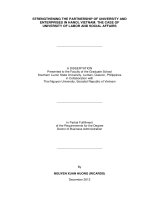
Swinkels and Turk (2004) further consolidated their finding by looking into the northern
mountainous region. Their calculation using VHLSS continues to report that the Kinh people
living in the same region have experienced rapid improvements in welfare, even faster than
that for the Kinh population as a whole over that period.
Figure 3: Poverty rate by ethnic groups over time
Source: Swinkels, R. and Turk, C., 2004, compiled from VLSSs and VHLSS
Poverty mapping by the Inter- Ministerial Poverty Mapping Task Force further supports the
argument that incidence of poverty, its depth and density are all highest in the North
Mountainous (especially the North west sub-region) and Central Highlands. At the same
time, these areas are of lowest density of poverty. This gives some warnings in the costly
resources needed for attacking poverty matters in these areas: for solving the deep roots of
causes as well as the lacking of economies of scale (Figure 1).
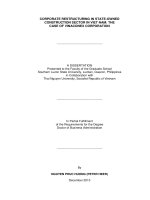
Another mapping work of ICARD and NCCR in 2004 using the Population and Housing
Census of 1999 allows a mapping of the population by ethnicity. Putting the ethnicity map of
23
Viet Nam Country Case Study
Vietnam together with the poverty map, a resemble is depicted (Figure 4) (Swinkels, R. and
Turk, C., 2004).
Figure 4: Map of the population by ethnicity and commune level poverty rates
Source: ICARD, GSO and NCCR (2004)
2.4
Causes of poverty
Surveys and poverty assessment have identified a number of common causes to poverty.
Below are two examples from two PPAs and the consolidated information summarised in
CPRGS. The World Bank report in 2004 on poverty extracted the result of the PPA in Dak
Lak province on the perceived causes of poverty, which is shown in Box 1.
Box 1: Perceived causes of poverty in Dak Lak province, Viet Nam
Perceptions of people
Perceptions of local authorities
• Poorly developed factor and product markets,
• Lack of capital,
• Poor infrastructure, especially irrigation and
roads,
• Shortage of land,
• Ineffectiveness of Government policies and
programmes at grass-root level,
• Lack of transparency, accountability, resulting
in corruption, lack of people’s participation in
decision making,
• Inability and weakness
authorities and cadres,
of
grass-roots
• Villagers’ inability to apply new farming
techniques and low level of education,
• Shortage of land,
• Lack of capital,
24
• Many dependents to support,
• Lack of experience, and inability and
incapacity to apply new farming techniques,
• Investment failure, risks in agriculture (coffee
price destabilisation)
• Poor health, disability, ageing.
• Lack of labour,
• Committed to social diseases, and laziness,
• Harsh climatic conditions, i.e. droughts and
floods.
Viet Nam Country Case Study
• Free immigration,
• Poor health and lack of labour,
• Harsh climatic conditions, drought and floods.
Another example from another PPA in Ninh Thuan province, Viet Nam share similar causes
as can be seen in Box 2.
Box 2: Perceived causes of poverty in Ninh Thuan province, Viet Nam
Local perception
Official perception
• Drought-ridden and/or non-arable land,
• Lack of capital,
• Jobless,
• Multiple dependents,
• No capital,
• Elderly: with no means of support,
• Lack of knowledge,
• Lack of arable land,
• High cost of education,
• Jobless,
• Poor and/or limited land,
• Lack of technical knowledge relating to
agricultural production,
• Elderly: with no means of support,
• Women: widowed or husbands left for another
woman.
• Lack of able-bodied family members,
• Lack of capital.
The CPRGS summarised and consolidated the findings from poverty assessments to specify
a number of major causes and major Factors Contributing to Poverty.
1) Limited and Poor Resources
Poor people tend to lack many resources and fall into a vicious cycle of poverty and lack of
resources. Poor people are likely to remain poor because they are unable to invest in their
own human capital. At the same time, limited human capital prevents the poor from escaping
from poverty.
Poor households have very little land, and this condition of lacking land tends to perpetuate.
This is especially the case in the Mekong River Delta. Their lack of land affects their capacity
to ensure food security and prevents them from diversifying their production and shifting to
higher value crops. A majority of the poor choose the strategy of self-sufficiency, and stick to
traditional modes of production that generate low value, because they lack opportunities to
employ more profitable production strategies. Because of their pursuit of traditional modes of
production, their productivity is low, their products are not competitive and are of low value;
this in turn keeps them trapped in a vicious cycle of poverty. In addition, most of the poor do
not have many opportunities to access production enhancing services like agricultural and
fishery extension and animal and plant protection from disease. Many production inputs such
as electricity, water, crop seeds and animal varieties, fertilisers, etc. drive up their production
costs, and cut into their per unit net revenues. Poor people also have limited access to
various sources of credit. Without enough capital, the poor cannot easily renovate
production, introduce new technologies and new varieties, etc. Although the access of the
poor to credit has improved greatly thanks to the Project on Providing Credit to the Poor
under the National Program on Poverty Reduction, a considerable number of poor people,
25