Does owership structure affects firm performance the evidence from vietnam stock market
Bạn đang xem bản rút gọn của tài liệu. Xem và tải ngay bản đầy đủ của tài liệu tại đây (651.48 KB, 22 trang )
Does ownership structure affect firm performance? Evidence from the
Vietnamese stock market
Lai Hoanga,b,* , Cuong Nguyena, Baiding Hua
a
Faculty of Commerce, Lincoln University, New Zealand
b
School of Banking and Finance, National Economics University, Vietnam
This version: 17 Oct 2016
Abstract
This study examines effect of ownership structure on firm performance of manufacturing companies
listed on the Hochiminh Stock Exchange (HOSE). System-GMM is employed to address endogeneity
of ownership structure as well as dynamic nature of its relationship with firm performance. The empirical
results show a cubic relationship between managerial ownership and Tobin’s Q, i.e. positive at low and
high level of managerial ownership, and negative at the middle. Meanwhile, block ownership has no
impact on firm performance, implying the more important role of building internal incentives comparing
to external monitoring in corporate governance. On the other hand, we also found an inverted U-shaped
relationship between state ownership and Tobin’s Q, indicating that partial privatization could be an
efficient way to improve firm performance.
Keywords: ownership structure, managerial ownership, block ownership, state ownership, firm
performance.
JEL Codes: G32, G34.
*
Corresponding author. Tel: + 64 273593522, + 84 944656365
Email address :
1
Electronic copy available at: />
1
Introduction
The separation of ownership and control in the modern corporation model leads to the well-known
agency problem (Fama & Jensen, 1983; Jensen & Meckling, 1976), i.e. managers have incentives to
exploit firm’s resources to serve their private purposes rather than that of shareholders (Jensen, 1986).
Meanwhile outside owners’ incentives in supervising managers is weaken by the “free rider problem”.
Therefore, highly concentrated ownership structure is expected to alleviate both agency problem and
free rider problem as it aligns interest of managers and outside shareholders (convergence-of-interest
hypothesis), as well as increases efficiency of monitoring mechanisms (monitoring hypothesis). Two
common measures of ownership concentration are fraction of shares owned by the largest shareholders
(block ownership) and by firm managers (managerial ownership1). Since large shareholders could affect
firm strategies and operations through their significant voting rights and controlling power, block
ownership represents the ability and motivation of shareholders in monitoring managers (external
pressure). On the other hand, managerial ownership reflects inner incentives of the management team
itself in operating firm effectively (internal motivation). High ownership concentration enhances both
external pressure and internal motivation, therefore could positively affect firm performance.
However, Shleifer and Vishny (1997) argued that the agency problem could also exist among
shareholders. Because of their significant influence, large shareholders could abuse that power to
exploit company’s resources and harm the efficiency of the firm as a whole (expropriation hypothesis).
The expropriation could be in various forms, such as pecuniary or unfair related party transactions, i.e.
selling firms’ products to other companies owned by the controlling shareholder at lower-than-market
price, or buying at higher-than-market price (Barclay & Holderness, 1989). On the other hand, Shleifer
and Vishny (1989) stated that if managers own sufficient shares to classify themselves as significant
large shareholders, they may have enough power and influence to ignore both shareholders’ and
market monitoring mechanisms to entrench their employment and salary, as well as stay on the job
even if they are no longer applicable. As monitoring mechanisms become ineffective, agency problem
become severe. Thus, it is possible that the increase of managerial ownership, especially at high level,
negatively affects firm performance (entrenchment hypothesis).
1The
term managerial ownership is normally used interchangeable with insider ownership or board
ownership.
2
Electronic copy available at: />
The relationship between state ownership and firm performance has also attracted significant concern.
The last few decades witnessed a tidal wave of privatization in transition economies of the former Soviet
Union and Western Europe. Although the efficiency of these privatization programs is inconclusive, it is
widely accepted that from financial perspective, state-owned enterprises (SOEs) normally perform
worse than private-owned counterparts. The failure could be attributable to the dual principal-agent
problem in SOEs: managers are agents of the state in daily decision making process, but the state is
in turn the agent of “true” owners: the voting population (Yarrow, King, Mairesse, & Melitz, 1986). As
these owners are extremely diffuse, the free rider problem become even more severe than that of joint
stock companies, which potentially lead to the inefficiency of SOEs. However, SOEs have the
advantage of receiving “helping hand” from the governments (Shleifer & Vishny, 2002), possibly in forms
of financial resources, business networks or economic contracts with government agencies. As a result,
the decrease of state ownership could negatively affect firm performance.
This study contributes to the literature in three ways. First, while most theories and empirical evidence
on the effect of ownership structure (particularly ownership concentration) on firm performance are
based on the well-developed economies of the U.S. and Europe, there is lack of research focusing on
emerging countries. To the best of our knowledge, this is the first paper considering the impact of
managerial ownership and block ownership on firm performance in the Vietnamese stock market.
Second, the relationship between state ownership on firm performance in the context of Vietnam, which
was found to be negative by Tran, Nonneman, and Jorissen (2014) and inverted U-shaped by Phung
and Hoang (2013), is reexamined using an updated dataset and a more advanced method. Third,
instead of traditionals use of OLS, fixed effects or instrumental variables, this study employs the welldeveloped system GMM estimator to address the endogeneity of ownership structure, as well as the
dynamic nature of the relationship between ownership structure and firm performance.
2
2.1
Literature Review
Brief review of related literature
Regarding to the impact of ownership structure on firm performance, not only are there conflicts in
theoretical perspectives but empirical results are also inconclusive. In the U.S. market, most current
3
Electronic copy available at: />
studies found the insignificant relationship between block ownership and firm performance, but the
conclusion in case of managerial ownership is mixed. The early study could be traced back to Demsetz
and Lehn (1985). On the sample of 511 firms in the U.S. from 1976 to 1980, they did not find a significant
relationship between block ownership and accounting profit rate. McConnell and Servaes (1990) on
one hand confirmed Demsetz and Lehn’s result, on the other hand found an inverted U-shaped
relationship between managerial ownership and Tobin’s Q using piecewise OLS. Applying 2SLS to
control for endogeneity, Demsetz and Villalonga (2001) reported neither impact of managerial
ownership nor block ownership on Tobin’s Q. The insignificant relationship between managerial
ownership and firm performance was also documented in Cho (1998) and Loderer and Martin (1997).
In contrast, Chung and Pruitt (1996) and Palia and Lichtenberg (1999) reported the positive impact of
managerial ownership on Tobin’s Q and Total Factor Productivity using 2SLS and piecewise OLS
respectively. Meanwhile, non-monotonic relationship between managerial ownership and Tobin’s Q is
also found in Morck, Shleifer, and Vishny (1988), Holderness, Kroszner, and Sheehan (1999) (cubic),
Himmelberg, Hubbard, and Palia (1999) (inverted U-shaped) or Hermalin and Weisbach (1991)
(inverted W-shaped).
The empirical evidence on the relationship between ownership concentration and firm performance is
even more inconclusive in countries outside the U.S. The insignificant relationship was reported in
Welch (2003) in Australia and Sheu and Yang (2005) in Taiwan. Shah and Hussain (2012) also
confirmed no impact of block ownership on Tobin’s Q, but the negative impact of managerial ownership
was found. On the contrary, positive impact of managerial ownership on firm performance was
documented in Kapopoulos and Lazaretou (2007) in Greek, Li, Moshirian, Nguyen, and Tan (2007) and
Liu, Uchida, and Yang (2012) in China, Fauzi and Locke (2012) in New Zealand. Using IV-GMM and
panel data analysis respectively, De Miguel, Pindado, and De la Torre (2004) and Short and Keasey
(1999) discovered the cubic relationship between managerial ownership and firm performance in Spain
and the UK. However, the turning points are significantly different, i.e. 35% and 70% in case of Spain,
and 15% and 42% in the UK.
In contrast to the U.S., the relationship between block ownership and firm performance was found to
be significant in many other countries but its signs were mixed. The inverted U-shaped relationship was
4
reported in numbers of European countries (Balsmeier & Czarnitzki, 2015; De Miguel et al., 2004;
Thomsen & Pedersen, 2000), meanwhile the U-shaped relationship was found in China by Liu et al.
(2012) on the sample of 970 listed firms during crisis period of 2007-2008. However, using a smaller
sample of 149 Chinese listed manufacturing firms in 1999-2002, Jiang, Yue, and Zhao (2009)
discovered the negative relationship, which is confirmed by Balsmeier and Czarnitzki (2015) in New
Zealand. On the other hand, the positive impact of block ownership on firm performance was also
documented by Gedajlovic and Shapiro (2002) in Japan and Kapopoulos and Lazaretou (2007) in
Greek.
Regarding to state ownership, there is mounting evidence of its impact on firm performance. Villalonga
(2000) provided a metareview on existing empirical research comparing performance of firms with
various level of state ownership. Among 153 studies reviewed, 104 support the higher efficiency of
private ownership, 14 against and 35 neutral. In addition, there are some studies finding a nonmonotonic relationship. For example, in the review of Yu (2013) of empirical studies in China, 6 out of
14 studies reported the U-shaped relationship, meanwhile other 4 negative, 1 positive, 1 inverted Ushaped and 2 neutral. In the context of Vietnam, Loc, Lanjouw, and Lensink (2006) compared the
performance of SOEs in pre- and post-privatization period, using difference in difference (DID) method
to avoid selection bias. They concluded that the observed improvement in profitability, sale revenue,
efficiency, and employee income is truly resulted from privatization. The result implies the negative
impact of state ownership on firm performance. Similarly, in a cross sectional comparison of more than
2,000 firms during 2004-2012, Tran et al. (2014) discovered the negative impact of state ownership on
firms’ profitability (ROA) and labor productivity (value added per employee). Meanwhile, Phung and
Hoang (2013) found that the state ownership has an inverted U-shaped impact on Tobin’s Q and ROA
in a sample of listed companies on the HOSE and HNX (Hanoi Stock Exchange) from 2007 to 2012.
2.2
Corporate Governance Structure in Vietnam
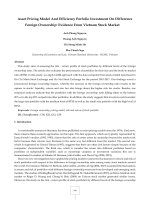
Generally, listed companies in Vietnam follow two-tier corporate governance system, although there
are some modifications making it slightly different with the typical two-tier structure of Germany. The
basic structure is visualized in Figure 1. General Meeting of Shareholders (GMS) has the power of
making decision on the most important issues of the company such as long-term strategies, stock issue
5
and dividend. According to the Vietnamese Enterprise Law 2014, GMS must be held at least once per
year, within four months after the end of financial year. Board of Directors (BOD) acts as an agent of
GMS and has full authority to make decisions in the name of the company, especially strategical
decisions that strongly affect the interest of shareholders. The BOD has the right to appoint Executive
Board, which is in charge of daily operations. Supervisory Board is elected by the GMS and independent
from both BOD and Executive Board, with the main duty of supervising these Boards in managing and
operating the company. While members of Executive Board could be selected from BOD, as the
regulation, members of Supervisory Board must not hold any position in both BOD and Executive Board,
or be relatives of any member in those Boards.
Figure 1. Corporate Governance Structure in Vietnam2
General Meeting of
Shareholders (GMS)
Chairperson
of BOD
Board of Directors
(BOD)
Supervisory
Board
Executive
Board
Appointment and Removal;
Supervision
Theoretically, the independence of BOD, Supervisory Board and Executive Board allow them to
cooperate with, as well as supervise each other in managing and operating the company. However,
from the principal-agent relationship perspective, all of them share the role of shareholders’
representatives who act on behalf of shareholders to operate the firm. Thus, their incentive and interest
is likely to be similar in terms of exploiting outside shareholders. Therefore, in the examination of the
relationship between managerial ownership and firm performance, we consider all three Boards as one
unified management team, thus managerial ownership is computed as the total shares owned by all
members in these Boards.
2
As a unique two-tier corporate governance system in Vietnam, Board names are translated differently in
different documents, which sometimes conflicts and make confused. This study uses the translation system of
Nguyen, Locke & Reddy (2015) to ensure consistency.
6
3
3.1
Research Design
Sample
Our sample includes manufacturing companies listed on the HOSE during 2007-2015. Data is handcollected from companies’ annual reports, corporate governance reports and financial statements.
However, as ownership structure release is optional, data is unavailable in some companies, especially
at the beginning of the research period. On the other hand, according to Vietnamese national listing
rules, all top managers (including BOD, Supervisory Board, Executive Board and the Chief Accountant)
must commit to hold 100% of their shares at least 6 months after listing day, and 50% during subsequent
6 months. Therefore, firms listed in year t are included into the sample from year t+2 in order to allow
sufficient time for adjustments of managerial ownership and its potential effects on firm performance to
take place. Based on this restriction and the availability of information, an unbalanced data of 76 out of
95 manufacturing listed companies in HOSE has been constructed, with 406 firm-year observations.
Beta coefficient (β) is estimated by regressing weekly excess stock returns on weekly excess VN-Index
returns of two recent years. Risk free rate is weekly interbank offered rate obtained from Datastream.
Returns are restricted within two years allows to incorporate only recent information of firm risk, which
could possibly be disturbed by out-of-date information of further returns. On the other hand, extreme
high fixed assets growth rate (i.e. greater than 1) which could potential source of noise in the analysis
is excluded from the sample.
3.2
Empirical models
We construct three separated models (1), (2) and (3) to examine the impacts of managerial ownership,
block ownership and state ownership to firm performance respectively. Average Tobin’s Q (AvQ) is
utilized as the proxy of firm performance. Since failing to incorporate dynamic relation between
dependent and independent variables could lead to the dynamic panel bias problem (Bond, 2002), the
first lag of AvQ (AvQit-1) is included into the right-hand-side variables. In addition, the quadratic and
cubic terms of ownership structure are employed to examine the commonly observed non-monotonic
relationship. The set of control variables in all three models are firm characteristics that possibly affect
firm performance, including Size, Lev, FixAGrR, Beta, Age and year dummies. The definition of
variables is provided in Table 1.
7
𝑘
𝐴𝑣𝑄𝑖𝑡 = 𝛼 + 𝜃𝐴𝑣𝑄𝑖𝑡−1 + 𝛽1 𝑀𝑂𝑖𝑡 + 𝛽3 𝑀𝑂𝑖𝑡2 + 𝛽3 𝑀𝑂𝑖𝑡3 + ∑𝑘 𝛿𝑘 𝐶𝑜𝑛𝑡𝑟𝑜𝑙𝑖𝑡
+ 𝜂𝑖 + 𝜀𝑖𝑡
(1)
𝐴𝑣𝑄𝑖𝑡 = 𝛼 + 𝜃𝐴𝑣𝑄𝑖𝑡−1 + 𝛽1 𝐵𝑂𝑖𝑡 + 𝛽2 𝐵𝑂𝑖𝑡2 + 𝛽3 𝑁𝑜𝐵𝑂 + 𝛽4 𝐿𝑂𝐶ℎ𝑎𝑛𝑔𝑒 + 𝛽5 𝐶𝑡𝑟𝑙𝐷𝑢𝑚 +
𝑘
+ ∑𝑘 𝛿𝑘 𝐶𝑜𝑛𝑡𝑟𝑜𝑙𝑖𝑡
+ 𝜂𝑖 + 𝜀𝑖𝑡
(2)
𝑘
𝐴𝑣𝑄𝑖𝑡 = 𝛼 + 𝜃𝐴𝑣𝑄𝑖𝑡−1 + 𝛽1 𝑆𝑂𝑖𝑡 + 𝛽2 𝑆𝑂𝑖𝑡2 + 𝛽3 𝑆𝑂𝑖𝑡3 + ∑𝑘 𝛿𝑘 𝐶𝑜𝑛𝑡𝑟𝑜𝑙𝑖𝑡
+ 𝜂𝑖 + 𝜀𝑖𝑡
(3)
Because blockholders could play an important role in corporate governance through supervising
managers, and managers in many cases are blockholders simultaneously, there could be interactions
between block ownership and managerial ownership in corporate governance. We take into
consideration the issue by examining the impact of managerial ownership and block ownership on
Tobin’s Q in a unified model (4).
𝐴𝑣𝑄𝑖𝑡 = 𝛼 + 𝜃𝐴𝑣𝑄𝑖𝑡−1 + 𝛽1 𝑀𝑂𝑖𝑡 + 𝛽3 𝑀𝑂𝑖𝑡2 + 𝛽3 𝑀𝑂𝑖𝑡3 + 𝛽4 𝐵𝑂𝑖𝑡 + 𝛽5 𝐵𝑂𝑖𝑡2 + 𝛽6 𝑁𝑜𝐵𝑂 + 𝛽7 𝐿𝑂𝐶ℎ𝑎𝑛𝑔𝑒 +
𝑘
𝛽8 𝐶𝑡𝑟𝑙𝐷𝑢𝑚 + + ∑𝑘 𝛿𝑘 𝐶𝑜𝑛𝑡𝑟𝑜𝑙𝑖𝑡
+ 𝜂𝑖 + 𝜀𝑖𝑡
(4)
Table 1. Variable Definition
Variables
Acronyms
Definition
Average
Tobin’s Q
AvQ
Average of Tobin’s Q at the beginning and the end of the year.
Tobin’s Q is computed as market value of equity plus book value
of debt, all divided by book value of total assets.
Managerial
ownership
MO
Total fraction of shares owned by Board of Directors, Supervisory
Board and Executive Board
State
ownership
SO
Total fraction of shares owned by central government, local
government, the SCIC and other SOEs
Block
ownership
BO
Total fraction of shares owned by blockholders, i.e. who own ≥
5% of total shares. If company does not have any blockholders,
BO is 0.
Number of
blockholders
NoBO
Number of shareholders who own at least 5% of total shares
The largest
shareholder
change
LOChange
LOChanget = 1 if the largest shareholder is changed in year t, 0
otherwise.
Dummy for
controlling
shareholders
CtrlDum
CtrlDumt = 1 if there is a controlling shareholder in the company,
i.e. the shareholder own ≥ 50% total shares) in year t, 0 otherwise
Firm size
Size
Average of total assets at the beginning and the end of the year
Leverage
Lev
Ratio of total debt to total assets
Growth
Opportunity
FixAGrR
Fixed assets growth rate
Market risk
Beta
Beta coefficient obtained from the CAPM-type regression of
weekly stock returns on market returns. Market returns is proxied
by the percentage change of VN-Index
8
Firm Age
Age
Numbers of year the firm has been listed on HOSE
Year dummies
D2007-D2015
Nine year dummies for years from 2007 to 2011
3.3
Methodology
It is widely accepted that there are at least two sources of endogenous ownership structure, including
simultaneity and unobserved heterogeneity. Numbers of technique have been developed to control for
the problem, such as fixed effects and instrumental variables (IV). While fixed effects estimator could
only control for unobserved time-invariants, IV strictly requires external strong instrumental variables,
which are normally very hard to find in practice (Himmelberg et al., 1999). Thus, instead of using these
traditional methods, this study utilizes the system dynamic generalized method of moments (systemGMM) estimator. This method was initially introduced by Holtz-Eakin, Newey, and Rosen (1988) and
Arellano and Bond (1991), and further developed by Arellano and Bover (1995) and Blundell and Bond
(1998). System-GMM on one hand is able to account for unobserved heterogeneity through a system
of first-differenced and level equations, on the other hand can exploit the use of internally generated
instrumental variables. Therefore, it can overcome the drawbacks of the IV estimator.
Except for firm age and year dummies, which are obviously strictly exogenous, following Wintoki, Linck,
and Netter (2012) we treat all other variables as endogenous. As the first lag of the dependent variable
is included in the dynamic models, lags of two periods or more could be used as instruments for
endogenous variables in the system-GMM. Specifically, similar to De Miguel et al. (2004), we use lags
2 to 4 of level variables as instruments for the first differenced equation, and lag 1 of differenced
variables for the level equation. The choice between one-step and two-step GMM should also be
considered. Although two-step is asymptotically more efficient, it tend to sufferer more severely from
the downward bias of standard errors (Arellano & Bond, 1991; Blundell & Bond, 1998). Fortunately, this
bias could be corrected by the process developed by Windmeijer (2005) that makes two-step robust
become more popular recently. Because of these reasons, we employ the two-step robust system GMM
estimator in our analysis3.
4
Data Analysis
We use “xtabond2” package written by Roodman (2009) to run two-step system-GMM in Stata. The
collapse option is chosen to limit the number of instruments.
3
9
4.1
Descriptive Statistics
Table 2 shows the correlation matrix and overall descriptive statistics of variables. Firm size (Size) measured by average total assets - varies significantly among companies, ranging from 76 to 26,624
billion VND. The same trend is observed in fixed assets growth rate (FixAGrR). While its mean is
negligible at 5%, the standard deviation is five times larger. Interestingly, beta is relatively small with
the mean of 0.25 and all values are smaller than 1.00, reflecting low market risk of the manufacturing
sector.
Table 2. Correlation Matrix and Descriptive Statistics
(1)
(2)
(3)
(4)
(5)
(6)
(7)
(8)
(9)
(10)
(11)
(12)
AvQ (1)
1
MO (2)
-0.25
BO (3)
0.06
0.09
1
SO (4)
0.29
-0.51
0.24
1
NoBO (5)
-0.07
0.42
0.17
-0.34
1
LOChange (6)
-0.09
0.01
-0.24
-0.25
0.09
1
CtrlDum (7)
-0.04
-0.09
0.47
0.34
-0.30
-0.13
1
Size (8)
0.41
0.02
0.05
0.11
-0.07
-0.11
-0.03
1
Lev (9)
-0.29
0.15
0.09
-0.04
-0.03
0.03
0.24
0.02
1
FixAGrR (10)
0.19
-0.01
0.02
0.07
0.12
-0.04
-0.10
0.10
0.07
Beta (11)
0.38
-0.21
-0.23
0.15
-0.10
0.11
-0.06
0.28
-0.22
0.13
1
Age (12)
0.01
-0.25
0.16
0.01
0.01
-0.07
0.06
0.09
-0.11
-0.06
-0.22
1
Min
0.45
0.00
0.00
0.00
0.00
0.00
0.00
76
0.09
-0.96
-0.09
2.00
Max
4.88
0.66
0.89
0.84
8.00
1.00
1.00
26,624
0.94
0.99
0.86
15.00
Mean
1.15
0.15
0.54
0.20
2.54
0.12
0.39
2,271
0.49
0.05
0.27
5.28
Std. Dev.
0.58
0.18
0.17
0.24
1.44
0.32
0.49
3,819
0.20
0.25
0.18
2.49
Obs.
406
406
405
406
380
313
406
406
406
384
401
404
1
1
Size is measured in billion VND
On the other hand, equity ownership is very concentrated with the average of block ownership and
managerial ownership are 15% and 54% respectively. However, managerial ownership varies much
more than block ownership, reflecting the fact that managers could be either blockholders or minority
shareholders. Although average state ownership is at moderate level of 20%, it varies significantly
among companies (ranging from 0% to 84 percent, with standard deviation of 0.24). In respect to firm
performance, the value of 1.15 of Tobin’s Q indicates the manufacturing stocks are slightly overvalued
during the research period.
10
More details of block ownership is presented in Table 3. Blockholders are defined as shareholders who
owns ≥ 5% of total shares. The fraction of shares owned by the first, the second and the third
blockholder is fairly stable overtime in terms of all mean, median and standard deviation. On average,
the largest shareholder owns around 40% of total shares. While shares owned by the 2 nd and the 3rd
blockholders are relatively similar, the gap between the largest ownership and the second is
considerable, i.e. nearly three times higher. In addition, the average number of blockholders is around
2.5 for all years, indicating that ownership of manufacturing companies on the HOSE is extremely
concentrated, and the majority of shares is on hand of very few shareholders.
Table 3. Breakdown of block ownership
Mean (median) [standard deviation]
2007
2008
2009
Block
ownership
2010
2011
2012
2013
2014
2015
Pool
0.43
0.46
0.48
0.47
0.51
0.55
0.57
0.55
0.56
0.54
(0.35)
[0.26]
(0.44)
[0.21]
(0.50)
[0.16]
(0.46)
[0.16]
(0.51)
[0.15]
(0.55)
[0.14]
(0.56)
[0.15]
(0.56)
[0.19]
(0.57)
[0.19]
(0.55)
[0.17]
0.21
0.34
0.35
0.35
0.36
0.39
0.40
0.40
0.42
0.38
The largest
ownership
(0.09)
[0.26]
(0.42)
[0.19]
(0.39)
[0.17]
(0.38)
[0.17]
(0.38)
[0.16]
(0.40)
[0.16]
(0.43)
[0.16]
(0.43)
[0.19]
(0.45)
[0.19]
(0.40)
[0.18]
The 2nd
largest
ownership
0.10
0.12
0.11
0.10
0.12
0.13
0.14
0.13
0.14
0.13
(0.07)
[0.07]
(0.10)
[0.08]
(0.10)
[0.05]
(0.09)
[0.04]
(0.11)
[0.06]
(0.12)
[0.06]
(0.14)
[0.07]
(0.11)
[0.07]
(0.11)
[0.08]
(0.11)
[0.07]
0.06
0.07
0.07
0.08
0.09
0.09
0.09
0.10
0.09
0.09
(0.06)
0.01
(0.07)
0.01
(0.07)
0.02
(0.08)
0.03
(0.09)
0.02
(0.08)
0.03
(0.09)
0.03
(0.08)
0.04
(0.08)
0.03
(0.08)
0.03
4.00
2.17
2.38
2.41
2.48
2.68
2.70
2.55
2.39
2.54
(3.5)
(2)
(2)
(2)
(2)
(3)
(3)
(2)
(2)
(2)
[2.16]
[1.03]
[1.30]
[1.05]
[1.38]
[1.47]
[1.53]
[1.53]
[1.50]
[1.44]
The 3rd
largest
ownership
Numbers of
blockholders
Managerial ownership is further broken down into BOD, Supervisory Board and Executive Board
ownership, which is showed in Table 4. All three components of managerial ownership only vary slightly
during the research period. This very stability could be attributable to the preservation or reappointment
of manager positions – the situation usually being observed in the inactive managerial labor market of
an emerging country as Vietnam.
Table 4. Breakdown of managerial ownership
Mean (median) [standard deviation]
11
Managerial
ownership
2007
2008
2009
2010
2011
2012
2013
2014
2015
All
0.08
0.04
0.11
0.14
0.17
0.17
0.16
0.13
0.14
0.15
(0.09)
[0.05]
(0.02)
[0.03]
(0.02)
[0.17]
(0.04)
[0.18]
(0.05)
[0.20]
(0.07)
[0.19]
(0.07)
[0.18]
(0.04)
[0.17]
(0.05)
[0.18]
(0.04)
[0.18]
Board of
Directors
ownership
0.08
0.03
0.11
0.14
0.16
0.16
0.15
0.13
0.14
0.14
(0.09)
[0.05]
(0.01)
[0.03]
(0.02)
[0.17]
(0.03)
[0.18]
(0.05)
[0.19]
(0.06)
[0.19]
(0.05)
[0.18]
(0.04)
[0.17]
(0.04)
[0.17]
(0.04)
[0.17]
Supervisory
Board
ownership
0.08
0.14
0.21
0.16
0.18
0.23
0.20
0.19
0.22
0.20
(0.03)
[0.13]
(0.15)
[0.12]
(0.09)
[0.40]
(0.09)
[0.26]
(0.09)
[0.29]
(0.08)
[0.69]
(0.05)
[0.63]
(0.05)
[0.54]
(0.02)
[0.70]
(0.06)
[0.56]
0.04
0.02
0.06
0.08
0.10
0.10
0.08
0.08
0.08
0.08
(0.02)
[0.06]
(0.01)
[0.03]
(0.01)
[0.13]
(0.02)
[0.13]
(0.02)
[0.15]
(0.02)
[0.15]
(0.02)
[0.13]
0.02
[0.13]
(0.02)
[0.13]
(0.02)
[0.13]
0.05
0.43
0.29
0.27
0.29
0.72
0.53
0.33
0.39
0.43
(0.04)
(0.12)
(0.03)
(0.07)
(0.12)
(0.10)
(0.09)
(0.06)
(0.06)
(0.07)
[0.06]
[0.64]
[0.69]
[0.52]
[0.53]
[2.93]
[1.93]
[0.79]
[0.93]
[1.58]
Executive
Board
ownership
Pure
manager’s
ownership
Values of Supervisory Board Ownership, Pure Top Manager’s Ownership are multiplied by 102.
We also compute the ownership of “pure” executive managers (i.e. Executive Board members who are
not in BOD) by subtracting Supervisory Board and BOD ownership from managerial ownership. The
results in Table 4 indicate that shares owned by “pure” executive managers is very small (about 0.3%
– 0.7%), which implies significantly high level of duality in corporate governance structure in Vietnam:
most executive managers are members of BOD. On the other hand, in contrast to BOD ownership,
Supervisory Board ownership is negligible with the mean of around 0.2%. Although theoretically, the
independence of Supervisory Board allows higher efficiency in supervising activities of other Boards,
the extremely inferior ownership could practically lower its voice in the management team where other
members hold powerful dual positions in BOD and Executive Boards. In addition, low ownership could
also trigger the severe agency problem. Consequently, roles of Supervisory Board in corporate
governance in the context of Vietnam could be negligible.
4.2
4.2.1
Empirical Results
Testing for endogeneity of regressors, heteroskedasticity and autocorrelation
Given the endogeneity of regressors, estimations from OLS and fixed-effect are biased while GMM is
superior in terms of consistency (Schultz, Tan, & Walsh, 2010). As a result, it is crucial to test for the
endogeneity of independent variables in their relations with firm performance. Following Nguyen, Locke,
12
and Reddy (2014), we conduct the Durbin-Wu-Hausman (DWH) test based on the constructed models.
All regressors excluding year dummies and firm age are treated as endogenous variables with
instrumental variables are their one-year lagged differences. The results are presented in Table 5.
Generally, the null hypothesis that endogenous variables can be treated as exogenous is rejected in all
four models at the significant level of 5% or 10%, supporting the presence of endogeneity of ownership
structure and other independent variables in our sample.
On the other hand, Wooldridge (2001) stated that if data presents either heteroskedasticity or
autocorrelation, GMM estimators can be more efficient than fixed-effects. Therefore, the BreuschPagan test for heteroskedasticity and the procedure developed by Wooldridge (2002, pp. 282-283) to
test for autocorrelation in panel data are conducted. These tests follow Chi-squared and F distribution
with null hypotheses of constant variance and no autocorrelation respectively. The results in Table 5
show strong evidence for the existence of both heteroskedasticity and serial correlation, with all test
statistics are significant at 1%. Since the evidence strongly support the use of GMM, we will mainly
focus on its results in next Sections.
Table 5. Diagnostic tests
Model
(1)
(2)
(3)
(4)
Durbin-Wu-Hausman test, null hypothesis: regressors as a group are exogenous
Chi-squared
p-value
χ2(8) = 16.76
χ2(10) = 18.25
χ2(8) = 14.61
χ2(13) = 22.84
0.0330
0.05083
0.06718
0.04359
Breusch-Pagan test, null hypothesis: homoscedasticity
Chi-squared
p-value
χ2(16) = 377.12
χ2(18) = 378.21
χ2(16) = 352.27
χ2(21) = 367.8
0.0000
0.0000
0.0000
0.0000
Wooldridge test, null hypothesis: no autocorrelation
F statistic
p-value
4.2.2
F(1, 59) = 96.485
F(1, 56) = 80.946
F(1, 59) = 86.835
F(1, 56) = 89.983
0.0000
0.0000
0.0000
0.0000
Ownership concentration and firm performance
Table 6 reports the results of model (1) using OLS, fixed effects and system-GMM estimator, as well as
specification tests of the GMM. Since p-value of AR(2) is 0.223, the null hypothesis of no second-order
serial correlation of residuals in difference cannot be rejected. This evidence supports the use of lags
from two periods as instruments for endogenous variables as suggested by Roodman (2009). On the
other hand, Hansen test of over-identification reveals the J-statistics of 24.63 with corresponding p13
value of 0.315. Therefore, we cannot reject the validity of our instruments. Furthermore, difference-inHansen test also fails to reject the exogeneity of instrument subsets, i.e. GMM instrument for levels and
IV-style instruments. The number of instruments is kept to be well smaller than the number of groups
(41 against 76) as recommended by Roodman (2009) to avoid possible consequences of too many
instruments. In summary, all these diagnostic results support the validity of GMM in our model.
Table 6. The effect of managerial ownership on firm performance
AvQit-1
MO
MO2
MO3
Size
Lev
FixAGrR
Beta
Age
R2
AR(1) (p-value)
AR(2) (p-value)
Number of instruments
OLS
0.9213 (35.91)*
0.8569 (1.68)*
-4.4830 (-1.90)*
5.2157 (1.89)*
0.0113 (3.32)***
-0.0508 (-0.89)
0.0544 (1.27)
-0.1213 (-1.11)
0.0107 (1.99)**
90.14%
Fixed Effects
0.4662 (8.86)***
0.5433 (0.49)
-3.2653 (-0.69)
5.2872 (0.96)
0.0583 (6.9)***
-0.2005 (-1.44)
0.1140 (2.49)**
-0.1597 (-1.18)
0.0188 (1.09)
73.34%
Hansen test
Difference-in-Hansen tests (p-value)
- GMM instruments for levels
- IV
System GMM
0.9430 (5.30)***
4.6452 (1.95)*
-23.3558 (-1.93)*
27.2801 (1.85)*
0.0180 (0.65)
-0.3108 (-0.85)
-0.3381 (-2.2)**
0.2108 (0.77)
-0.0039 (-0.37)
0.029**
0.223
41
𝜒 2 (22) = 24.63
Prob > 𝜒 2 = 0.315
0.314
0.692
*** 1%, ** 5%, * 10%. Year dummies and constant are included but unreported.
In all estimates, regression coefficients of AvQit-1 is significant at 1% level, indicating strong impact of
past performance on current performance. It implies the robust of the dynamic against the static model.
On the other hand, results from OLS show the cubic relationship between managerial ownership and
firm performance, i.e. 𝛽1 and 𝛽3 are positively, while 𝛽2 is negatively significant at 10%. In GMM, sign
and significance level of 𝛽1 , 𝛽2 and 𝛽3 are unchanged, however there are slightly improvements in tstatistics. This evidence supports both convergence-of-interest and entrenchment hypothesis, which is
consistent with the findings of Morck et al. (1988) in the U.S., Short and Keasey (1999) in the UK and
De Miguel et al. (2004) in Spain. Based on estimated coefficients, by taking partial derivative of Model
(1) with respect to MO, we can calculate two turning points of the cubic relationship: 𝑀𝑂1 ⁄𝑀𝑂2 =
(−2𝛽2 ± √4𝛽22 − 12𝛽1 𝛽3 )⁄6𝛽3 . Results from both OLS and GMM estimates show the turning points of
12% and 45%. If managerial ownership ranges from 0% to 12% or larger than 45%, convergence-ofinterest effect is dominant, and any increase of insider ownership will translate into higher incentives of
14
mangers in managing companies more effectively. Meanwhile, when managerial ownership is between
12% and 45%, higher ownership leads to lower firm value as entrenchment effect become superior.
Interestingly, managers in manufacturing companies on the HOSE get entrenched at similar level of
ownership with that of UK companies, which witnesses the turning points of 15% and 42% (Short &
Keasey, 1999). Obviously it is naive to jump to the conclusion that the corporate governance
effectiveness in Vietnam and the UK are similar, we propose that while there are some typical conditions
in Vietnam reducing the level of ownership at which managers get entrenched, there are others favoring
it. On one hand, considerable high level of ownership concentration with powerful influence is on hand
of only few blockholders allows them to remove manager positions easily, thus if managers want to
protect their positions, they must acquire high level of ownership. Another possible favoring condition
is that in Vietnam, the GMS are usually prefer to appoint large shareholders to be managers, especially
BOD members. On the other hand, inactive managerial labor market is a barrier for GMS to remove
and appoint managers, which lower the required level of managerial ownership for entrenchment. In
addition, inefficient monitoring from outside shareholders could be another hindering condition as it
allows managers to have more freedom to act on their own interests without holding significant shares.
The estimates of model (2) are reported in Table 7. All specification tests of system-GMM results in
insignificant statistics, indicating that we cannot reject the null hypothesis of the model validity.
Table 7. The effect of block ownership on firm performance
AvQit-1
BO
BO2
NoBO
LOChange
CtrlDum
Size
Lev
FixAGrR
Beta
Age
R2
AR(1) (p-value)
AR(2) (p-value)
Number of instruments
Hansen test
OLS
0.9218 (35.56)***
0.0328 (0.11)
-0.0471 (-0.18)
0.0017 (0.17)
0.0200 (0.2)
0.0080 (0.26)
0.0093 (2.8)***
-0.0846 (-1.36)
0.0689 (1.52)
-0.0710 (-0.64)
0.0093 (1.82)*
90.78%
Fixed Effects
0.4698 (9.01)***
-0.4956 (-1.24)
0.6979 (1.85)*
0.0188 (1.03)
-0.0003 (-0.01)
0.0743 (1.08)
0.0616 (7.44)***
-0.2285 (-1.63)
0.1313 (2.9)***
-0.0453 (-0.32)
-0.0169 (-0.9)
73.07%
System GMM
0.7779 (4.56)***
0.0806 (0.10)
-0.1481 (-0.20)
0.0132 (0.24)
-0.0003 (0.00)
0.0528 (0.42)
0.0254 (0.75)
-0.2038 (-0.69)
-0.1001 (-0.69)
0.1243 (0.44)
0.0072 (0.70)
0.166
0.152
49
𝜒 2 (28) = 35.6
Prob > 𝜒 2 = 0.153
15
Difference-in-Hansen tests (p-value)
- GMM instruments for levels
- IV
0.654
0.748
*** 1%, ** 5%, * 10%. Year dummies and constant are included but unreported.
The impact of past performance on current performance is very significant at 1% level, although the
magnitude of effect in GMM estimates slightly decreases comparing to the results from model (1) (0.78
vs. 0.94). The positive 𝛽1 and negative 𝛽2 are explored in both OLS and GMM, indicating that block
ownership positively impact firm performance at low level (monitoring effect), and negatively at higher
level (expropriation effect). However, very small corresponding t-statistics of 0.1 and -0.2 do not allow
us to reject the null hypothesis of zero coefficients. Thus, from the model we do not find supporting
evidence for the relationship between percentage of shares owned by blockholders and Tobin’s Q.
Similarly, coefficients of other firm characteristics relating to block ownership, including NoBO,
LOChange and CtrlDum are insignificant in terms of both magnitude and t-statistics. These results do
not change if we control for managerial ownership in model (4) as can be seen in Table 8. However,
the effect of managerial ownership persist, and interestingly the turning points are still similar to model
(1) at around 12% and 45% respectively.
Table 8. The effect of block ownership and managerial ownership on firm performance
AvQit-1
MO
MO2
MO3
BO
BO2
NoBO
LOChange
CtrlDum
Size
Lev
FixAGrR
Beta
Age
R2
AR(1) (p-value)
AR(2) (p-value)
Number of instruments
OLS
0.9186 (33.4)***
0.9978 (1.76)*
-5.4581 (-2.16)**
6.4254 (2.19)**
0.0619 (0.22)
-0.0638 (-0.23)
0.0076 (0.76)
0.0026 (0.07)
0.0057 (0.19)
0.0120 (3.37)***
-0.0749 (-1.22)
0.0567 (1.25)
-0.1257 (-1.07)
0.0077 (1.34)
90.99%
Fixed Effects
0.4714 (8.99)***
0.5057 (0.39)
-2.0028 (-0.39)
3.1586 (0.54)
-0.6932 (-1.39)
0.8566 (1.88)*
0.0191 (1.02)
0.0065 (0.17)
0.0459 (0.61)
0.0609 (0.31)
-0.2426 (-1.72)*
0.1243 (2.67)***
-0.0590 (-0.41)
-0.0143 (-0.76)
70.07%
Hansen test
Difference-in-Hansen tests (p-value)
- GMM instruments for levels
- IV
System GMM
0.8618 (5.42)***
3.1031 (2.09)**
-17.1888 (-2.27)**
20.8641 (2.17)**
0.5375 (0.82)
-0.5321 (-0.92)
-0.0107 (-0.24)
0.0077 (0.10)
-0.0309 (-0.28)
0.0213 (0.93)
-0.2430 (-0.91)
-0.1717 (-1.29)
-0.0777 (-0.23)
-0.0024 (-0.31)
0.097
0.190
61
𝜒 2 (37) = 37.17
Prob > 𝜒 2 = 0.461
0.465
0.966
*** 1%, ** 5%, * 10%. Year dummies and constant are included but unreported.
16
The results indicate that controlling for possible impact of blockholders on managers does not affect the
relationship between insider ownership and firm performance, implying a trivial role of blockholders in
corporate governance. We propose that high level of information asymmetry, weak legal protection of
outside shareholders against insiders, and inactive managerial labor market which are usually observed
in an emerging economy like Vietnam could be explanations for this issue. These circumstances could
strongly prevent the efficiency of monitoring activities as it could be harder to gather insider information
as well as appoint or remove managers from their positions, thus offset positive effects concentrated
block ownership. Compounding the issue, in our sample, large number of blockholders are institutions
(both private and state) that take part in corporate governance through their representatives in BOD.
However, it is likely that these agents will take advantage of their powerful positions in the management
team to exploit the principals for private interests rather than benefit them. It also weaken monitoring
mechanisms of blockholders.
4.2.3
State ownership and firm performance
Results of model (3) are presented in Table 9. Similar to model (1), (2) and (4), the coefficient of AvQit1
is positive and very significant in all three estimates at 1% level, supporting the validity of the dynamic
model. The coefficients of state ownership as well as its square and cube have the same sign in all
three estimates, i.e. positive 𝛽1 and 𝛽3 , negative 𝛽2 . After controlling for endogeneity, all three
coefficients become significant mostly at 5% level. These results indicate the cubic relationship between
state ownership and firm performance. However, the puzzle is that if the positive relation exists at very
high level of state ownership, why the Vietnamese government (as well as most other transition
economies) has strongly encouraged privatization during recent years. Digging deeper into the result,
the partial derivative shows the second turning point of around 76% in both fixed effects and systemGMM. However in our sample, there are only 10 observations of 3 companies reach this level. The
small number implies that these companies could be outliners and possibly are not good
representatives for companies with extremely high level of state ownership. When we exclude these 10
observations and re-estimate the model (3), the results show that only inverted-U shaped relationship
17
is significant4. Thus, the evidence of positive relationship at very high level of state ownership seems
to be weak.
Table 9. The effect of state ownership on firm performance
AvQit-1
SO
SO2
SO3
Size
Lev
FixAGrR
Beta
Age
R2
AR(1) (p-value)
AR(2) (p-value)
Number of instruments
OLS
0.8856 (31.44)***
0.5187 (1.50)
-0.8990 (-0.73)
0.1070 (0.10)
0.0132 (3.74)***
-0.0620 (-1.10)
0.0633 (1.46)
-0.0790 (-0.74)
0.0079 (1.49)
90.27%
Fixed Effects
0.4735 (9.11)***
2.1246 (1.80)*
-11.2325 (-2.19)**
8.6420 (2.12)**
0.0562 (6.63)***
-0.1286 (-0.91)
0.1136 (2.55)**
-0.1588 (-1.18)
0.0190 (1.1)
62.65%
Hansen test
Difference-in-Hansen tests (p-value)
- GMM instruments for levels
- IV
System GMM
0.8114 (4.62)***
4.8685 (2.40)**
-14.4600 (-2.8)***
9.8967 (2.58)**
0.0337 (1.78)*
-0.5424 (-1.42)
-0.3509 (-1.32)
0.2781 (1.41)
-0.0260 (-1.39)
0.038
0.124
41
𝜒 2 (22) = 21.80
Prob > 𝜒 2 = 0.472
0.261
0.393
*** 1%, ** 5%, * 10%. Year dummies and constant are included but unreported.
The positive 𝛽1 implies that state ownership at low level could facilitate firm operations. For example,
the presence of state owners allows firms to have closer connections with the government and
politicians, thus could be easier to get subsidized interest rate, preferential auction or investment, or
even under the counter transactions with other SOEs or government agencies. In the transition
economy of Vietnam where there is lack of transparency (Smith, Binh, Colvin, and Rab, 2014) and state
business sector is constituted to play the leading role5, these advantages could be significant. However,
when state ownership excesses 22% - the first estimated turning point in GMM – disadvantages of the
agency problem become dominate and negatively affect firm performance. The results indicates partial
privatization could contribute to firm performance improvement.
However, it should be noted that although state ownership possibly have positive impact to efficiency
at firm level, it is hasty to conclude that its increase at low level is good for the economy as a whole.
4
5
To save space, the results are not reported but available on requests
According to the Article 51, The Vietnamese Constitution 2013
18
State ownership in a particular company could assist its own efficiency, but possibly harm that of others
as a result of unfair distribution of public resources. On the other hand, imagine that if every companies
had the state shareholder and thus could get access to the “helping hand” from the government, there
would be no longer competitive advantages as the saturation of accessibility to limited favorable
resources. Therefore, although our empirical results support the hump shaped relationship between
state ownership and firm performance, we should be careful in interpreting the “optimal” level of state
ownership, at which firms have highest performance. It simply a comparison among companies with
various contemporary level of state ownership, but not the suggestion of an optimal level which every
company should reach to.
On the other hand, among control variables, firm size overall is the most significant factor affecting firm
performance, especially in OLS and fixed effects in all four models. The evidence of positive impact is
consistent with literature. Larger firms with their plentiful resources are able to invest in projects that
small firms are excluded (Hall & Weiss, 1967), therefore can easily earn monopoly profit. In addition,
larger companies usually have lower bankruptcy risk and higher transparency, thus tend to be easier in
accessing debt market with bigger loans and at low cost to maximize the benefits of tax shield (Antoniou,
Guney & Paudya, 2008). Moreover, during and after financial crisis of 2008, large-cap stocks could be
a safer haven for investors comparing to that of small companies, which possibly leads to higher Tobin’s
Q. Apart from firm size, the impact of other control variables on firm performance are mostly
insignificant.
5
Conclusion
This study investigates impacts of ownership concentration and state ownership on firm performance
of manufacturing companies listed on the HOSE from 2007 to 2015. Since previous studies does not
completely control for the widely accepted endogeneity ownership structure as well as the dynamic
nature of the relationship between firm characteristics (particularly ownership structure) and firm
performance, this study attempts to overcome these drawbacks by employing the well-developed
system-GMM estimator. The empirical results show the cubic relationship between managerial
ownership and firm performance. The relationship persists even after controlling for block ownership,
meanwhile block ownership itself has no significant impact on firm performance. On one hand, they
19
imply the inefficiency of outside monitoring, which possible is a result of high degree of information
asymmetry, weak legal protection of outside investors and inactive managerial labor market in Vietnam.
On the other hand, they also indicate that increasing managers’ internal incentives could be a more
effective mechanism in corporate governance. Therefore, in order to improve firm performance at least
in the short term, incentive alignment should be given the priority. Regarding to state ownership, our
findings generally support the inverted U-shaped relationship between state ownership and firm
performance in the Vietnamese stock market, which is consistent with Phung and Hoang (2013). It
implies that partial privatization could be an efficient way to improve firm performance in Vietnam.
However, it should be cautious to suggest that firms should achieve the “optimal” level of state
ownership, at which Tobin’s Q reaches its peak in our model.
20
6
Reference
Antoniou, A., Guney, Y., & Paudyal, K. (2008). The determinants of capital structure: capital marketoriented versus bank-oriented institutions. Journal of financial and quantitative analysis,
43(01), 59-92.
Arellano, M., & Bond, S. (1991). Some tests of specification for panel data: Monte Carlo evidence and
an application to employment equations. The review of economic studies, 58(2), 277-297.
Arellano, M., & Bover, O. (1995). Another look at the instrumental variable estimation of errorcomponents models. Journal of Econometrics, 68(1), 29-51.
Balsmeier, B., & Czarnitzki, D. (2015). Ownership concentration, institutional development and firm
performance in Central and Eastern Europe. Managerial and Decision Economics.
Barclay, M. J., & Holderness, C. G. (1989). Private benefits from control of public corporations.
Journal of financial economics, 25(2), 371-395. doi: />Blundell, R., & Bond, S. (1998). Initial conditions and moment restrictions in dynamic panel data
models. Journal of Econometrics, 87(1), 115-143.
Bond, S. R. (2002). Dynamic panel data models: a guide to micro data methods and practice.
Portuguese economic journal, 1(2), 141-162.
Cho, M.-H. (1998). Ownership structure, investment, and the corporate value: an empirical analysis.
Journal of financial economics, 47(1), 103-121.
Chung, K. H., & Pruitt, S. W. (1996). Executive ownership, corporate value, and executive
compensation: A unifying framework. Journal of Banking & Finance, 20(7), 1135-1159.
De Miguel, A., Pindado, J., & De la Torre, C. (2004). Ownership structure and firm value: New
evidence from Spain. Strategic Management Journal, 25(12), 1199-1207.
Demsetz, H., & Lehn, K. (1985). The structure of corporate ownership: Causes and consequences.
The Journal of Political Economy, 1155-1177.
Demsetz, H., & Villalonga, B. (2001). Ownership structure and corporate performance. Journal of
corporate finance, 7(3), 209-233.
Fama, E. F., & Jensen, M. C. (1983). Separation of ownership and control. Journal of law and
economics, 301-325.
Fauzi, F., & Locke, S. (2012). Board structure, ownership structure and firm performance: A study of
New Zealand listed-firms.
Gedajlovic, E., & Shapiro, D. M. (2002). Ownership structure and firm profitability in Japan. Academy
of Management Journal, 45(3), 565-575.
Hall, M., & Weiss, L. (1967). Firm Size and Profitability. The Review of Economics and Statistics,
49(3), 319-331. doi: 10.2307/1926642
Hermalin, B. E., & Weisbach, M. S. (1991). The effects of board composition and direct incentives on
firm performance. Financial management, 101-112.
Himmelberg, C. P., Hubbard, R. G., & Palia, D. (1999). Understanding the determinants of managerial
ownership and the link between ownership and performance. Journal of financial economics,
53(3), 353-384.
Holderness, C. G., Kroszner, R. S., & Sheehan, D. P. (1999). Were the good old days that good?
Changes in managerial stock ownership since the great depression. The journal of Finance,
54(2), 435-469.
Holtz-Eakin, D., Newey, W., & Rosen, H. S. (1988). Estimating vector autoregressions with panel
data. Econometrica: Journal of the Econometric Society, 1371-1395.
Jensen, M. C. (1986). Agency costs of free cash flow, corporate finance, and takeovers. The
American Economic Review, 76(2), 323-329.
Jensen, M. C., & Meckling, W. H. (1976). Theory of the firm: Managerial behavior, agency costs and
ownership structure. Journal of financial economics, 3(4), 305-360. doi:
/>Jiang, G., Yue, H., & Zhao, L. (2009). A re-examination of China’s share issue privatization. Journal of
Banking & Finance, 33(12), 2322-2332. doi: />Kapopoulos, P., & Lazaretou, S. (2007). Corporate ownership structure and firm performance:
evidence from Greek firms. Corporate Governance: An International Review, 15(2), 144-158.
Li, D., Moshirian, F., Nguyen, P., & Tan, L.-W. (2007). Managerial ownership and firm performance:
Evidence from China's privatizations. Research in International Business and Finance, 21(3),
396-413. doi: />Liu, C., Uchida, K., & Yang, Y. (2012). Corporate governance and firm value during the global
financial crisis: Evidence from China. International Review of Financial Analysis, 21, 70-80.
21
Loc, T. D., Lanjouw, G., & Lensink, R. (2006). The impact of privatization on firm performance in a
transition economy. Economics of Transition, 14(2), 349-389.
Loderer, C., & Martin, K. (1997). Executive stock ownership and performance tracking faint traces.
Journal of financial economics, 45(2), 223-255.
McConnell, J. J., & Servaes, H. (1990). Additional evidence on equity ownership and corporate value.
Journal of financial economics, 27(2), 595-612.
Morck, R., Shleifer, A., & Vishny, R. W. (1988). Management ownership and market valuation: An
empirical analysis. Journal of financial economics, 20, 293-315.
Nguyen, T., Locke, S., & Reddy, K. (2014). A dynamic estimation of governance structures and
financial performance for Singaporean companies. Economic Modelling, 40, 1-11.
Nguyen, T., Locke, S., & Reddy, K. (2015). Does boardroom gender diversity matter? Evidence from a
transitional economy. International Review of Economics & Finance, 37, 184-202.
Palia, D., & Lichtenberg, F. (1999). Managerial ownership and firm performance: A re-examination
using productivity measurement. Journal of corporate finance, 5(4), 323-339.
Phung, D. N., & Hoang, T. P. T. (2013). Corporate Ownership and Firm Performance in Emerging
Market: A Study of Vietnamese Listed Firms. Paper presented at the World Business and
Social Science Research Conference, Bangkok October.
Roodman, D. (2009). How to do xtabond2: An introduction to difference and system GMM in Stata.
Stata Journal, 9(1), 86-136.
Schultz, E. L., Tan, D. T., & Walsh, K. D. (2010). Endogeneity and the corporate governanceperformance relation. Australian journal of management, 35(2), 145-163.
Shah, S. Z. A., & Hussain, Z. (2012). Impact of ownership structure on firm performance evidence
from non-financial listed companies at Karachi Stock Exchange. International Research
Journal of Finance and Economics, 84.
Sheu, H.-J., & Yang, C.-Y. (2005). Insider Ownership Structure and Firm Performance: a productivity
perspective study in Taiwan's electronics industry. Corporate Governance: An International
Review, 13(2), 326-337. doi: 10.1111/j.1467-8683.2005.00426.x
Shleifer, A., & Vishny, R. W. (1989). Management entrenchment: The case of manager-specific
investments. Journal of financial economics, 25(1), 123-139.
Shleifer, A., & Vishny, R. W. (1997). A survey of corporate governance. The journal of Finance, 52(2),
737-783.
Shleifer, A., & Vishny, R. W. (2002). The grabbing hand: Government pathologies and their cures:
Harvard University Press.
Short, H., & Keasey, K. (1999). Managerial Ownership and the Performance of Firms: Evidence from
the UK. Journal of corporate finance, 5(1), 79-101.
Smith, G., Binh, L. D., Colvin, J., & Rab, H. (2014). Transparency of state owned enterprises in
Vietnam : current status and ideas for reform. Washington, DC: World Bank Group.
Thomsen, S., & Pedersen, T. (2000). Ownership structure and economic performance in the largest
European companies. Strategic Management Journal, 21(6), 689-705.
Tran, N. M., Nonneman, W., & Jorissen, A. (2014). Government ownership and firm performance: the
case of Vietnam. International Journal of Economics and Financial Issues, 4(3), 628-650.
Villalonga, B. (2000). Privatization and efficiency: differentiating ownership effects from political,
organizational, and dynamic effects. Journal of Economic Behavior & Organization, 42(1), 4374.
Welch, E. (2003). The relationship between ownership structure and performance in listed Australian
companies. Australian journal of management, 28(3), 287-305.
Windmeijer, F. (2005). A finite sample correction for the variance of linear efficient two-step GMM
estimators. Journal of Econometrics, 126(1), 25-51.
Wintoki, M. B., Linck, J. S., & Netter, J. M. (2012). Endogeneity and the dynamics of internal
corporate governance. Journal of financial economics, 105(3), 581-606.
Wooldridge, J. M. (2001). Applications of generalized method of moments estimation. The Journal of
Economic Perspectives, 15(4), 87-100.
Wooldridge, J. M. (2002). Econometric Analysis of Cross Section and Panel Data. Cambridge: MA:
MIT Press.
Yarrow, G., King, M., Mairesse, J., & Melitz, J. (1986). Privatization in Theory and Practice. Economic
Policy, 1(2), 324-377. doi: 10.2307/1344560
Yu, M. (2013). State ownership and firm performance: Empirical evidence from Chinese listed
companies. China Journal of Accounting Research, 6(2), 75-87.
22
![thang nguyen ngoc - 2011 - corporate governance and its impact on the performance of firms in emerging countries - the evidence from vietnam [cg]](https://media.store123doc.com/images/document/2015_01/02/medium_rfd1420194809.jpg)