Tài liệu Checking Resource Usage on Windows 2000 docx
Bạn đang xem bản rút gọn của tài liệu. Xem và tải ngay bản đầy đủ của tài liệu tại đây (739.7 KB, 7 trang )
1 - 7 IT Essentials II v2.0 - Lab 11.4.5 Copyright 2002, Cisco Systems, Inc.
Lab 11.4.5: Checking Resource Usage on Windows 2000
Estimated Time: 20 Minutes
Objective
In this lab the student will use the System Performance Tool to monitor the Resource
usage on the computer system.
Equipment
The following equipment is required for this exercise:
• A computer system running Windows 2000 Professional
Scenario
It is discovered that the server seems to be running slow. In this case, it is a good idea to
open the systems performance monitor in order to inspect the resource usage on the
system. The option options would be to upgrade or add another server if the system
resources have been used up.
Procedures
Open the performance monitor and inspect the system resource usage by graphing, and
then analyzing the graph, to decide what might be causing the system to run slowly and
what might need to be upgraded.
Step 1: Gathering Information
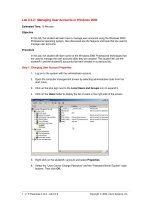
1. Open the performance monitor. Click Start > Programs > Administrative Tools >
Performance.
2 - 7 IT Essentials II v2.0 - Lab 11.4.5 Copyright 2002, Cisco Systems, Inc.
2. Right-click in the right windows and select Add Counters.
3. Check to make sure Add Counters in the performance object drop-down box
Processor is selected.
4. Select the “Counters from the list” radio button.
5. While holding the Control Key down, use the mouse to select %Interrupt Time,
%Processor Time, %User Time, and the Interrupts/sec.
3 - 7 IT Essentials II v2.0 - Lab 11.4.5 Copyright 2002, Cisco Systems, Inc.
6. Click Add and then close the box.
7. Let the graph make a pass across the screen at least once. Then right-click in the
graph area and select Save As…. Save the file as: Lab Processor Graph. While this
is happening, open and close some programs to generate some activity on the
system.
8. Locate the X in the menu bar across the top and delete the %Interrupt Time,
%Processor Time, %User Time, and the Interrupts/sec monitors.
4 - 7 IT Essentials II v2.0 - Lab 11.4.5 Copyright 2002, Cisco Systems, Inc.
9. Right-click in the right windows and select Add Counters.
10. Go back to the performance object drop-down box and select System.
11. While holding the Control Key down, use the mouse to select Processes and
Threads.
5 - 7 IT Essentials II v2.0 - Lab 11.4.5 Copyright 2002, Cisco Systems, Inc.
12. Click Add, and then close the box.
13. Let the graph make a pass across the screen at least once. Then right-click in the
graph area and select Save As…. Save the file as: Lab System Graph.
14. Locate the X in the menu bar across the top and delete the Processes and Threads
monitors.
15. Right-click in the right windows and select Add Counters.
16. Go back up to the performance object drop-down box and select PhysicalDisk.
6 - 7 IT Essentials II v2.0 - Lab 11.4.5 Copyright 2002, Cisco Systems, Inc.
17. While holding the Control Key down, use the mouse to select %Disk Read Time and
%Disk Write Time.
18. Click Add, and then close the box.
19. Let the graph make a pass across the screen at least once. Tthen right-click in the
graph area and select Save As…. Save the file as: Lab Physical Disk Graph.
20. Locate the X in the menu bar across the top and delete the %Disk Read Time and
%Disk Write Time monitors. While this is happening open and close some programs
to generate some activity on your system.
21. Close the Performance Monitor.
7 - 7 IT Essentials II v2.0 - Lab 11.4.5 Copyright 2002, Cisco Systems, Inc.
Step 2: Evaluating the Information
1. Navigate to the folder where the performance monitor files were saved.
2. Open them up one by one and analyze them.
3. What conclusions can be drawn from these graphs?
4. What could be some reasons for using such graphs?
Troubleshooting
These performance monitor tools can very helpful in troubleshooting a system. They can
provide a lot of information about a system and the overall health of a system. By using
the performance monitor to check system resources a technician can effectively evaluate
what might be causing problems in the system.