Dession to choose fast food restaurants of young people in ho chi minh city viet nam
Bạn đang xem bản rút gọn của tài liệu. Xem và tải ngay bản đầy đủ của tài liệu tại đây (582.37 KB, 15 trang )
Herald NAMSCA 4, 2018
Ha Nam Khanh Giao
DECISION TO CHOOSE FAST FOOD RESTAURANTS
OF THE YOUNG PEOPLE IN HO CHI MINH CITY, VIETNAM
Ha Nam Khanh Giao
University of Finance and Marketing, Vietnam
Abstract. This study has specific objectives of Identifying and Measuring the impact level of the factors that affect
the decision to choose fast food restaurants of the young people in Ho Chi Minh City, Vietnam (HCMC), by surveying 225
young consumers living in HCMC. The SPSS 20 tool was used through the Cronbach's Alpha, EFA, multiple linear
regression analysis. The result shows four factors positively affect the decision of choosing fast food restaurants of the
young people in HCMC in the order of decreasing level: (1) Price, (2) Products, (3) Store location, and (4) Space. The
results also show that there is no difference in the decision by gender but there are differences by occupation and income.
From that, several managerial recommendations have been proposed for managers of fast-food stores to develop
appropriate marketing strategies that impact on young people.
Keywords: Decision to choose, Fast food restaurants, The young people in HCMC
Introduction. Vietnam ranks 14th among the most populous countries in the world, with more than 94 million
people and a young population dominating structure, the characteristics of the young people in Viet Nam in general and
HCMC in particular are high start-up spirit; busy lifestyle; need of convenience; low income; wanting to save time to study,
work. Therefore, the demand for fast food at reasonable prices is the urgent need. In addition, young people are keen,
daring, and fun to approach new things, even in cuisine. Therefore, the fast food market of our country has great potential
development.
Young people tend to choose food stores to meet their own urgent needs: fast-processed food or immediately sold,
being able to carry away, time saving and reasonable prices. In other words, young people do not fully choose fast-food
restaurants with well-known brands such as McDonald's, Domino's Pizza, Burger King, etc. According to a recent FT
Confidential Research survey, "The rate of Vietnamese consumers to these stores has dropped dramatically in the past few
years. Instead, customers buy fast food at convenience stores, which account for 86% (Nielsen, 2016). The number of inhouse fast-food restaurants continues to grow at 27% (Euromonitor, 2016). It is noteworthy that the fast food market is also
fierce competition when young people are attracted and fascinated in fast food areas of supermarkets, hypermarkets such as
Lotte Mart, Emart, The study of decision to choose fast food restaurants of the young people in HCMC becomes necessary.
LITERATURE REVIEW AND RESEARCH MODEL
Concept and theory
Consumer behavior
According to Kotler & Armstrong (2014), consumer behavior refers to end-user buying behavior - individuals and
households purchase goods and services for personal consumption. Meanwhile, according to the American Marketing
Association, consumer behavior is the interaction between environmental stimuli and human perceptions and behaviors
which change their lives. In other words, consumer behavior includes the thoughts and feelings that people have and the
actions they take in the process of consumption. Factors such as opinions from other consumers, advertising, price
information, packaging, product appearance ... can affect the customer's feelings, thoughts and behaviors.
Factors affecting consumer behavior
According to Kotler & Armstrong (2014), factors affecting consumer behavior include Culture (including Culture,
Culture branches, Social Classes), Society (Groups and Social Networks, Family, Role and status), Individual (Age and
stage of life cycle, Occupation, Economic situation, Lifestyle, Personality and Ego), Psychology (Motivation, Perception,
Learning, Beliefs and attitudes), Marketing mix (Advertising, Price, Distribution channels)
Behavioral Theory – TPB
The proposed behavioral theory is the development and improvement of the Theory of Reasoned Action by Ajzen
and Fishbein (1975) and is the commonly used theory when it comes to predicting a particular behavior of any individual, it
could be the act of choosing to buy products or services; elective behavior, etc. The relationship between decision and
behavior has been given and empirically tested in a wide range of studies in a wide range of areas including business
administration, marketing, psychology. The two main factors influencing the decision are individual attitudes and subjective
norms. In particular, individual attitudes are measured by belief and appreciation for the outcome of that behavior. Ajzen
(1991) defined subjective norms as the perception of influencers that the individual should behave or not perform certain
behaviors. (1) Attitude Toward Behavior (AB) is defined as positive or negative emotions that are affected by psychological
factors and situations, (2) Subjective Norm (SN) or sense of community influence is defined as "perception of social
pressure on whether or not to act, (3) Perceived Behavioral Control (PBC) reflects the ease or difficulty of performing
behavior and whether the behavior is controlled or restricted. All three factors affect behavioral intention.
The young people
471
Electronic copy available at: />
Herald NAMSCA 4, 2018
Ha Nam Khanh Giao
According to the United Nations Educational, Scientific and Cultural Organization (UNESCO), young people are
between the ages of 15 and 24. This topic is aimed at young people aged 18 to 24 for two reasons: (1) People in their 18s are
equipped with certain common knowledge, (2) Young people in this age group have the highest concentration of health,
young people, dare to do; have aspiration to rise strongly and conditions to express that will, aspiration through learning,
labor, creativity. Young people are confident, dynamic and enthusiastic age, growing up in the era of information
technology boom and have conditions to update new trends, cuisine is no exception. In Ho Chi Minh City - an economic
center with a population of about 10 million people, the working environment is in harmony with the busy lifestyle, facing
with limited time and finance, fast food is very attractive, especially for young people today. In general, young people go to
fast food stores with international and domestic brands to dine because it gives them a sense of luxury. In addition, young
people choose fast food stores because of the comfortable space for sitting and eating with friends, colleagues, lovers,... at
noon, on birthday or at weekend. Buzzmetrics's Social Media survey (2015) shows that discount promotions are also a
factor that attracts young people. In times of negative economic, young people are turning to fast food stores to meet not
only the convenience, compact, less time consuming, but also reasonable prices to continue to work, study later. This is the
fast food sector in convenience stores, supermarkets and hypermarkets.
Some research related to the topic. The study by Mason & Associates (2013) identified success factors in fast
food restaurants conducted in the United States, calculating the Attribute Important Index Score (AIS) of the factors
affecting the decision to choose fast food restaurants of students. The results achieved were as follows: Price (AIS = 246),
Service speed (AIS = 217), Store location (AIS = 208), Food quality (AIS = 203) and Cleanliness (AIS = 201).
Matiza & Oni (2014) studied the factors influencing the choice of fast food restaurants for rural consumers of
American fast food franchises. Research results determine that the national origin of the franchise brand does not play a
special role in the decision-making process of consumers. Instead, price, convenience and store location are key factors that
motivate rural consumers to choose fast food restaurants. Research also recognizes the following important factors
influencing their decision-making choices: time, customer service, and brand loyalty.
Harrington et al (2015) studied key factors affecting choice of fast food stores and the role of gender, age and
frequency of fast food consumption. This study examined the relationship between the seven factors that influence the
decision to choose a fast food restaurant: quality, space, marketing, price, diet, location of a food shop, fast and promotional
activities. Age, sex and frequency of fast food intake also influence relationships with these factors.
The study by Afrin & Ramalingam (2016) was conducted in the city of Chennai, India to find out what factors
influence consumers' choice of fast food restaurants. Research results indicate that the product is the main factor in addition
to the following factors: product diversity, price, store location, customer service, service attitude, opening hours and
service speed influence the decision to choose a fast food restaurant here.
The Clever & Felix’s (2016) study explored the factors that influence the choice of a fast food restaurant. The
authors point out that good food as well as food taste are the leading factors influencing consumers' decision to choose fast
food restaurants. In addition, solving customer complaints and price are other factors that attract customers to fast food
restaurants.
A study by Priyadarshini (2016) on fast-food restaurants in Coimbatore, India showed three main reasons for
choosing fast food restaurants: convenience, price and food taste.
A study was conducted by Nguyen Thi Hong Nhu (2014) on the factors influencing the decision to choose fast
food restaurants in Can Tho city. The results show that the factors that influence the choice of fast food restaurants are:
Attitude and service style, location and scale, price, customer care, habits and preference use, brand image.
A summary of previous research result is presented in Table 1.
Table 1: Summary of previous research results
Factor
Researcher
Mason et Matiza & HarringAfrin
& Clever
& PriyadarNguyen Thi
al.
Oni
ton et al. RamalinFelix (2016) shini
Hong Nhu
(2013)
(2014)
(2015)
gam (2016)
(2016)
(2014)
Price
Product
Store location
Service speed
Cleanliness
Convenience
Customer service
Brand loyalty
Space
Diet
Promotion
472
Electronic copy available at: />
Herald NAMSCA 4, 2018
Ha Nam Khanh Giao
activities
Service attitude
Business hours
Good food for
health
Habits and
consumer
preferences
Brand image
Research models and research hypotheses
From the basis of Peter & Olson (2010) and Kotler & Armstrong (2014) Consumer Behavior Theory, as well as the
study of the factors influencing the decision to choose a fast food restaurant, The characteristics of fast food restaurants and
the characteristics of young fast-food consumers in HCMC stores, inherited and developed from Afrin & Ramalingam
(2016) model, added to the "brand image" by Nguyen Thi Hong Nhu (2014) and the "space" element of Harrington et al.
(2015), the proposed model is shown in Figure 1.
Personal
characteristics:
Gender
Income
Occupation
Product (PRO)
H1
Price (PRI)
Store location (ST)
H3
Customer service (CS)
H4
Service attitude (SA)
H2
H8
Decision to
choose fast
food restaurants
H5
H6
Space (SPA)
Brand image (BI)
H7
Figure 1: Model of factors influencing decision to choose fast food restaurants of the young people in HCMC
H1: The suitable products positively influences the decision to choose a fast food restaurant.
H2: Reasonable prices positively influences the decision to choose a fast food restaurant
H3: Convenient store location positively influences the decision to choose a fast food restaurant
H4: Good customer service positively influences the decision to choose a fast food restaurant
H5: Good service attitude positively influences the decision to choose a fast food restaurant.
H6: Spacious, cool space positively influences the decision to choose a fast food restaurant
H7: Famous brand image positively influences the decision to choose a fast food restaurant
H8a: There is a difference in the decision to choose fast food restaurants in HCMC by gender.
H8b: There is a difference in the decision to choose fast food restaurants in HCMC by income.
H8c: There is a difference in the decision to choose fast food restaurants in HCMC by occupation..
473
Electronic copy available at: />
Herald NAMSCA 4, 2018
Ha Nam Khanh Giao
RESULTS AND DISCUSSION
Sample description
Table 2: Sample characteristics
Sample characteristics
Male
Female
Secondary school
High school
Intermediate
College
After university
Student
Worker
Trade
Officer
Officials and civil servants
Manager
Other
Less than 3 million
From 3 million - under 5 million
From 5 million - less than 10 million
Over 10 million
Fastfood restaurants
Convenience shop
Supermarkets, hypermarkets
Others
Less than 2 times
From 2 times - 4 times
From 4 times - 6 times
More than 6 times
Morning
Noon
Afternoon
Night
Frequency
Ratio (%)
94
41.8
Gender
131
58.2
13
5.8
27
12.0
Academic level
33
14.7
147
65.3
5
2.2
77
34.2
13
5.8
8
3.6
Occupation
72
32.0
37
16.4
6
2.7
12
5.3
97
43.1
82
36.4
Income per month
34
15.1
12
5.3
54
24.0
The type of fast food
91
40.4
restaurants that is
78
34.7
usually come
2
0.9
44
19.6
Times to go to fast
93
41.3
food restaurants
perweek
32
14.2
56
24.9
16
7.1
89
39.6
Time to go to fast
food restaurants
58
25.8
62
27.5
(Source: Synthesis from authors’ study)
The survey was conducted in September 2017. 250 questionnaires were distributed, after eliminating 25
unsatisfactory responses (respondents were not included in the survey, an inadequate statement or answer card), the
remaining was 225 samples, reaching a rate of 90%. The data was entered, encrypted, cleaned and analyzed using SPSS 23
software. The sample statistic results were presented in Table 2
ASSESSING THE RELIABILITY OF THE SCALE
Cronbach's Alpha is used to test the reliability of the scale.
The results of the first Cronbach's Alpha analysis indicate that the variables being rejected are PRI3, SA5, and BI3
because they are correlated with total variables less than 0.3. It can be seen that the survey subjects in this study are young,
low income, specifically the average monthly income below 3 million accounts for 43.1%. Therefore, choosing their fast
food restaurants is not affected by the price difference (PRI3) or the luxury feeling brought by the restaurants (BI3). At the
same time, this can also be seen as a proof of Maslow's order of magnitude. In addition, most fast food restaurants are selfservice ones. Therefore, that young people do not pay attention to the staff (SA5) is understandable.
The results of the second test (Table 3), the scales met the criteria (Cronbach's Alpha coefficient ≥ 0.6 and the
correlation coefficient - correction sum ≥ 0.3). Therefore, it is used for the subsequent EFA.
Table 3: Cronbach's Alpha reliability scores
Correlation
Cronbach’s Alpha
Average scale if
Scale variance if
Variable
coefficient if eliminating
eliminating variable
eliminating variable
correction sum
variable
Product (PRO), Cronbach’s Alpha = 0.853
PRO1
15.88
6.520
0.679
0.819
474
Electronic copy available at: />
Herald NAMSCA 4, 2018
PRO2
15.99
6.326
PRO3
16.18
7.105
PRO4
16.24
6.880
PRO5
16.16
6.912
Price (PRI), Cronbach’s Alpha = 0.694
PRI1
11.45
3.570
PRI2
11.15
3.995
PRI4
11.14
4.110
PRI5
11.50
4.028
Store Location (ST), Cronbach’s Alpha = 0.756
SL1
15.24
5.409
SL2
15.17
5.903
SL3
15.20
5.551
SL4
15.24
5.909
SL5
15.53
5.420
Customer service (CS), Cronbach’s Alpha = 0.743
CS1
15.52
6.206
CS2
15.28
5.738
CS3
15.22
6.189
CS4
15.24
5.895
CS5
14.81
6.563
Service attitude (SA), Cronbach’s Alpha = 0.660
SA1
11.89
2.872
SA2
11.86
3.360
SA3
11.57
3.264
SA4
11.67
3.231
Space (SPA), Cronbach’s Alpha = 0.733
SPA1
15.29
5.501
SPA2
15.02
5.696
SPA3
15.16
5.849
SPA4
14.96
6.151
SPA5
15.44
5.953
Brand image (BI), Cronbach’s Alpha = 0.698
BI1
9.96
3.668
BI2
9.99
3.580
BI4
9.76
4.630
BI5
9.71
4.081
Decision to choose fast food restaurants (CD), Cronbach’s Alpha = 0.748
CD1
15.59
5.628
CD2
15.37
5.966
CD3
15.36
5.669
CD4
15.56
6.221
CD5
15.42
6.727
Ha Nam Khanh Giao
0.748
0.630
0.626
0.646
0.800
0.832
0.833
0.828
0.571
0.546
0.467
0.354
0.566
0.592
0.636
0.716
0.543
0.452
0.571
0.483
0.565
0.705
0.737
0.695
0.726
0.696
0.469
0.626
0.429
0.583
0.436
0.711
0.652
0.729
0.669
0.722
0.504
0.368
0.496
0.404
0.546
0.640
0.561
0.617
0.566
0.466
0.508
0.494
0.444
0.658
0.699
0.682
0.688
0.706
0.621
0.576
0.337
0.413
0.545
0.570
0.715
0.678
0.583
0.676
0.575
0.681
0.576
0.679
0.465
0.720
0.368
0.752
(Source: Analysis of research data of the authors)
EXPLORATORY FACTOR ANALYSIS - EFA
Analyzing exploratory factors of independent variables
32 observed variable of 7 independent variables from the proposed study model are included in the EFA. Results of
the fourth EFA: Barlett's test show sig. = 0.000 < 0.05; KMO coefficient = 0.816 > 0.5 which is eligible for factor analysis.
Twenty-nine observed variables are extracted from seven factors at Eigenvalues = 1,163 > 1 and he extracted variance is
59.503% > 50%, which accounts for 59.503% the variance of the data. At the same time, factor loadings ≥ 0.5. Therefore,
the observed variables in the scale meet the requirement of convergence level and discrimination level between the factors.
The Cronbach's Alpha coefficient shows that the reliability of the seven new scales is satisfactory (Table 4).
475
Electronic copy available at: />
Herald NAMSCA 4, 2018
Variable
PRO2
PRO5
PRO1
PRO4
PRO3
SL2
SL 3
SL1
SL5
SL4
PRI4
PRI2
PRI1
PRI2
CS2
CS4
CS1
CS3
SPA3
SPA4
SPA5
SPA1
BI2
BI1
BI5
SA3
SA4
SA1
SA2
Eigenvalue
Extracted variance (%)
Cronbach’s Alpha
Ha Nam Khanh Giao
Table 4: Results of the EFA of the 4th independent variables
Factor loadings
1
2
3
4
5
0.833
0.756
0.739
0.694
0.655
0.714
0.702
0.615
0.582
0.543
0.713
0.708
0.670
0.653
0.812
0.656
0.644
0.507
0.740
0.674
0.596
0.537
6
7
0.848
0.841
0.590
6.931
23.901
0.853
2.719
9.376
0.756
1.894
6.530
0.753
0.743
0.641
0.637
0.599
1.662
1.485
1.402
1.163
5.731
5.120
4.833
4.010
0.722
0.699
0.715
0.660
(Source: Analysis of research data of the authors)
Therefore, the results of the EFA have eliminated three variables: PRI5 (I choose fast food restaurants which discount when
purchasing in a large amount), CS5 (I choose fast food restaurants with attractive service) and BI4 (I choose fast food restaurants with a lot
of community activities). What young people need is the need to eat in a timely manner to save time for resting and preparing for the next
effective working shift. In addition, when using in small quantities but with frequencies of regular use from 2 to 4 times a week,
accounting for 41.33% and more than 6 times a week accounts for 24.89%, they want the price which is suitable for the income,
restaurants that are near the work place, so the discount and additional services when buying in a large amount are no longer important.
Community-based activities are too ideal because the actual need does not allow for what is too great for the community. In general, after
eliminating unsuitable variables, the total number of observed variables in the remaining model is 29 variables. The seven groups of
factors which were extracted after the EFA corresponded to the original seven concepts and without much disturbance, so these groups of
factors would remain unchanged as group a.
Factor
1
2
3
4
5
6
7
Name
Product
Restaurant location
Price
Customer service
Space
Brand image
Service attitude
Table 5: Name and symbol of the factors after the EFA
Symbol
Variable
PRO
PRO1, PRO2, PRO3, PRO4, PRO5
SL
SL1, SL2, SL3, SL4, SL5
PRI
PRI1, PRI2, PRI4, PRI2
CS
CS1, CS2, CS3, CS4
SPA
SPA1, SPA3, SPA4, SPA5
BI
BI1, BI2, BI5
SA
SA1, SA2, SA3, SA4
(Source: Analysis of research data of the authors)
476
Electronic copy available at: />
Herald NAMSCA 4, 2018
Ha Nam Khanh Giao
Analysis of exploratory dependent variable factors
The results of the dependent variable analysis (Appendix 8) show that the coefficient KMO = 0.758 and Barlett's
test has sig. = 0.000 < 0.05 indicating the research data are appropriate for the EFA; The five observed variables were
extracted into one factor at Eigenvalues = 2.507 > 1 and the total variance of 50,133% means 50,133% the variability of the
data were interpreted and the variables had a factor loadings ≥ 0, 5. The Cronbach's Alpha coefficient shows the reliability
of the new scale (Table 4.5). Thus, the "the decision to choose fast food restaurants" includes 5 observed variables CD1,
CD2, CD3, CD4, CD5.
Table 6: Results of EFA of dependent variables
Extracted
Cronbach’s
Variable
Factor loading
Eigenvalues
variance
Alpha
The decision to choose fast food restaurants
2.507
50.133
0.748
CD1
0.775
CD2
0.766
CD3
0.761
CD4
0.660
CD5
0.552
(Source: Analysis of research data of the authors)
ASSESSING THE MODEL AND RESEARCH HYPOTHESE
After analyzing the EFA, seven factors were included in the model test. Factor value is the mean of the observed
variables of the component. Pearson correlation analysis was used to examine the suitability of incorporating components
into the regression model. The results of the regression analysis will be used to test hypotheses H1 to H7.
Determination of Pearson correlation coefficient
Correlational analysis was performed to examine the linear relationships between independent variables and
dependent variables. The correlation matrix in Table 4.6 presents the Pearson (r) correlation coefficients between study
variables and the significance level of each factor.
The Pearson Correlation Coefficient (Table 7) shows that all correlations between variables ranging from 0.15 to
0.763 satisfy the condition of -1
dependent variables are not so high, so it is unlikely that multi-collinearity will occur. This demonstrates that independent
variables with distinct values are more likely to account for dependent variables. The correlation matrix also showed that the
Price variable (r = 0.763) had the strongest impact on the dependent variable – the decision to choose fast food restaurants,
the Brand image variable (r = 0.211) had the least effect on the dependent variable – the decision to choose fast food
restaurants.
Table 7: Pearson correlation coefficient matrix
CD
PRO
SL
PRI
CS
SPA
BI
SA
Pearson correlation
1
0.578** 0.463** 0.763** 0.322** 0.563** 0.211** 0.289**
CD
Level of significance
0.000
0.000
0.000
0.000
0.000
0.001
0.000
Pearson correlation
1
0.420** 0.409** 0.404** 0.397** 0.218** 0.297**
PRO
Level of significance
0.000
0.000
0.000
0.000
0.001
0.000
Pearson correlation
1
0.275** 0.476** 0.227** 0.362** 0.400**
SL
Level of significance
0.000
0.000
0.001
0.000
0.000
Pearson correlation
1
0.186** 0.507** 0.155* 0.155*
PRI
Level of significance
0.005
0.000
0.020
0.020
Pearson correlation
1
0.280** 0.240** 0.380**
CS
Level of significance
0.000
0.000
0.000
Pearson correlation
1
0.214** 0.198**
SPA
Level of significance
0.001
0.003
Pearson correlation
1
0.214**
BI
Level of significance
0.001
Pearson correlation
1
SA
Level of significance
**. Level of significance of correlation coefficient was at 0.01 (in both tails).
*. Level of significance of correlation coefficient was at 0.05 (in both tails).
(Source: Analysis of research data of the authors)
477
Electronic copy available at: />
Herald NAMSCA 4, 2018
Ha Nam Khanh Giao
Linear regression analysis
The Pearson correlation coefficient test showed that seven independent variables could be included in the model to
explain the dependent variable. The authors analyze the linear regression with the Enter method to test the consistency of
the seven factors affecting the dependent variable that determine the choice of fast food restaurants in the city.
Table 8 shows that the adjusted R2 is 0.708, meaning that 70.8% of the variation in CD (Decision to choose a fast
food restaurants) is explained by the variability of 7 independent variables PRO, PRI, SL, CS, SA, SPA and BI. In addition,
the Durbin-Watson test d = 1,860 (1 < d < 3) showed no correlation between residuals.
Table 8: Level of explanation of the model
Model
R
R2
Adjusted R2
Estimated error
Durbin – Watson coefficient
a
1
0.847
0.717
0.708
0.32198
1.860
a. Independent variable: (Constant), PRO, PRI, SL, CS, SA, SPA
b. Dependent variable: QD
(Source: Analysis of research data of the authors)
To test whether the model can be modeled for real or not, it is necessary to test the fit of the model by ANOVA.
Table 9: Relevance of the model: Analysis of ANOVA variance
Degree of freedom
Model
Total square
Average squared
F
Sig.
(df)
1 Regression
57.076
7
8.154
78.647
0.000b
Residual
22.497
217
0.104
Total
79.573
224
a. Dependent variable: QD
b. Independent variable: (Constant), PRO, PRI, SL, CS, SA, SPA
(Source: Analysis of research data of the authors)
In the analysis of ANOVA variance (Table 9) shows: Sig value. of F (= 78,647) has a very small significance level
(Sig. = 0.000 < 0.05). This means that the linear regression model given is consistent with the data collected.
Table 10: Statistical analysis of regression coefficients
Standardized
Unstandardized coefficient
Multicollinearity
coefficient
Model
t
Sig.
B
Standard error
Beta
Tolerance
VIF
1
(Constant)
PRO
SL
PRI
CS
SPA
BI
SA
-0.273
0.195
0.191
0.500
-0.007
0.161
-0.023
0.048
0.211
0.042
0.047
0040
0.041
0.044
0.033
0.043
-1.295
0.197
4.696
0.000
0.658
1.520
4.039
0.000
0.621
1.609
12.426
0.000
0.679
1.472
-0.167
0.867
0.679
1.474
3.662
0.000
0.674
1.484
-0.717
0.474
0.845
1.183
1.109
0.269
0.781
1.281
(Source: Analysis of research data of the authors)
Table 10 shows the sig. value of the four independent variables: PRO, SL, PRI, and SPA less than 5%, it concludes
that these four independent variables are significant in the model. Meanwhile, three independent variables: CS, BI, and SA
have sig. value of 0.867, 0.474 and 0.269 which are greater than 5%, these three variables are not significant in the model.
In addition, with a significance level of α = 5%, look up the table: t 0,025 (217) = 1,971. Because the t-values of PRO, SL,
PRI and SPA are 4,696; 4,039; 12,426; 3,662 which are larger than 1,971, we conclude that the product, location, price and
space actually influence the choice of fast food restaurants in HCMC.
In addition, Table 10 also shows that the variables have a VIF value of less than 2, meaning that there is no
multicollinearity between independent variables in the model.
Therefore, regression equation for variables with unstandardized coefficients is:
CD = -0.272 + 0.195 * PRO + 0.191 * SL + 0.500 * PRI + 0.161 * SPA
In which:
CD: Decision to choose fast food restaurants of young people in Ho Chi Minh City
PRO: Product
SL: Restaurant location
PRI: Price
SPA: Space
0.209
0.185
0.544
-0.007
0.161
-0.028
0.045
478
Electronic copy available at: />
Herald NAMSCA 4, 2018
Ha Nam Khanh Giao
According to the above equation, the decision of choosing a fast food restaurant in HCMC is influenced by four
factors: product, price, restaurant location and space. The model also shows that the regression coefficients are positive (+),
reflecting the factors in the regression model which all have a positive effect on their choice of fast food restaurants;
therefore, accepting the hypotheses H1, H2, H3, H6 proposed in the original theoretical model (Figure 1).
In terms of the influence of the factors that determine the choice of fast food restaurants of young people in
HCMC, it is found that:
Price is the most influential factor with the standardized beta of 0.544 positive impact and reaches statistical
significance to the choice of fast food restaurant of young people in HCMC.
Product is the second most influential factor with the standardized beta of 0.209 positive impact and reaches
statistical significance to the choice of fast food restaurant of young people in HCMC.
Restaurant location is the third most influential factor with the standardized beta of 0.185 positive impact and
reaches statistical significance to the choice of fast food restaurant of young people in HCMC.
Space is the fourth most influential factor with the standardized beta of 0.166 positive impact and reaches
statistical significance to the choice of fast food restaurant of young people in HCMC.
Table 11: Summary of test results for hypotheses
Hypotheses
Level of sig.
Testing result
H1: The right product has a positive impact on the decision to
0.000
Accepted
choose a fast food restaurant.
H2: Reasonable prices have a positive impact on the decision to
0.000
Accepted
choose fast food restaurants.
H3: Favorable restaurant location has a positive impact on the
0.000
Accepted
decision to choose fast food restaurants.
H4: Good customer service has a positive impact on the
0.867
Rejected
decision to choose fast food restaurants.
H5: Good service attitude has a positive impact on the decision
0.269
Rejected
to choose fast food restaurants.
H6: Space has a positive impact on the decision to choose fast
0.000
Accepted
food restaurants.
H7: Famous brand image has a positive impact on the decision
0.474
Rejected
to choose fast food restaurants.
(Source: Aggregated by the authors)
Rejecting the hypotheses H4, H5, H7 for the meaning of 0.867; 0.269; 0.474 because their value is greater than 0.05.
In addition, the survey found that the majority of young people having low income go to fast food restaurants 2 to 6 times
which accounts for more than 50%, but the fast food restaurants are mainly self service. Therefore, it can be concluded that
customer service, service attitude does not affect the decision to choose fast food restaurants of young people in HCMC
compared with other theories.
In addition, the study removed the branding image - a testimony for latest survey of FT Confidential Research - the
research division of The Financial Times in the UK when declaring the percentage of Vietnamese consumers going to
international fast food chains such as Lotteria, KFC, Burger King, etc., it has decreased remarkably in the last two years.
In fact, the first fast food restaurant in HCMC was KFC when it entered Vietnam in 1997 and had to accept losses
for seven consecutive years. Or as Burger King brand in Vietnam in 2012 with the goal of opening 60 stores in the first five
years in Vietnam, but so far only 16 stores are open. This proves that brand image is not the key factor affecting young
people in the decision to choose fast food restaurants.
Testing regression assumptions
Assuming there is no correlation between residuals
The results in Table 8 show that the Durbin - Watson coefficient is 1.860 (1 < d <3). Consequently, it can be
concluded there is no correlation between residuals.
Assuming the residuals have a normal distribution
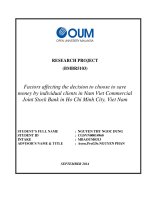
The frequency spectra of the histogram standardized residue (Figure 2) shows that the normal distribution of the
residuals is approximately standard, the average value of the Mean observations is -1.27E-15 (near zero) and the constant
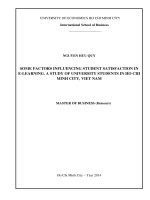
variance is 0.984 (close to 1). Thus, the hypothesis assumes that the normal distribution remain unbroken. Figure 3 P-P
frequency shows the points of the random dispersion around the diagonal (expected line), assuming the normal distribution
of the residuals is satisfied.
479
Electronic copy available at: />
Herald NAMSCA 4, 2018
Ha Nam Khanh Giao
Figure 2: Frequency of Histogram standardized residual
(Source: Analysis of research data of the authors)
Figure 3: P-P Plot frequency of the residual
(Source: Analysis of research data of the authors)
Assumption does not occur multicollinearity
The regression results (Table 10) show that the tolerance values of the independent variables are greater than 0.5;
Variance inflation factor (VIF) is less than 2. Thus, it is possible to confirm that there is no multicollinearity.
Assumptions about linear relations
480
Electronic copy available at: />
Herald NAMSCA 4, 2018
Ha Nam Khanh Giao
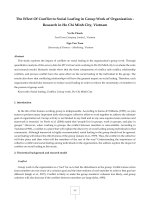
The standardized residual dispersion indicates that the residual values are dispersed randomly in an area around the
line that passes through zero, without any rule or shape. Therefore, the assumption of linear correlation is not violated.
Figure 4: Standardized residual dispersion
(Source: Analysis of research data of the authors)
Assumption of the variance of the standard error
Spearsman's Rho correlation test showed that the correlation coefficient between absolute values and variables was
not statistically significant (sig. < 0.05). Thus, the assumption of the variance of the standard error is not violated.
Table 12: Spearsman's Rho correlation matrix
QD
SP
VT
GC
KG
AbsRe
Correlation coefficients
1.000
0.543**
0.446**
0.755**
0.557**
-0.092
QD
Level of significance
.
0.000
0.000
0.000
0000
0.170
Correlation coefficients
1.000
0.406**
0.403**
0.384**
-0.066
SP
Level of significance
.
0000
0.000
0.000
0.324
Correlation coefficients
1.000
0.262**
0.249**
0.018
VT
Level of significance
.
0.000
0.000
0.787
Correlation coefficients
10000
0.501**
0.130
GC
Level of significance
.
0.000
0.057
Correlation coefficients
10000
0.053
KG
Level of significance
.
0427
Correlation coefficients
1.000
AbsRe
Level of significance
.
AbsRe: Absolute value of the residual
(Source: Analysis of research data of the authors)
481
Electronic copy available at: />
Herald NAMSCA 4, 2018
Ha Nam Khanh Giao
TESTING THE DIFFERENCES OF DECISION TO CHOOSE THE FAST FOOD RESTAURANTS UNDER THE
PERSONAL CHARACTERISTICS
Determining gender differences
The independent T-Test gives us the difference between men and women in choosing a fast food restaurant.
Conducting hypothesis testing H0: "The variance between men and women is the same".
According to the variance identity check, the hypothesis H0 , ie the constant variance. Therefore, we use the t-test
result on the first line (Equal variances assumed).
Based on the sig. value by checking t, we see the sig. value is 0.483 > 0.05, indicating that there is no difference
between men and women in the decision to choose a fast food restaurant. Hypothesis H8a is rejected.
Determining the difference by income
Derived from hypothesis H0: "Income variance is the same". According to the variance identity test, Levene
statistics with sig. value is 0.460 > 0.05 with a 95% confidence that we can accept the hypothesis H0, ie the constant
variance.
Results of ANOVA analysis showed sig. value 0.008 < 0.05 meaning that there are differences between the
different income levels. H8b hypothesis is accepted.
Determining the difference by occupation
Derived from hypothesis H0: "Occupation variance is the same". According to the variance identity check, Levene
statistics with the sig. value is 0.443 > 0.05 with a 95% confidence so we can accept the H0 hypothesis, variance remains
unchanged.
Results of ANOVA analysis showed sig. value is 0.009 < 0.05 meaning there are differences between different
occupations. Hypothesis H8c is accepted.
RESULT DISCUSSION
This study was conducted to identify the factors influencing the decision to choose fast food restaurants in HCMC,
thereby enhancing the ability to attract young people to fast food restaurants in this market. The research results show that
four factors influencing the decision of choosing fast food restaurants in HCMC from big to small are price (β = 0.544),
product (β = 0.209) , location (β = 0.185) and space (β = 0.161). In summary, the results of this analysis are consistent with
those of previous studies.
Table 13: Comparison of study results
Researcher
Matiza
Afrin
Clever
Factor
Mason
Harrington
Nguyen Thi
&
&
&
Authors
et al.
et al.
Hong Nhu
Oni
Ramalingam
Felix
Price
Product
Restaurant
location
Customer
service
Service attitude
Space
Brand image
(Source: Aggregated by the authors)
However, the level of influence of factors is different due to different contexts and objects. In addition, the results
of testing the difference in the decision to choose a fast food restaurant according to the individual characteristics of the
young showed no difference in the decision to choose a fast food restaurant of young people at HCMC by gender but there
is difference by occupation and income.
The results are important for fast food marketers in HCMC. Because the understanding of customer behavior will
provide the foundation for marketing such as product placement, new product development, complex marketing decisions,
etc. These key marketing activities will be more effective when put on the basis of an understanding of customer behavior,
specifically here is the youth. With different professions, different income, the decision to choose their fast food restaurants
will be different. Therefore, managers should consider what market segment they can best serve in finite resources. For
example, price, the only element in the marketing mix that generates revenue, while other elements embody the cost, is a
very flexible element because it can be changed quickly. And young people do not always understand the change in the
price. They may infer that the dish is poor quality, using inventory material, is about to expire, so the businessmen must
determine the appropriate pricing strategy. But it is to ensure that the food must taste delicious, suitable for the taste of
482
Electronic copy available at: />
Herald NAMSCA 4, 2018
Ha Nam Khanh Giao
today's young people. Of course, adding new dishes to enrich the menu will also attract customers, however, this will cause
some of the increased costs which require fast food restaurant operators to think, consider financial possibilities. Similarly,
the expansion of the restaurant chain in convenient, easy to travel locations is considered a great challenge for businessmen.
In the end, space, the least influential factor in choosing young people's fast food restaurants. But when thinking, the
investment for clean, prominent and different restaurant space will be successful when targeting customers who are young
because they are the people who love the new and dynamic things.
CONCLUSION AND ADMINISTRATIVE IMPLICATIONS
Conclusion. The study was started from Peter & Olson (2010) and Kotler & Armstrong (2014)’s Consumer
Behavior Theory of Consumer Research, as well as studies on the factors influencing choice of fast food restaurants, the
characteristics of fast food restaurants and the characteristics of young fast food consumers in HCMC restaurants, the author
built a model containing a dependent variable named the decision to choose fast food restaurants and 7 independent
variables which are product, price, restaurant location, customer service, service attitude, space and brand image.
The research method used in this study is qualitative research and quantitative research. Qualitative research was
conducted in the form of interviews with 10 pairs of people, aged 18 to 24, who visited fast food restaurants in Ho Chi Minh
City and based on the established draft scale , conducting a group discussion with the purpose of discovering and
confirming the main factors influencing decision of choosing fast food restaurants in HCMC. Preliminary qualitative
research was conducted after the author had adjusted the scale and implemented in HCMC with a sample size of 50 by
direct interview technique. All 40 observed variables tested in the preliminary study were satisfactory and were used for the
formal study. The official quantitative study yielded a valid sample of 225. Scales were verified by Cronbach's Alpha
reliability coefficient, exploratory factor analysis - EFA, Pearson correlation analysis, and regression analysis. Details are as
follows:
The results from the first Cronbach's Alpha analysis showed that the three variables were excluded: GC 3, TD5 and
HA3 as a result of correlation with total variance of less than 0.3. The second test result, 32 observations of the seven
independent variables from the research model were met (Cronbach's Alpha coefficient ≥ 0.6 and coefficient correlation correction sum ≥ 0.3), which is included in the next EFA analysis.
Through four turns of exploratory factors, three variables are eliminated: GC5, DV5 and HA4. The results of the
fourth EFA showed that 29 consistent observed variables were extracted into seven factors included in the Pearson
correlation analysis and regression analysis.
The regression equation for variables with unstandardized coefficient is:
CD = -0.272 + 0.195 * PRO + 0.191 * SL + 0.500 * PRI + 0.161 * SPA
Results of model tested through correlation analysis and regression indicate the four factors that positively affect
the decision of choosing fast food restaurants in HCMC in order from large to small are: price (β = 0.544), product (β =
0.209), location (β = 0.185) and space (β = 0.161). Hypotheses H1, H2, H3, and H6 are accepted and H4, H5, H7 are rejected.
In addition, the results of testing the difference in the decision to choose a fast food restaurant according to the
individual characteristics of the young showed no difference in the decision to choose fast food restaurants of young people
at Ho Chi Minh City by gender but there was a difference by occupation and income.
Managerial recommendations. Based on the results obtained, the authors give a number of administrative
implications that help businesses in the fast food market have new innovations which are suitable for the needs of young
people in HCMC. Specifically:
Price. Price is the most influential factor in the decision of choosing fast food restaurants in HCMC with
standardized beta of 0.544 and average value of 3.86. In particular, PRI4 and PRI 2 are highly valued (mean values of 3.94
and 3.93 respectively). Consequently, fast food restaurant managers should set pricing policies and products that are
appropriate for their positioning strategy for young, mostly low-income customers. According to Nielsen (2015),
Vietnamese customers are generally sensitive to price changes and prefer to buy promotions. Consequently, promotions and
incentives are not to be missed. For example, managers can take advantage of pricing strategy over time, particularly on
special occasions, holidays, Lunar New Year, or at lunchtime, while still ensuring product quality. In addition, the results of
this study show that young people are more interested in fast food restaurants than at other stores. Because in today's
competitive environment, young people are constantly faced with a wide range of choices, so they have the opportunity to
compare them inevitably.
Table 14: Mean of the Price scale
Variable
Mean
PRI1: I choose to go to fast food restaurants with the same price as other stores
3,63
PRI2: I choose to go to fast food restaurants with the price coming with the quality
3,93
PRI4: I choose to go to a fast food restaurants that are suitable with my income
3,94
Mean of the Price scale
3,86
(Source: Analysis of research data of the authors)
483
Electronic copy available at: />
Herald NAMSCA 4, 2018
Ha Nam Khanh Giao
Product. In spite of the fact that customers only take an average of 3 to 5 minutes to have the dishes that they have
requested but the results of this research prove that young people are still interested in the taste of the dish. This shows the
taste of the food is the appeal to attract young people to visit the store. This result also agrees with Afrin & Ramalingam
(2016). Even today, young people are concerned about food hygiene. In other words, the needs and aspirations of today's
youth for food in restaurants are not only fast, tasty but also clean. Therefore, the problem for businessmen is to provide
food according to a fast processing process, diversifying the menu, constantly bringing special dishes to attract the attention
of the young people who are dynamic and always attracted by the new. If foreign fast food restaurants such as Lotteria,
KFC, McDonald's, etc. are imported into the Vietnamese market with "global thinking, local action", it is necessary for fast
food restaurants to diversify their menu through a combination of available ingredients, changing flavors, and so on to
create new dishes with the taste of youth, and still meeting their needs and desires for fast, delicious and clean dishes.
Vbread's bakery, for example, combines with traditional herbal sauces, which can be used both for vegetarian and nonvegetarian, making it not only convenient but also delicious, clean and distinct. Even convenience stores have succeeded in
updating foods that meet the needs of the vast majority of young people - those with low incomes such as pasta but
incorporating very attractive ingredients as eggs, sausages, fish balls,... or onigiri, spring rolls, ... which are very vietnamese.
Should fast food restaurants provide nutritious food information to young people or create a menu for each day of the week
to increase competitiveness and make a difference? As hygienic factors are highly valued (4.12 vs. 4.02), suggesting that
young people also expect healthier lifestyles, so restaurants offering healthier foods is the way to maintain young customers.
However, the shops have to access raw materials which are strictly tested with strict quality control procedures
such as sources of meat are originated and processed in accordance with food safety procedures, vegetables always carefully
selected and treated with ozone before delivery to the store, the ingredients contain no borax and no preservatives, ... Shop
would certainly create confidence and good impression to customers if there is a display of food hygiene and safety
certificate. In terms of perception, the quality of food is difficult to distinguish, so that young people decide to choose and
use fast food in reputable restaurants is easy to understand. However, it is not that the managers are reluctant, because in
fact there have been many cases of famous foreign brands of fast food such as Lotteria, KFC,... selling poor quality
products, and unsafe food. It may be due to ingredient input that the inspectors objectively failed to detect. But whatever the
cause, the managers of fast food restaurants should be responsible for strict quality control.
Table 15: Mean of the Product scale
Variable
Mean
PRO1: I choose to go to fast food restaurants having good taste
4.24
PRO2: I chose to go to fast food restaurants with hygiene
4.12
PRO3: I choose to go to fast food restaurants with a diverse menu
3.93
PRO4: I chose to go to reputable fast food restaurants
3.87
PRO5: I chose to go to a fast food restaurant with a more special product than other stores’
3.95
Mean of the Product scale
4.02
(Source: Analysis of research data of the authors)
Restaurant location. The results of this study indicate that the restaurant location has a positive impact on the decision of
choosing fast food restaurants in HCMC with a standardized beta of 0.209. This result is similar to that of Zheng (2011). Even Parsa &
Associates (2010) also found that choosing a location to open a restaurant determines the success or failure of the business. Therefore, fast
food restaurant operators should make wise decisions in choosing where to target their target customers. Moreover, to create favorable
conditions for customers to visit, the increase in the number of restaurants is key. In other words, the market penetration strategy - which
sells more current products to existing target customers through expansion of the restaurant network should be applied. It would be
advantageous for fast food restaurants to be located in easy-to-see places, and in the roads where young people travel (Sharkey et al.,
2007). To capture the minds of young people, the restaurants must create attention. As a result, the restaurant is located in a convenient
location, such as close proximity to crowded residential areas, commercial center buildings, where targeted audiences play an important
role in stimulating purchasing behavior of young people. In addition, price enhancements, menus, shop design, etc. can encourage
customers to visit more frequently, stay longer or buy more each time (Kotler & Armstrong, 2014). However, in the eyes of the youth, the
convenience of the parking lot is not appreciated compared to other aspects. It means that their requirement of needing to park a car in
front of the restaurant is acceptable. This is revealed by the mean value of 3.56 .
Table 16: Mean of the Restaurant location scale
Variable
Mean
SL1: I appreciate the fast food restaurants in easy-to-see positions
3.85
SL2: I notice the fast food restaurant chain having a wide network
3.92
SL3: I pay attention to the fast food restaurants that are in convenient positions and easy to go to.
3.90
SL4: I chose to go to the fast food restaurant near my place
3.85
SL5: I choose fast food restaurants with convenient parking
3.56
Mean of the Restaurant location scale
3.81
(Source: Analysis of research data of the authors)
484
Electronic copy available at: />
Herald NAMSCA 4, 2018
Ha Nam Khanh Giao
Space. The results show that space is the fourth most influential factor in the decision to choose fast food
restaurants in HCMC with a standardized beta of 0.161 and an average mean of 3.75. This proves that young people go to
fast food restaurants not only because of the food but they also want to enjoy the space of the restaurant. Therefore, fast
food franchisees should invest in their stores by equipping them with adequate facilities - important factors not only to
improve the quality of serving young people, but it also creates a comfortable, convenient and spacious space which is
suitable for meeting friends, colleagues, ... and increases the ability to attract target customers. In addition, the beautiful
restaurant decoration, eye-catching or impressive design is not appreciated by young people. However, if the fast food
restaurants are eye-catching, consistent between the restaurants in the system, they will create credibility and
professionalism in the eyes of customers, through which also helps promote the brand image of the store.
Table 17: Mean of the Space scale
Variable
Mean
SPA1: I choose to go to the fast food restaurants with beautiful, eye-catching layout.
3.68
SPA2: I choose to go to a fast food restaurants to meet my friends
3.95
SPA3: I choose to go to fast food restaurants with spacious space
3.81
SPA4: I choose to go to fast food restaurants with adequate facilities
4.00
SPA5: I choose to go to the fast food restaurants with impressive design
3.52
Mean of the Space scale
3.75
(Source: Analysis of research data of the authors)
Difference by occupation and income. The results show that the decision to choose fast food restaurants of young people is
different according to income and occupation. Therefore, to design a customer-oriented strategy, the trader needs to answer two important
questions. The first question is: What customer will we serve? This implies which customers we should focus resources on so that we can
serve best and bring the highest return. The second question is: How can we serve the best target customers? For example, this study finds
that the vast majority of young people are students, office workers - those facing financial and time constraints, deciding to choose fast
food to save time to study and work, but this segment of customers is qualified so it is obvious that the price is a key factor but they will
consider choosing fast food restaurants. Therefore, if the trader chooses this group as the target customer, it is necessary to focus on
developing a menu that will provide the right price for the dish, ensuring that the food is made from clean, safe ingredients for the young
people. In addition, this segment of customers is excited with new things so business owners can also customize the menu for the
weekdays. This is also seen as an implication to avoid boredom and keep the guests away.
Limitations of the study and further research direction. Firstly, the research sampling method is non-probability convenient sampling, which is only implemented in some districts in HCMC, so the representativeness is still low, the possibility of
generalization for the crowd is not high. Therefore, the results of the study will be more general if the probability sampling method is
used with a larger sample size, expanding the scope of the study in other provinces and cities in the country. Secondly, the study only
considers the impact on the choice of fast food restaurants of the young people in HCMC on some components, which may also have
other factors that influence the decision to choose the fast food restaurants of young people but are not mentioned in this study. Therefore,
future research should extend the other elements to a more complete model. Thirdly, the subject of the survey chosen by the authors is
young people. The authors has not expanded to study other subjects. This will also be the next research direction.
References
1.
Afrin & Ramalingam, 2016. Perception of the quick service restaurant: An explanatory study. International Journal of Commerce
and Management Research, 2(2), pp. 51-53.
2. Ajzen, I. & Fishbein, M., 1975. Formattion of Intentions. In: Belief, attitude, intention, and behavior : an introduction to theory and
research. Addison-Wesley Pub. Co., pp. 288-334.
3. Ajzen, I., 1991. The Theory of Planned Behaviour. Organizational Behaviour and Human Decision Processes, 50, pp. 179-211.
4. Clever, V. & Felix, C., 2016. Service Factors to the Choice of Fast Food Outlets. Greener Journal of Business and Management
Studies, 6(1), pp. 001-006.
5. Harrington, R. J., Ottenbacher, M. C. & Way, K. A., 2013. QSR Choice: Key Restaurant Attributes and The Role of Gender, Age
and Dining Frequency. Journal of Quality Assurance in Hospitality & Tourism, 4(1), pp. 81-100.
6. Kotler, P. & Armstrong, G., 2014. Principles of Marketing. 15 ed. US: Pearson Education.
7. Mason, K., Jones, S., Benefield, M. & Walton, J., 2013. Quick Service Restaurant Success Factors. Journal of International Business
and Economics, 13(4), pp. 109-114.
8. Nguyen Thi Hong Nhu, 2014. Factors affecting the Decission of Choosing Fast Food Restaurants of Can Tho City Consumers.
Special Issue on Foreign Economics, No. 11, pp. 66-71.
9. Nguyen Dinh Tho, 2014. Business Research Methodology. Hanoii: Labor – Society Publisher.
10. Oni, O. A. & Matiza, T., 2014. Factors Influencing Consumer Choice of Fast Food Outlet: The Case of an American. Mediterranean
Journal of Social Sciences, Volume 5, pp. 802 - 808.
11. Peter, J. P. & Olson, J. C., 2010. Consumer Behaviour & Marketing Strategy, New York: McGraw-Hill/Irwin.
12. Priyadarshini, C. S., 2016. A Study on Consumer Preference on Fast Food Outlets with reference to Coimbatore City. International
Journal of Multidisciplinary Research and Modern Education, 2(1), pp. 243-247.
485
Electronic copy available at: />