Social mood, stock market performance and u s prisidential elections
Bạn đang xem bản rút gọn của tài liệu. Xem và tải ngay bản đầy đủ của tài liệu tại đây (753.57 KB, 42 trang )
Running head: SOCIAL MOOD, STOCK MARKET PERFORMANCE & ELECTIONS
Social Mood, Stock Market Performance and U.S. Presidential Elections:
A Socionomic Perspective on Voting Results
a
Robert R. Prechter, Jr.
Deepak Goel
a
b
Wayne D. Parker
Matthew Lampert
a
a,c
Corresponding authors. Socionomics Institute, 200 Main St. Ste. 350, Gainesville, GA
30501, USA; , ,
b
Emory University School of Medicine, currently on inactive status. 4651 Roswell Road
NE Ste. H-701, Atlanta, GA 30342, USA
c
University of Cambridge; Faculty of Human, Social and Political Science; Department
of Sociology; Free School Lane; Cambridge; CB2 3RQ; United Kingdom.
January 17, 2012
Revised: September 27, 2012
© 2002–2012 Socionomics Institute, Inc.
Electronic
Electroniccopy
copyavailable
availableat:
at: /> />
1
SOCIAL MOOD, STOCK MARKET PERFORMANCE & ELECTIONS
2
Abstract
We analyze all U.S. presidential election bids. We find a positive, significant relationship
between the incumbent’s vote margin and the prior net percentage change in the stock
market. This relationship does not extend to the incumbent’s party when the incumbent
does not run for re-election. We find no significant relationships between the incumbent’s
vote margin and inflation or unemployment. GDP is a significant predictor of the
incumbent’s popular vote margin in simple regression but is rendered insignificant when
combined with the stock market in multiple regression. Hypotheses of economic voting
fail to account for the findings. The results are consistent with socionomic voting theory,
which includes the hypotheses that (1) social mood as reflected by the stock market is a
more powerful regulator of re-election outcomes than economic variables such as GDP,
inflation and unemployment and (2) voters unconsciously credit or blame the leader for
their mood.
Keywords: economic voting; presidential elections; incumbent; social mood;
socionomics
Electronic
Electroniccopy
copyavailable
availableat:
at: /> />
SOCIAL MOOD, STOCK MARKET PERFORMANCE & ELECTIONS
3
Social Mood, Stock Market Performance and U.S. Presidential Elections:
A Socionomic Perspective on Voting Results
Introduction
While many researchers have investigated stock market performance after U.S.
presidential elections, few studies have investigated the connection between elections and
preceding stock market performance. When they have, the data were usually limited to
the election-year performance of the market and only a subset of elections (Biewald,
2003; Chan and Jordan, 2004; Gleisner, 1992). In this paper, we examine the net
percentage change in the stock market in the years preceding all American presidential
re-election bids. For this study, “re-election” is an election featuring an incumbent
president, whether or not he initially obtained office via an election.
We find a significant positive relationship between the stock market’s net
percentage change during the three years prior to a re-election bid and the incumbent’s
popular vote margin percentage. The net percentage change in the stock market for one-,
two- and four-year periods preceding the election are each a weaker yet significant
predictor of re-election outcomes. Our results are robust to multiple variations in the
elements of the testing procedure: measures of the stock market’s performance, measures
of election outcomes, statistical methods used to gauge the relationship between the two,
durations of data, and the presence of additional variables. The relationship does not
extend to the incumbent party’s candidate when the incumbent does not run. We find that
relationships between the incumbent’s popular vote margin percentage and the preceding
net percentage change in gross domestic product, the inflation rate and the unemployment
Electronic copy available at: />
SOCIAL MOOD, STOCK MARKET PERFORMANCE & ELECTIONS
4
rate are often insignificant and always weaker than those between the incumbent’s
popular vote margin and net percentage change in the stock market.
Our results contribute to the literature by elucidating the relative value of stock
indexes for election forecasting models, challenging economic voting hypotheses,
exploring an underlying motivator of financial and political choice, suggesting a strategy
for political party officials and candidates, and offering ideas for future research. At the
theoretical level our findings are consistent with Prechter’s (1979, 1999, 2003)
socionomic theory, which includes the hypotheses that social mood as reflected by the
stock market is a powerful regulator of re-election outcomes and that voters
unconsciously credit or blame the leader for their mood.
Economic Voting
Many political scientists hypothesize that changes in economic variables cause
changes in other social variables such as stock market trends, public mood and voting
results (e.g. Fair, 1996, p.132). A number of researchers have characterized the
relationship between voters and their elected officials in terms of two types of variables:
popularity functions, which are primarily economic factors thought to influence voters’
views toward their leaders positively or negatively (Lewis-Beck and Paldam, 2000;
Mueller, 1970; Nannestad and Paldam, 1994), and reaction functions, which are
government policy-makers’ reactions to their perceived popularity, by which they try to
manipulate economic variables to curry voters’ favor (Alesina, Roubini and Cohen, 1997;
Brender and Drazen, 2005; Fair, 1978; Kramer, 1971). Many authors have combined vote
Electronic copy available at: />
SOCIAL MOOD, STOCK MARKET PERFORMANCE & ELECTIONS
5
functions—factors leading to election outcomes—with popularity functions—factors
leading to poll results—since almost all of the issues overlap (Chappell, 1990; Nannestad
and Paldam, 1994). Political scientists have shown much interest in predicting national
election results using economic variables in such functions. The “big three” popularity
functions traditionally mentioned in the literature are economic growth, inflation and
unemployment (Norpoth, 1996).
Jones (2002) considered many models developed since 1952 that attempt to
predict U.S. elections and concluded that the most effective single predictor of these
election outcomes is the state of the election-year economy. Fair (2002) looked for a
relationship between a number of different economic factors and the percentage of the
popular vote received by the incumbent party’s presidential candidates between 1920 and
1996. He found a strong relationship between the election-year GDP growth and the
percentage of popular votes received. Biewald (2003), however, repeated Fair’s study
with an additional fifty years of data and found that election-year GDP growth is only
weakly correlated with election results.
Nannestad and Paldam (1994) found that studies relating economic growth to
election outcomes yielded inconsistent results, so they discarded GDP as an explanatory
variable and instead emphasized inflation and unemployment. Jones (2002) found some
evidence for a relationship between the election-year inflation rate and the percentage of
popular votes received. Biewald (2003), however, found that with the inclusion of an
additional fifty years of data, the inflation rate was no longer related to election results.
Chrystal and Peel (1986) found that neither inflation nor unemployment was robustly
Electronic copy available at: />
SOCIAL MOOD, STOCK MARKET PERFORMANCE & ELECTIONS
6
related to the popularity of the government.
Fair (1978, 1982, 1988) constructed models for predicting the Democratic Party’s
share of the two-party popular vote based on several factors, including the rate of change
in gross national product for two different durations prior to an election, a time trend
variable coded according to which party was in power, and whether the election involved
an incumbent. One version of this model (Fair, 1988) achieved a strong coefficient of
determination (R2) of 0.89.
To an iteration of Fair’s model, Gleisner (1992) added the percentage change of
the Dow Jones Industrial Average over a ten-month period prior to the election. This
addition significantly improved the fit of the model and rendered Fair’s time trend
variable insignificant. Chan and Jordan (2004) found that the equity market’s
performance for ten months prior to an election was a better predictor than GDP growth
of incumbents’ election results in recent years. Our next section explores a possible
theoretical explanation for these improved results.
Socionomic Voting
Implicit in much of the economic voting literature is the passive organism model
of human action: humans are seen as essentially reactive. Many of the social sciences
have adopted this stimulus-response model of human psychology popularized by
behaviorist psychologists such as Watson (1913) and Skinner (1938) in the last century.
While some scholars (Baars, 1986; Gardner, 1987) have since rejected this model as too
simplistic or inaccurate, it lives on in many implicit assumptions of other social sciences,
Electronic copy available at: />
SOCIAL MOOD, STOCK MARKET PERFORMANCE & ELECTIONS
7
including political science.
Specifically, the conceptualization of popularity and reaction functions carries
with it three assumptions: (a) that there is a reciprocal causal relationship between the
electorate’s opinions of its elected leaders (popularity functions) and the economic policy
responses of those leaders (reaction functions); (b) that voters react to economic
conditions, political events and manipulation so that various economic and policy inputs
have reactive voting outputs; and (c) that voters act consciously and rationally after
logically evaluating candidates’ political policies and deciding whether these policies
have served (under the theory of retrospective voting) or will serve (under the theory of
prospective voting) their best interests.
In contrast, socionomic theory offers competing models of mood, human action
and making choices. Prechter (1999) posited that social mood—the aggregate,
unconscious levels of optimism and pessimism in a society—emerges spontaneously in
self-organizing human social systems, fluctuates according to an internally regulated
growth process described by Elliott’s (1938) wave model, is impervious to economic and
political stimuli, and drives collective human action and non-rational decision-making
unconsciously in contexts of uncertainty. Presidential elections—the focus of our study—
appear to qualify as a context of uncertainty. Delli Carpini and Keeter (1996), Blendon, et
al. (1997), Paldam and Nannestad (2000), and Aidt (2000) have documented
convincingly the typical voter’s pervasive ignorance and uncertainty with respect to
information about elections. Rahn (2000) found that “public mood” may be an important
influence upon political decision-making, concluding that the degree of uncertainty
Electronic copy available at: />
SOCIAL MOOD, STOCK MARKET PERFORMANCE & ELECTIONS
8
accounts for the extent to which mood influences political behavior.
Socionomic theory specifically applies to the re-election or rejection of
incumbents. Prechter (1989, 1999, 2003) hypothesized that when social mood has been
trending towards optimism, voters will be more inclined to desire to keep the incumbent
in office; and when social mood has been trending towards pessimism, voters will be
more inclined to desire a change from the incumbent. Contrasting sharply with Stimson’s
(1991) more cognitive “policy mood” concept, Prechter (1999, 2003) proposed that the
policies of the incumbent and his challenger are irrelevant to this dynamic. He surmised
that voters unconsciously (and erroneously) credit incumbents for their positive moods
and blame incumbents for their negative moods. This explanation appears similar to the
responsibility hypothesis (Downs, 1957; Key, 1966), in which voters blame the
incumbent for consciously perceived, externally produced, negative economic
circumstances. In the socionomic formulation, however, voters blame the incumbent for
unconsciously experienced, internally regulated, negative social mood.
Under socionomic theory, policy statements and actions by leaders are powerless
to affect the mood of the voters; instead, the mood of the voters has a powerful effect on
the policy statements and actions of leaders. Three studies supported this formulation.
Kuklinski and Segura (1995) reviewed literature concerning mood and politics and
reported that mood appeared unresponsive to politicians’ efforts to influence it. They
further argued that Stimson’s policy mood concept “might better be viewed as affective:
when people become dissatisfied and angry, they come to favor less government or at
least a change in the government’s current activities” (p. 13). Nofsinger and Kim (2003)
Electronic copy available at: />
SOCIAL MOOD, STOCK MARKET PERFORMANCE & ELECTIONS
9
found a relationship between the trend of social mood and the subsequent actions of U.S.
lawmakers. They reported that Congress tended to tighten investment restrictions after
social mood had become more negative, as indicated by a substantial decline in stock
prices, and tended to loosen investment restrictions after social mood had become more
positive, as indicated by a substantial rise in stock prices. Geer (2006) reported that,
rather than negative political ads making voters feel more pessimistic, voters’ preexisting attitudes instead affected how candidates chose their advertising. In concert with
these suggestive ideas, socionomic theory explicitly proposes that economic and political
trends are results of social mood, not causes, so the direction of predictive power between
mood and social events is the opposite of that traditionally assumed.
Socionomic theory affirms the active organism model of human action (Overton
and Ennis, 2006; Overton and Reese, 1973): that humans are innately and spontaneously
active in their cognitive, affective and conative processes. Under the socionomic model,
voters do not passively wait for politicians’ policies and promises to program their
responses but rather express social mood spontaneously. Under the hypothesis that
changes in social mood unconsciously impel humans to take social actions expressing
their moods, socionomic theory proposes that changes in indicators of social mood can be
used to anticipate the direction and character of social trends, including those in politics.
Socionomic theory pertains to voting tendencies at the aggregate level. Many
individual voters may, to a degree or for a time, consistently cast ballots along party lines,
religious lines, single-issue lines, philosophical lines or some other overriding factor. We
suspect that “swing” voters with little or no philosophical anchor are among the ones
Electronic copy available at: />
SOCIAL MOOD, STOCK MARKET PERFORMANCE & ELECTIONS
10
acting most readily to express social mood in the voting booth. Regardless of departures
from socionomic motivation at the individual level, social mood under this theory can
powerfully regulate voting outcomes at the aggregate level.
Prechter (1979, 1999; Prechter and Parker 2007) has argued that, for the present,
stock market indexes appear to be the best available indicator of social mood, because
investors can act swiftly in this context to express their optimism and pessimism. Recent
work in the area of online social sentiment analysis by Bollen, Mao and Zeng (2011) and
Gilbert and Karahalios (2010) provided empirical support for the idea that financial
markets are responsive to changes in social sentiment. Because stock market averages
register changes in mood and possess an extensive data history, they are uniquely
appropriate for the long term historical analysis which we undertake in this paper.
Riley and Luksetich (1980) saw the stock market as an indicator of social mood.
They implied, however, that political parties influence mood by shaping the public’s
expectations of future business conditions. Socionomic theory, in contrast, proposes that
social mood—a hidden, independent variable—simultaneously determines both stock
market outcomes and incumbent presidential re-election outcomes. This formulation
avoids the error, as we see it, of confusing the indicator with the cause. Santa-Clara and
Valkanov (2003) ruminated over whether political variables cause fluctuations in stock
returns, or the reverse. According to socionomic theory, neither formulation is correct;
rather, social mood trends regulate stock trends and political trends concurrently.
A popular explanation for why the economy often lags the stock market is that
investors accurately anticipate, months in advance, the economic future and then
Electronic copy available at: />
SOCIAL MOOD, STOCK MARKET PERFORMANCE & ELECTIONS
11
rationally invest on their expectations (Muth, 1961; Sheffrin, 1996). Prechter (2003, pp.
380-384) challenged this idea on both theoretical and empirical grounds. Socionomic
theory proposes instead that macroeconomic indicators, such as rates of economic
growth, inflation and unemployment, respond to social mood to some degree, but they do
so far less immediately, as it takes months on average for business people to carry out
mood-motivated decisions due to the time requirements of meeting, planning, lending or
borrowing, opening or closing facilities, hiring or firing, building or reducing inventory,
and so on. In the aggregate, these delayed results show up as increases or decreases in
production, expansions or contractions of credit, and increases or decreases in the labor
force. Investors, on the other hand, can buy or sell in the stock market almost
immediately in response to social mood, so its effects appear there prior to appearing in
macroeconomic indicators.
Socionomic theory stands in contrast to expectations theory in postulating that
social mood regulates other social variables, including the economy, which is merely
another result rather than the cause. We shall offer evidence that the trend of social mood,
not the trend of the stock market per se, regulates voting with respect to the re-election or
rejection of incumbents.
Socionomic theory (Prechter, 1999, pp. 273-277) made the following predictions
regarding incumbents’ re-election attempts:
1. An increasingly positive social mood, indicated by a rising stock market, will
positively influence an incumbent’s re-election chances.
2. An increasingly negative social mood, indicated by a falling stock market, will
Electronic copy available at: />
SOCIAL MOOD, STOCK MARKET PERFORMANCE & ELECTIONS
12
negatively influence an incumbent’s re-election chances.
3. Extreme changes in social mood, indicated by extreme changes in the stock
market, will tend to motivate more extreme voting preferences for or against the
incumbent.
4. An indicator of social mood, the stock market, will predict the outcomes of reelection bids better than will rates of economic growth, inflation and/or unemployment.
Methods and Results
To investigate these formulations, we first examine the relationship between the
net change in the stock market and the ensuing popular vote margin—the number of
percentage points separating the incumbent from his nearest challenger in the popular
vote—for or against incumbent presidents in U.S. elections. The Dow Jones Industrial
Average serves to represent the U.S. stock market from 1897 to the present. Prior to
1897, we use the Foundation for the Study of Cycles’ data series, which normalizes stock
market data from earlier indexes to the Dow to create a longer series (DJIA) that
encompasses all U.S. presidential elections from 1789 through 2008. Popular vote margin
is a broad measure that is likely to reflect social mood in an election. For purposes of
validation, we also consider four other measures of incumbent performance: percentages
of total popular vote, percentages of total electoral vote, electoral vote margin
percentages, and overall wins and losses of elections.
Next, we examine the relationship between the stock market and the fates of
incumbents in landslide elections. We then relate the stock market to the popular vote
Electronic copy available at: />
SOCIAL MOOD, STOCK MARKET PERFORMANCE & ELECTIONS
13
margin for an incumbent’s political party when the incumbent does not run. A final set of
analyses assesses the predictive ability of the “big three” economic indicators—GDP,
inflation and unemployment—when modeled individually and together with the stock
market.
Predicting Incumbent Election Results
We first compare the popular vote margin for or against an incumbent president
with the stock market’s net percentage gain or loss for the three-year period preceding the
election. We operationally define the three-year period as the span of time from 1
November of the year after the previous election through 31 October of the year of the
election under consideration. We select this period because we observe anecdotally that
society tends to judge a president by the trends that occur during the bulk of the
presidential term, barring much or all of the first year, for which the credit or blame is
typically assigned to the predecessor. Our analysis includes all presidential elections in
which an incumbent candidate ran, beginning in 1824 when popular vote data are first
available. A linear regression analysis yields a large and statistically significant effect, R2
= 0.328, p = 0.001. Table 1 displays results for the test described above (see line three) as
well as further statistical results.
To assess the robustness of the results, we examine a number of variations in
model parameters and analytic approaches. As shown in the table, significant positive
predictive relationships continue to emerge when varying the measuring period for the
stock market to one, two and four years. We also bifurcate the data at two cutoff points:
(a) the turn of the 20th century, and (b) the 100-year anniversary of the inception of
Electronic copy available at: />
SOCIAL MOOD, STOCK MARKET PERFORMANCE & ELECTIONS
14
popular vote tallies, which also roughly corresponds to the midpoint of the data span. The
three-year results maintain across these bifurcated datasets. This consistency is
compatible with socionomic theory, which proposes that social mood’s influence on reelection results should be comparable despite any changes between the 19th and 20th
centuries in terms of campaign strategies, communications technology, election rules,
extent of public participation and so on. To relax distributional assumptions and lessen
the influence of potential outliers, we also apply the nonparametric Spearman’s rank
correlation test to all data conditions, and we obtain similar results, per Table 1.
Electronic copy available at: />
SOCIAL MOOD, STOCK MARKET PERFORMANCE & ELECTIONS
15
Table 1. Incumbent's Popular Vote Margin and Prior Net Stock Market Movement: Linear Regression and Linear Rank Regression
Study Perioda
Prior Net Stock
Market Movement
Periodb
N
B
SE
β
p
R2
1824 – 2004
Prior 1 yr
26
0.276
0.122
0.361
0.035**
0.130
0.264
0.096*
1824 – 2004
Prior 2 yrs
26
0.145
0.121
0.378
0.028**
0.143
0.314
0.059*
1824 – 2004
Prior 3 yrs
26
0.195
0.107
0.573
0.001***
0.328
0.592
7E-4***
1824 – 2004
Prior 4 yrs
26
0.133
0.113
0.506
0.004***
0.256
0.431
0.014**
1824 – 1900
Prior 3 yrs
8
0.210
0.081
0.665
0.036**
0.442
0.905
0.001***
1901 – 2004
Prior 3 yrs
18
0.188
0.120
0.549
0.009***
0.302
0.494
0.019**
1824 – 1924
Prior 3 yrs
12
0.168
0.124
0.436
0.078*
0.190
0.629
0.014**
1925 – 2004
Prior 3 yrs
14
0.210
0.098
0.681
0.004***
0.464
0.569
0.017**
p
Note. The above table reports the results of linear regression and linear rank regression analysis. The condition of primary theoretical
interest is in bold font. N = the number of elections meeting the specified criteria. One-tailed probability values are presented in
accordance with the theorized directional hypothesis; asterisks indicate statistically significant values: *significant at the 0.10 level,
**significant at the 0.05 level and ***significant at the 0.01 level.
a
Popular vote tallies first became available in 1824; the most recent year in which an incumbent ran for re-election was 2004.
b
As measured by the Dow Jones Industrial Average and normalized predecessor averages (DJIA).
Electronic copy available at: />
SOCIAL MOOD, STOCK MARKET PERFORMANCE & ELECTIONS
16
As a final test of robustness, we repeat the entire analysis, substituting four other
measures of election results in place of popular vote margin. Bivariate linear regression
models for three of these indicators—percentage of total popular vote that the incumbent
receives, percentage of total electoral vote that the incumbent receives, and electoral vote
margin (the number of percentage points that separate the incumbent from his nearest
challenger in the electoral vote)—produce similar results to those presented in Table 1.
Evaluating the fourth measure, the incumbent’s overall success or failure in winning the
re-election bid, requires use of logistic regression. Although this dichotomous variable
suffers from a reduction in reliable score variance in comparison to the continuouslyscaled criterion variables considered earlier, positive predictive relationships generally
emerge, with a statistically significant (p = 0.022) logistic regression coefficient
associated with the condition of primary theoretical interest (see Table 2).
Electronic copy available at: />
SOCIAL MOOD, STOCK MARKET PERFORMANCE & ELECTIONS
17
Table 2. Incumbent's Re-Election Success and Prior Net Stock Market Movement
Study Perioda
Prior Net Stock
Market Movement
Periodb
N
Β
SE
p
OR
1824 - 2004
Prior 1 yr
26
1.120
2.501
0.327
3.1
1824 - 2004
Prior 2 yrs
26
3.030
1.928
0.058*
20.8
1824 - 2004
Prior 3 yrs
26
7.370
3.640
0.022**
1581.5
1824 - 2004
Prior 4 yrs
26
2.920
1.562
0.031**
18.6
1824 - 1900
Prior 3 yrs
8
NAc
--
--
--
1901 - 2004
Prior 3 yrs
18
5.450
3.682
0.070*
232.1
1824 - 1924
Prior 3 yrs
12
10.600
6.383
0.049**
39129.0
1925 - 2004
Prior 3 yrs
14
4.740
3.692
0.100
114.5
Note. The above table reports the results of logistic regression analysis. The condition of primary theoretical interest is in
bold font. N = the number of elections meeting the specified criteria. One-tailed probability values are presented in
accordance with the theorized directional hypothesis; asterisks indicate statistically significant values: *significant at the
0.10 level, **significant at the 0.05 level and ***significant at the 0.01 level.
a
The most recent year in which an incumbent ran for re-election was 2004.
b
As measured by the Dow Jones Industrial Average and normalized predecessor averages (DJIA).
c
Unable to interpret results due to small sample size.
Electronic copy available at: />
SOCIAL MOOD, STOCK MARKET PERFORMANCE & ELECTIONS
18
To summarize, our results signify that a net gain in the stock market during the
three years preceding an election is strongly predictive of more votes cast for the
incumbent relative to his nearest challenger, and a net stock market decline during that
period is strongly predictive of fewer votes cast for the incumbent relative to his nearest
challenger. More generally, net stock market changes for one-, two-, three- and four-year
periods preceding Election Day all serve as significant predictors of election outcomes.
Incumbent Wins/Losses in Landslides
Socionomic theory proposes that more extreme changes in social mood tend to
motivate more extreme voting preferences for or against the leader. We test this
hypothesis with regard to re-election bids by examining the relationship between prior net
percentage change in the stock market and incumbent vote margin when both are large.
We look first at landslide victories as measured by electoral vote margins.
Records of electoral votes extend farther back in time than popular vote tallies and thus
provide more data points to test. To define extreme conditions operationally, we deem an
election a landslide victory if the incumbent competed for and won re-election by
defeating the nearest competitor with an electoral vote margin of 40% or greater. We
deem the election a landslide loss if the incumbent running for re-election trailed the
winner by an electoral vote margin of 20% or greater. We define a large positive stock
market change as a net gain of 20% or more in the preceding three-year period, and a
large negative stock market change as a net loss of 10% or more. We choose asymmetric
percentage thresholds for electoral vote margin and net stock market change (i.e., {+40%,
-20%} and {+20%, -10%}, respectively) to be consistent with the a priori positive biases
Electronic copy available at: />
SOCIAL MOOD, STOCK MARKET PERFORMANCE & ELECTIONS
19
in both data series: Historically, an incumbent has a better than 50% chance of reelection, and the stock market tends to have a positive trend.
We summarize all historical data meeting these criteria in a contingency table
(Table 3). Fisher’s exact test indicates a high degree of association between the two
variables (p = 0.009). Although only 15 elections meet the criteria for analysis, we can
have confidence that the observed association is unlikely to have arisen due to chance in
view of the exceptional predictive accuracy associated with these data (i.e., a 93%
classification rate). Results as good or better would occur less frequently than 1 time in
100 if there is, in fact, no relationship between the variables in the theoretical population.
Electronic copy available at: />
SOCIAL MOOD, STOCK MARKET PERFORMANCE & ELECTIONS
20
Table 3. Large Net Stock Market Movements and Electoral Landslides
Direction of Prior Stock
Market Movementa
Incumbent Election
Resultb
Large
Positive
Large
Negative
Fisher's Exact
Test (p)
In Percentage Change:c
Landslide Victory
11 (73.3%)
0 (0%)
Landslide Loss
1 (6.7%)
3 (20.0%)
0.009***
In Lognormal Transform:d
Landslide Victory
9 (75.0%)
0 (0%)
Landslide Loss
0 (0%)
3 (25.0%)
0.005***
Note. Each data point represents an election result that met the specified criteria. Data from 17922004. The most recent year in which an incumbent ran for re-election was 2004; that election did
not yield a landslide result. Asterisks indicate statistically significant values: *significant at the 0.10
level, **significant at the 0.05 level and ***significant at the 0.01 level.
a
As measured over a three-year period by the Dow Jones Industrial Average and normalized
predecessor averages (DJIA).
b
Landslide victory defined as ≥ 40% electoral vote margin; landslide loss defined as ≤ -20%
electoral vote margin.
c
Large net positive change defined as price rise of ≥ 20% in prior 3 years; large net negative
change defined as price fall of ≥ 10% in prior 3 years.
d
Large net positive change defined as log(price) rise of ≥ 0.2 in prior 3 years; large net negative
change move defined as log(price) fall of ≥ 0.1 in prior 3 years.
Electronic copy available at: />
SOCIAL MOOD, STOCK MARKET PERFORMANCE & ELECTIONS
21
The strong relationship between landslide elections and stock price movements is
robust across a number of variations in the parameter definitions, scaling, and indicators
in the model, including the following:
the computation method used to define net stock market movement (i.e., whether
considering percentage changes or lognormal changes);
the stock market indicator (i.e., whether using the DJIA or an inflation-adjusted
DJIA obtained by dividing the DJIA by the Producer Price Index);
the election result indicator (i.e., whether using electoral vote margin or popular
vote margin);
the electoral thresholds that define an election as a landslide (e.g. +20%, -10%;
+50%, -50%);
the thresholds that define a large net stock market change (e.g. +20%, -10%;
+10%, -5%);
the number of years used to calculate net changes in the stock market (i.e., 1, 2, 3
and 4); and
various combinations of all of the above.
We illustrate several examples of these comparative analyses below.
We find that the predictive success rate when using electoral vote thresholds of
{+40%, –20%} and the inflation-adjusted DJIA with stock market thresholds of {+10%,
–5%} is 82% (14 out of 17 correct classifications, p = 0.03). Similarly, we find that the
predictive success rate when using electoral vote thresholds of {+20%, –10%} and the
nominal DJIA with stock market thresholds of {+20%, –10%} to be 94% (15 out of 16, p
= 0.007). We also test preceding four-year stock market thresholds in the nominal DJIA
Electronic copy available at: />
SOCIAL MOOD, STOCK MARKET PERFORMANCE & ELECTIONS
22
of {+0%, –0%}, thereby relaxing the requirement that the movements be large, and
electoral vote thresholds of {+40%, –20%}. We obtain a predictive success rate of 83%
(19 out of 23, p = 0.02).
With regard to alternative definitions of election results, a large electoral vote
advantage can sometimes occur in tandem with only a small popular vote advantage
because of the nature of the Electoral College. Consequently, we analyze popular vote
landslides as a further means of testing the relationship under consideration. Because
popular vote margins are associated with fewer data points and tend to fall within a
tighter percentage range, we use smaller thresholds for popular vote margins {+10%, –
5%} and three-year percentage stock market changes in the nominal DJIA {+10%, –5%}.
Even under these conditions, the data produce a predictive success rate of 87% (13 out of
15, p = 0.01). In additional analyses, subjecting the popular vote margin data to the many
conditional and definitional variations described above do not diminish this strong
relationship. For example, using popular vote-margin thresholds of {+10%, –10%} and
three-year stock market thresholds of {+0%, –0%} in the nominal DJIA, we obtain a
predictive success rate of 92% (12 out of 13, p = 0.01).
As a final test of robustness, we combine the preceding methodologies and define
a landslide election victory as one in which the victor wins by a large margin in either the
popular vote (when data are available) or the electoral vote. This is also a somewhat more
intuitive definition of what might qualify as a landslide victory. Using the same
thresholds as before for electoral vote margin {+40%, –20%}, popular vote margin
{+10%, –5%}, and stock market lognormal change {+0.2, –0.1}, we obtain a perfect
classification rate (12 out of 12, p = 0.005). Again, the results are robust to the many
Electronic copy available at: />
SOCIAL MOOD, STOCK MARKET PERFORMANCE & ELECTIONS
23
variations we consider. For example, using thresholds of {+50%, –50%} for electoral
vote margin, {+20%, –10%} for popular vote margin, and {+0.1, –0.05} for stock market
lognormal change results in a 94% predictive success rate (15 out of 16, p = 0.007).
Observing confirmatory findings in response to numerous methodological and
analytical variations allows us to conclude with a high degree of confidence that large
stock market advances tend to be strongly associated with subsequent landslide victories
as opposed to landslide defeats for incumbent candidates in re-election bids. Conversely,
large stock market declines tend to be strongly associated with subsequent landslide
defeats as opposed to landslide victories for incumbents. The stock market movements
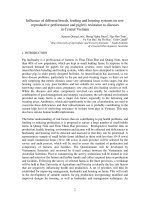
and election results shown in Figure 1 illustrate this association visually.
Figure 1 also includes some events that are outside the boundaries of our
restrictive statistical tests. We add them to give readers a flavor of the power of
extremities in social mood to influence the tenure of leaders. Examples are King George
III’s ousting as ruler of the American colonies in the late 1700s near the end of a 64-year
bear market in English stocks, the regional rejection from ballots of many candidates in
1860 following a 24-year period of lower stock prices, and Richard Nixon’s resignation
in 1974 during the biggest stock market decline in 36 years.
Electronic copy available at: />
SOCIAL MOOD, STOCK MARKET PERFORMANCE & ELECTIONS
Figure 1. Landslide Elections and the DJIA
Note. Landslide victory defined as ≥ 40% electoral vote margin or ≥ 10% popular vote
margin; landslide loss defined as ≤ -20% electoral vote margin or ≤ -5% popular vote
margin. Stock data are from 1760 to 2004. The most recent year in which an incumbent
ran for re-election was 2004; that election did not yield a landslide result.
Electronic copy available at: />
24
SOCIAL MOOD, STOCK MARKET PERFORMANCE & ELECTIONS
25
Predicting Election Results for an Incumbent’s Political Party
We next investigate whether the relationship between net stock market change
and popular vote margin extends to a president's political party when the president is not
running for re-election. As shown in the linear regression results in Table 4, we find no
association between the three-year net percentage change in the nominal DJIA and the
popular vote margin for a non-running incumbent’s political party. We are inclined to
hypothesize that voters project their moods upon individual leaders, not parties.
Electronic copy available at: />