The effect of stock spam on finacial markets working paper
Bạn đang xem bản rút gọn của tài liệu. Xem và tải ngay bản đầy đủ của tài liệu tại đây (400.82 KB, 24 trang )
The Effect of Stock Spam on Financial Markets
WORKING PAPER
Rainer Bă
ohme1 and Thorsten Holz2
1
2
Institute for System Architecture, Technische Universită
at Dresden
Laboratory for Dependable Distributed Systems, University of Mannheim
Abstract. Spam messages are ubiquitous and extensive interdisciplinary
research has tried to come up with effective countermeasures. However,
little is known about the response to unsolicited e-mail, partly because
spammers do not disclose sales figures. This paper correlates incoming
spam messages that promote the investment in particular equity securities with financial market data. We use multivariate regression models
to measure the impact of stock spam on traded volume and conduct an
event study to find effects on market valuation. In both cases we have
found evidence for significant reactions to spam campaigns in the short
run. Theoretical and practical implications of the findings are addressed.
Keywords: Stock Spam, Event Study, OTC, Unsolicited Bulk E-Mail,
Economics of Information Security
[JEL G14, D84, M30, C88]
1
Introduction
Unsolicited bulk e-mails (UBE) are messages sent blindly to a very large number
of recipients. This phenomenon commonly known as spam is increasingly causing
problems in communication networks and undermines the usefulness of e-mail as
communication medium. Spammers, the individuals who send UBE, often work
in secrecy. Therefore little is known about their proceeding, and almost nothing
about their success in terms of response pattern and rates.
Spam is an annoying problem for both business and private users of e-mail.
A recent study reports that almost 70 % of all e-mail messages received by an average Internet user are spam messages [1]. In typical spam messages, the sender
advertises goods and services, e.g., pharmaceutical products, mortgages, or access to certain websites. Besides being an annoyance, this flooding with unsolicited e-mail messages is also an information security problem. It is comparable
to Distributed Denial-of-Service (DDoS) attacks that let computer systems or
entire networks fail to deliver the intended functions by overloading it with a high
number of unnecessary service requests. There exist no effective countermeasures
against this sort of attack. The losses caused by spam are also economically significant. The economic costs associated with spam can be broadly separated into
three classes, namely waste of bandwidth, waste of storage capacity, and waste
of human (employees’) time to sort out unsolicited messages [2].
Revision 0.5: Workshop on the Economics of Information Security (WEIS)
Univ. of Cambridge, UK, June 2006
In this paper, we try to shed some light into the question whether and how
recipients react to spam messages. We do this by regarding a specific form of
spam, namely stock spam that advertises equity securities traded on over-thecounter (OTC) markets. This allows us to correlate spam arrival from a number
of probe e-mail accounts with publicly available market data and thus draw
inference on the effectiveness of UBE.
The paper is structured as follows: In Section 2, we briefly review prior art on
the economic reasons for the spam problem, possible countermeasures, as well as
empirical work related to our contribution. Section 3 analyzes the effect of stock
spam on the stock market. We use multivariate regression models to assess the
impact of stock spam on traded volume and an event study method to measure
the influence of stock spam on market price developments. We conclude the
paper with a discussion on the limitations of our approach and directions for
future work (Section 4).
2
Background and Related Work
Spam has a track record in the literature of many areas. Network security mainly
studies how spammers operate by taking over hundreds of badly maintained computers to use their bandwidth [3]. Scholars in computer-linguistics and machine
learning deal with the construction of efficient filter algorithms [4]. And social
scientists try to understand the motivations of spammers and conceive appropriate policy measures to tackle the problem from a legal and economic side. Here
we review only the latter aspects in more detail.
2.1
Economics of Spam and Countermeasures
It has been argued many times that spam is largely a problem of economic
incentives [5, 2]. The extraordinary small costs per offer placement make it the
preferred medium for advertising products on the “long tail” of the demand
curve, which cannot be efficiently promoted with traditional means of advertising
(see Table 1). As the cost per contact is so low, spammers do not bother about
targeted distribution and already very tiny response rates let the business model
break even. The resulting inefficiencies due to information overflow have been
studied both in formal economic models [6] and in laboratory experiments [7].
Besides technical solutions using filter mechanisms and laws for litigation and
deterrence, it has been suggested that increasing the cost of sending a message
would solve the problem at its roots. In the absence of a suitable micro-payment
system and due to the differences in income among Internet users, Dwork and
Noar [9, 10] first suggested in 1992 to use computing cycles as a unit of account.
In the so-called “proof-of-work” schemes, the sender of an e-mail must enclose
the solution of a unique and computational hard problem, which is verified at
the recipient’s mail server before delivery. For legitimate use of e-mail, this computation should not result in unacceptable delay. However, spammers would
not be able to send bulk messages since their (finite) computing resources are
2
Table 1. Cost of offer placement for common approaches
Direct mail
Telemarketing
Print - targeted
Print - general
Fax
Online ads
Spam
Total cost Number of recipients
$ 9,700
7,000
$ 160
240
$ 7,500
100,000
$ 30,000
442,000
$ 30
600
$ 35
1,000
$ 250
500,000
Cost per recipient
$ 1.39
$ 0.66
$ 0.075
$ 0.067
$ 0.05
$ 0.035
$ 0.0005
Source: [8]
constrained. One possibility to construct such hard-to-solve but easy-to-verify
problems uses hash functions and is therefore known as hashcash [11]. Laurie
and Clayton [12] criticize these proposals for two reasons. First, the additional
problem-solving burden would also affect legitimate users to a non-negligble extent. Second, spammers access insecure end-user machines to steal processing
cycles and solve puzzles. Instead they suggest using CAPTCHAs [13], a class
of proof-of-work puzzles that requires human interaction, which is presumably
more difficult to “steal”. Other approaches target in similar directions, such as
Loder et al. [6], who propose a scheme in which the recipient of a message can
decide whether or not to charge the sender, and Fahlman [14], who suggests
making attention to a tradable good by allocating “interrupt rights”. It is up to
see in the future whether such schemes can result in socially optimal outcomes.
2.2
The Stock Spam Business Model
The general proceeding of spammers and the underlying business model is simple. Spammers act rationally and try to maximize their (risk-adjusted) expected
profit, similar to all other types of economic agents. In contrast to other sorts
of sales spam, stock spammers do not directly offer a product or service. They
rather speculate on positive price developments of thinly traded stocks after they
have been hyped in thousands of messages sent to possible investors. The content
of such spam messages often pretends to be a misdirected investment advice, enriched with financial terms and recent price quotes. Especially in low liquidity
markets with few information coverage, the mere attention of a particular stock
may stimulate an investment decision [15]. If one believes that many people follow such dubious “investment advices” then jumping on the bandwagon is not
irrational, since virtually everybody could profit from speculative gains in the
resulting bubble. The persistence of such spam, as well as the results presented
below, let us conclude that this pump-and-dump strategy actually works.
It might even work so well that “e-mail marketing” of stocks is openly offered
on the Internet. For example, Expedite [16] claims that
“[...] e-mail marketing .com is a full service OTC Pink Sheet Stocks e-mail marketing company that can e-mail out your OTC stocks newsletter to the masses.
[...] With our stable and reliable network and bandwidth, we can service any
size of OTC Pink Sheet stock awareness campaign.”
Our analysis below will show how the masses react . . .
3
2.3
Stock Spam Watchers
Stock spam has been discussed so far on a number of blogs, and some websites
collect information on stock spam information. Cyr runs a Spam Stock Tracker
[17] since March 2005, where he keeps track of the performance of securities
that have been advertised in spam messages. For each unique stock, he adds
1,000 shares to a fictive portfolio. As of March 15th, 2006, he (virtually) suffered
a net loss of US$ 27,827 bar transaction costs. This shows that the long-term
performance of advertised stocks has been negative on average. In contrast to this
long-term analysis, Richardson’s Stock Spam Effectiveness Monitor [18] provides
a graphical summary of the intra-day development of advertised stocks. Finally,
the web source [19] lists an (incomplete) collection of affected firms together with
example messages, and McIntyre [20] requests and collects comments from firms
that were cited in stock spam messages. Hence, to the best of our knowledge,
this paper seems to be the first academic study dealing with stock spam.
2.4
Related Event Studies
Later in this paper we will use the event study methodology to empirically measure the influence of stock spam dissemination on the market price development
of the affected stocks. This method is a standard approach that has been applied
to numerous research questions in finance and economics [21]. The method is also
not novel in the context of computer security. Several authors have investigated
the impact of public security incident reports on the stock market valuation
of affected firms [22–24] and software vendors [25]. All studies consistently report a negative and significant market impact. The event study methodology
has also been applied in analyses of “serious” investment advice (unlike stock
spam), however with varying results. In [26] the independent variable is constructed from recommendations of financial analysts, whereas the authors of
[27] use recommendations printed in the mass media as predictor for stock price
development. We are not aware of a paper that discusses particularities of the
event study methodology for small- and micro-caps, the type of stocks we regard
in our analysis.
3
Stock Market Impact of Unsolicited E-Mail
The empirical work described in this section is the core of our contribution. We
start with a presentation of the data source (3.1), then continue with descriptive
analyses of stock spam activity (3.2) before we analyze the impact of stock spam
arrival on traded volume (3.3) and market valuation (3.4). As the methodology
differs between variables of interest, we discuss it in the respective sections.
3.1
Data Acquisition
Our empirical study is based on the following data sources. The spam events
were downloaded from Richardson’s Stock Spam Effectiveness Monitor (SSEM)
4
archive [18]. The data comprises 21,935 stock spam messages between November 2004 and February 2006. The messages were extracted automatically from
a number of spam collecting e-mail addresses. On average, 3 % of all incoming
messages were classified as stock spam [18]. The corpus of spam messages cites
391 unique stocks, which corresponds to about 5 % of all stocks listed on the relevant OTC markets: 68 % of the stocks in our sample are listed on the National
Quotation Bureau’s (NBC) Pink Sheets, a financial services company distributing real-time price information on over-the-counter transactions of penny stocks.
The remaining part refers to stocks quoted on the OTC bulletin board (OTCBB),
a similar entity for public firms that fulfill some financial reporting requirements
but still do not meet the rigorous listing standards of the major U. S. exchanges
[28]. We believe that stock spam exclusively targets small- and micro-cap securities (so-called penny stocks) because the spammers bargain for a positive market
impact due to their activity. Market impact, i.e., the reaction of the market price
on individual orders, is generally higher for low liquidity securities. To assess the
validity of this data source we compared some of the stock spam messages in
the authors’ personal e-mail accounts to SSEM data and found a relatively good
correspondence with respect to the stocks cited on specific days.1
Daily price quotes for the affected tickers2 were downloaded from Yahoo
Finance [29]. Unfortunately, no historical data was available for a number of
tickers. Therefore the usable data set was reduced to 111 (28.4 %) tickers and
7606 (34.7 %) relevant spam messages. There is no obvious reason to suspect that
this selection systematically affects the results due to a coverage error between
the stocks where data is available in Yahoo Finance and those where it is not.
Future research can improve validity by acquiring more complete financial data.
To assess the contribution of a market model in the event study [21], we
selected three daily market indices: Standard & Poor’s 500 and NASDAQ Composite were both obtained from Yahoo Finance. They are very common indicators
for general stock market performance in the U. S., but both are computed from
high liquid securities only. Therefore we decided to include Russell’s daily microcap index as well. Its historical data (until December 2005) has been downloaded
directly from the data provider’s website [30].
3.2
Descriptive Data Analysis
Aggregating the SSME data allows to construct a good indicator for stock spam
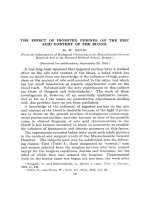
activity over time. The solid line in Figure 1 displays a smoothed time series of
the total number of stock spam messages received on the collecting addresses.
The absolute figure is not particularly informative since it depends on the number
of probe accounts. However, it is reasonable to assume that the total number
of spam messages distributed varies proportional to this indicator. Note that
November 2004 and February 2006 are not completely represented in the data,
so that mainly the course of 2005 should be regarded as core period of interest.
1
2
We never experienced identical messages as spammers apparently vary message subjects and pretended sender names systematically to elude simple spam filters.
A ticker symbol is a unique identifier for traded stocks.
5
Stock Spam Activity
2005
Intensity (30 days MA, scaled)
2004
2006
Stock spam messages received (avg.=45.2, max.=368)
Unique tickers cited per day (avg.=4.4, max.=14)
Cumulative number of tickers cited (max.=391)
N
D
J
F
M
A
M
J
J
2004
2005
A
S
O
N
D
J
F
2006
Time
Fig. 1. Time series of total stock spam messages in the data set (n = 21, 935). Joint
graph of a) 30-day moving average of daily message arrivals (solid line), b) 30-day
moving average number of different tickers cited in one day’s total spam (dashed line),
and c) cumulative number of affected companies over time (dotted line). All series
are scaled to a unit interval. Only a small subset of these events is included in the
multivariate analysis.
We are not aware of examples where more than one ticker is mentioned
per spam message, but for the majority of days the data contains references to
a number of different tickers in separate messages. Therefore the dashed line
shows the development of the number of unique ticker symbols being cited in
the total stock spam of each day. It would be too far-fetched to interpret this
as a sign of competition between spammers, but it is also difficult to imagine
how this “diversity” could be planned to support one single spammer’s strategy.
Imagine it were a sign of competition, then we could interpret the dynamics
between number of unique tickets and the number of messages as a decline in
competition from August 2005 onwards. In other words, spammers concentrate
again on fewer tickers per day after they drove the number up to 14 in August
2005 (here the absolute numbers make sense if we believe that the data does not
systematically miss large parts of stock spam traffic).
The dotted line in Figure 1 shows the cumulative number of tickers being
cited in stock spam from the beginning of the data set. It tells us that constantly
new firms become victims of stock spammers. At the same time, some stocks
remain targets of spam attacks for quite a long time and thus accumulate an
impressive number of messages distributed over up to 77 event days. See Tables
6 and 7 in the appendix for a ranking of the most seriously hit tickers by number
of events and total messages, respectively.
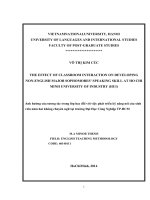
Figure 2 breaks the message arrival further down by weekdays and daytime.
It is clearly visible that the large majority of messages arrives on working days,
6
Stock Spam by Weekday
Stock Spam by Daytime
25
6
5
Arrival rate (in %)
Arrival rate (in %)
20
15
10
5
4
3
2
1
0
0
Sun
Mon
Tue Wed Thu
Fri
Sat
0
Day
(business days are shaded)
2
4
6
8
11
14
17
20
23
Hour
(stock market business hours are shaded)
Fig. 2. Distribution of stock spam message arrivals across weekdays (left) and the
course of a day (right, U. S. eastern time). Spamers apparently avoid weekends but do
not bother a lot about market hours. In the analysis, messages received after the close
of the market are counted as events on the following business day (effective day).
although Sunday afternoon arrivals (after 4:00 p.m.) were already counted to
the Monday numbers. This is due to the processing logic that assigns message
arrivals to business days, which is automatically performed at the data collection
stage: as the Pink Sheets and OTCBB follow regular market hours, from 9:30
a.m. to 4:00 p.m. US eastern time [31], all messages received after the market had
been closed were moved to the next business day. Therefore the effective day in
our study does not necessarily match the actual calendar day of message arrival.
In case of weekends and business holidays, we additionally shift the effective
arrival time by 24 hours (but not more than three times in a row).
Unless otherwise stated, we will further use the term event to express the
arrival of one or more messages citing a particular ticker on a specific (effective)
day. By contrast, we use the term quantity in those parts of the analysis where the
actual number of messages per day citing the same stock is a relevant measure.
3.3
Effects on Traded Volume
If stock spam actually has an influence on the markets then it should most easily
be seen in the trading activity. Stock spammers exclusively target penny stocks,
presumably because the market impact of individual transactions is particularly
high for securities with low liquidity. In most cases, the liquidity is so low that
there are business days where a penny stock is not traded at all. Therefore, the
simplest way to test the impact of stock spam is a cross-tabulation of trade activity and spam arrival, as shown in Table 2. In fact, we see a positive relationship
which is also statistically significant using Pearson’s χ2 statistic for contingency
tables.
Though its message is very clear, this test is certainly too simple to provide
sound evidence for a positive relationship, because a number of possible third
7
Table 2. Effect of spam arrival on trade activity (per business day)
Trade volume
=0
>0
Stock spam received
No
Yes
15.8 %
2.7 %
84.2 %
97.3 %
100.0 %
100.0 %
(n = 32261)
(n = 547)
2
χ (1) = 68.5, p < 0.001
variables are not controlled for. Hence, we turn away from the binary response
case (trade / no trade) to a quantitative evaluation of the impact of spam arrival
on the traded volume. The graphs in Figure 3 visualize the differences in average
volume per stock on a linear (left) and log (right) scale. All 111 stocks in the
sample are sorted by their average volume at normal days. The large range of
average volumes illustrates the heterogeneous composition of our sample.
Form visual inspection one might already assume a tiny positive influence of
stock spam in both graphs. Multivariate regression models are the right tool to
quantify this relationship and test the hypothesis on data. Due to the varying
daily turnover between stocks, we opt for a multiplicative model formulation,
where the average volume on days with spam arrival can be expressed as a
product of the individual stock’s average volume on normal days times a “spam
impact factor” α. As a result, however, we have to exclude cases without trade
since any volume increment above zero would result in infinitely high factors α
and thus render the regression problem intractable or yield misleading results as
artifacts of possible correction measures (such as replacing zeros by very small
nonzero values). This is our baseline model M1:
vt,i = v0 · eζi · w(t) · β0λt · αδ1 (xt,i )
(1)
In our notation, vt,i is the (strictly positive) trade volume of stock i at day t.
v0 is the average volume, and ζi is a stock-specific scaling factor for the overall
volume, where we assume ζi ∼ N (0, σζ2 ). ζi actually models the heterogeneity
between stocks.3 To control for possible influences of time, we include w(t) , a
vector of four coefficients to capture variations in volume between days of the
week, and λt , a rational scaled time variable ranging between 0 and 1 from the
first day to the last day of the sample period (478 days in total). Function δ1 (·)
converts the absolute number of spam messages xt,i received at day t and citing
3
Readers who deem the normality assumption in the random-effects model as too
strong should note that we have tested alternative models with 111 fixed effects, one
per stock. The estimates for log(α) tallied up to 2 digits behind the decimal point.
8
Comparison of Volume: Linear Scale
Comparison of Volume: Log Scale
●
● ●
Average volume ...
●
●
6
●
− on normal days
− on event days (if neg.)
− on event days (if pos.)
●
●
●
1.0
●
0.5
0.0
●
●
●
1.5
●●
●
●
5
●
●
●
●●
●
4
●
●
●
●
●
●
●●
●
●
●
●
●
●
●
● ●●
● ●●
● ●
●
●
●● ●
●
●●●
● ●
●●
●● ●
●
●
●
●
●●● ●●●●●●● ●
●● ●● ● ●●●●● ●
●
●
●
● ● ● ●
●
●
●●●●●●● ●●●●●●●● ●●
●●
●
●
●
●
●
●
●
●
●
Average volume ...
3
●
●
●
●
●● ●
●
●
● ● ●● ●
●
● ●●
● ●
●
●● ●
●
●●●
●
●●
●● ●
●
●
●
●
●
●
●●
●●
●●●
●
● ● ●
●
●
●●
●
● ●
●
log10 of volume
Volume (in millions)
2.0
●
●
●
●
●
●
●
2
− on normal days
− on event days (if neg.)
− on event days (if pos.)
●
0
20
40
60
80
100
0
20
Case Index [stocks]
(ordered by avg. volume)
40
60
80
100
Case Index [stocks]
(ordered by avg. volume)
Fig. 3. Visual analysis of average daily trading volume per stock on normal days
(smooth line with cross markers) and event days with at least one stock spam message
received (buzzing points) both on linear (left) and log (right) scale. Differences are
plotted as dashed lines.
stock i to a binary dummy variable:
δ1 (x) =
1 if x > 0
0 otherwise
(2)
Log-linearization of Eq. 1 yields a linear regression model with random effects
term that can be fitted to data using restricted log-likelihood maximization
(REML) to estimate the spam impact on volume as parameter α [32].
log vt,i = log v0 + ζi + log w(t) + log β0 · λt + log α · δ1 (xt,i ) +
t,i
(3)
The estimated coefficients are reported in column M1 of Table 8 in the appendix.
As log(α) is positive and highly significant, we found evidence for the presence
of a relationship between spam events and the amount of stocks traded. As
to the controls, there is only negligible influence from weekdays (all w(t) do not
significantly differ from zero) and we capture a positive linear trend in the traded
volume of our sample of stocks (β0 > 0), which might be a concomitant of the
upswing position in the business cycle.
The actual value of α allows us to compute the average change in volume of
a stock on days with message arrival compared to normal days, where the ticker
has not been cited in stock spam. As displayed in Table 3, the impact is quite
high: spam events make volume more than triple.
However, this relationship does not yet support the conclusion that the additional volume is actually caused by the recipients of stock spam messages. It
is also possible that the senders commit large parts of the transactions through
buying stocks before spamming and selling (at a higher price if the business
work) after the market has reacted. Moreover, the relationship could also stem
from an inverse causality, namely when the spammer pursues a strategy to select
9
Table 3. Effect of spam arrival on trading volume
Avg. volume
95 %
reaction on
confidence
No. of
Model
spam event
interval
events
All spam events
+215.2 %
176.2–259.7 %
532
Spam before market hours only
+154.1 %
107.9–210.6 %
222
particularly those stocks as targets that show exceptionally high volumes.4 To
exclude at least this last hypothesis of inverse causality, we re-estimated model
M1 on a sub-sample by dropping all events where messages have been received
during market hours. Hence, the spammer could not have had known the volume
at the time the message was sent. The results, as reported in the second row
of Table 3, indicate a somewhat lower but still big and highly significant effect.
Note that some reduction is expected since now about half of the spam days’
high volumes account to the average of normal days. Consequently, the constant
term of M2 is slightly higher than for M1 (see Table 8 in the appendix). We
conclude that spammers probably do not select their targets by reacting to high
volumes at the same day, and continue our analyses with the full set of events.
In model M3, we further relax the assumption that a spam event is a binary
state and estimate the relationship between the message quantity, in terms of
messages received per day, and trading activity. In absence of a reasonable prior
for the functional form for the relationship we group the outcomes of cumulative spam arrival xt,i into 8 disjoint bins with approximately equal frequency.
Quadratically increasing bin breaks turned out to achieve this goal very well.
The model equation is a direct generalization of model M1, replacing one single
α by a vector αk with one element per (nonzero) bin:
δ (xt,i ,k)
vt,i = v0 · eζi · w(t) · β0λt ·
αk2
(4)
k
log vt,i = log v0 + ζi + log w(t) + log β0 · λt +
log αk · δ2 (xt,i , k)
(5)
k
Function δ2 (·, ·) maps the actual number of spam messages xt,i citing ticker i at
day t to one of 7 disjoint intervals {1, 2, [3, 4], [5, 8], [9, 16], [17, 32], [33, +∞]}. Its
value is 1 if interval selector k matches the interval of xt,i and 0 otherwise. The
estimated coefficients αk are all positive and highly significant, whereas their
absolute value grows – as expected – with the number of messages received.
Therefore our positive results in the previous tests are certainly not artifacts
4
It is quite likely that spammers do use market information when selecting their
targets, since the majority of messages cites current quotes. If the access to realtime data is once in place it can easily be used for additional purposes.
10
More Means More
●
500
Volume (100 = avg. volume w/o spam)
(63)
●
(75)
400
●
(73)
300
●
●
(63)
●
200
●
(97)
(45)
(116)
100
●
0
0
1
2
[3,4]
[5,8]
[9,16] [17,32]
>33
Number of spam messages received
Fig. 4. Effect of the quantity of received messages on traded volume per business day
as given by the coefficients αk of model M3. Categories on the x-axis are quadratically
increasing bins. A clearly linear relationship between volume reaction and bin index
suggests the existence of diminishing marginal response of additional spam dissemination. Figures in brackets denote number of cases in each bin.
of singular cases with extremely high penetration of spam messages (up to 118
citing the same ticker on a single day). Moreover, a graphical analysis of the
estimated impact factors by bins reveals a good linear relationship between bin
number and impact (see Figure 4). As bin widths grow quadratically, we find
that the spammer faces diminishing marginal “utility” from additional messages.
Further developing this admittedly somewhat crazy line of thought, one could
come up with an “optimal spam amount” and – assuming that spammers act
rationally and operate at that point – eventually infer their implied cost of
sending a message (see [5] and [12] for alternative ways to estimate the cost to
send spam).
To complete the analysis of effects on volume, we look at the development of
effect strength over time. Therefore we specify model M4 as
vt,i = v0 · w(t) · eζi · β0λt · (αβ1λt )δ1 (xt,i )
.
(6)
The parameters of M4 were estimated from a log-linearized form of Eq. 6, yielding
a model with interaction term. The results show positive values for both β0 and
β1 , whereas only β0 is statistically significant (see Table 8 in the appendix). This
means that the average traded volume of stocks in the sample grew over time,
but the effect of stock spam on volume has remained constant (with a slight
tendency to the upside). Hence, there is no sign in the data that the “stock
spam trick” is wearing out over time.
11
Table 4. Effect of spam arrival on intra-day stock price development
Stock spam received
No
Yes
27.8 %
51.9
47.1 %
24.3
25.1 %
23.8
100.0 %
100.0
Intra-day movement
Open>Close
Open=Close
Open
(n = 32261)
%
%
%
%
(n = 547)
2
χ (2) = 171.5, p < 0.001
3.4
Effects on Market Valuation
To start with a simple (and naăve) way to assess the effect of stock spam on
market valuation of cited stocks, we tabulate the intra-day price development for
days with and without spam arrival (Table 4). We find a significant relationship,
which again shows that spam actually influences trading activity: the large share
of equal open and close prices on days without spam reduces by about 50 % for
days with spam messages. Moreover, the probability mass moves to the cases
where the open price is higher than the close price, i.e., where the respective
stock looses value. However, considering this analysis as evidence for negative
impact in general would be premature for three reasons: First, the tabulation
approach solely regards the sign and does not take into account the absolute
value of profits and losses. If losses are frequent but systematically smaller than
(less frequent) profits then the average outcome could still be positive. Second,
the tabulation includes all spam events (defined as days with nonzero spam
arrival rate) irrespectively of possible arrivals in the past. The interactions of
effects from subsequent events can be very complex and may bias the result.
The third concern addresses the fact that the medium-term price development
is completely disregarded in this analysis. If a stock price has declined for several
consecutive days then even a relatively smaller, but still negative, development
at the event day should be regarded as a positive effect of spam arrival, and vice
versa.
3.4.1
Event Study Methodology
Event study analysis is a technique borrowed from finance research that allows
to compensate for the above mentioned shortcomings (for an overview see [21]).
The method defines the notion of abnormal returns ARt,i , that is the difference
between the actual daily return Rt,i of stock i and its most normal returns,
i.e., the most likely returns if the event would not have happened E(Rt,i |θi ),
12
conditional to a specific prediction model with parameters θi :
ARt,i = Rt,i − E(Rt,i |θi )
(7)
Daily return Rt,i are computed from daily adjusted close prices Pt,i as follows:
Rt,i =
Pt,i
Pt,i − Pt−1,i
=
−1
Pt−1,i
Pt−1,i
(8)
Consequently, cumulative abnormal returns (CARt,i ) are defined as the sum of
abnormal returns of a number of subsequent days after an event at time t0 .
t
CARt,i =
(9)
ARτ,i
τ =t0
The crux of the method lies in the choice of a good prediction model to obtain
the most likely returns. In [21], MacKinlay discusses constant mean return models, market models, “other statistical models”, and economic models as possible
options. All models have in common that their parameters θ are estimated from
the stock price development in a time period of size ∆test before the event had
been observed. This period is called estimation window in contrast to the event
window of size ∆tevt starting at the event day t0 . An optional gap between the
estimation window and the event window can be used to account for possible
inaccuracies of event times in the data. See Figure 5 for an illustration of the
different time periods in our event study.
Fig. 5. Time line of the event study
t0
estimation window
event window
∆test
∆tgap
∆tevt
We have investigated the prospect to use a market model as predictor. Models of this type predict the expected return conditional to the general market
development as measured by a (weighted) index of the stocks under study, or by
a common stock market index. The advantage in explanatory power of a market
model over the simple constant return model, however, strongly depends on the
correlation of individual stocks with the market index or between pairwise stocks
in the sample. Therefore we computed the correlation of returns from each stock
in the sample to the returns of three popular indices (S&P 500, NASDAQ Composite, and Russell’s specific micro-captial index). The distribution of correlation
coefficients is depicted as violin plot in Figure 6 using a kernel density smoother.
13
Correlation of Sample Stocks with Stock Market Indices
Correlation of returns
0.3
0.2
0.1
0.0
−0.1
−0.2
−0.3
S&P 500
NASDAQ Composite
Russel Microcap
Sample
Index
Fig. 6. Violin plot of the density of pairwise correlation coefficients between daily
returns of penny stocks in the sample and returns of common market indices (left
3 violins) and other stocks in the sample (rightmost violin). The respective median
correlation coefficient is indicated as horizontal bar.
As can be seen from both the distributions and the indicated median correlation coefficients, none of the indices has sufficient explanatory power to make a
prediction of returns for the penny stocks in our sample more reliable. This finding is consistent with prior comparisons of (asset-weighted) returns from OTC
markets with leading indices [28]. The even lower correlation coefficients between
pairs of stocks in the sample thwart any attempt to construct a prediction model
from our own sample-specific index. As a result, we employ the constant mean
return model for our analysis, where the normal returns are expected to follow
the linear trend observed in the estimation window.
E(Rt,i |θi ) = θi =
1
∆test
∆test
Rτ,i
(10)
τ =0
Although the constant mean return model is the simplest option, finance scholars
report that it often yields results similar to those of more sophisticated models
[33, 21].
However, the small correlation between returns of stocks in our sample has
also a positive aspect for our study: it reduces the risk of intractable interaction
effects between overlapping event windows for different stocks, a problem that
has been identified in other event studies before and which is usually referred to
as “clustering” [21]. Though we do not expect large influences from concurring
spam messages citing different stocks, we surely must carefully exclude possible
influences from subsequent spam events targeting the same stock. Otherwise abnormal price developments from previous events could adversely affect the model
calibration in the estimation window and, even worse, overlay the dynamics in
the event window if multiple events occur in quick succession. Therefore we de14
Table 5. Effect of stock spam on market valuation of cited firms
Day
0
1
2
3
4
Aggregated
95 %
Aggregated
daily
confidence
cumulative
abnormal return interval abnormal return
+1.7 %
[+1.5, +2.0]
+1.7 %
−0.9 %
[−1.1, −0.6]
+0.9 %
+0.9 %
[+0.6, +1.1]
+1.2 %
−1.1 %
[−1.3, −0.8]
+0.2 %
−0.9 %
[−1.2, −0.6]
−0.7 %
95 %
confidence
interval
[+1.5, +2.0]
[+0.5, +1.2]
[+0.8, +1.7]
[−0.3, +0.7]
[−1.3, −0.1]
Constant mean return model on final sample of 152 events for 93 unique stocks.
fine a penalty period ∆tpen . All events of the same stock with distance less or
equal ∆tpen are excluded from the analysis (but still act as penalizing entities
for subsequent events).
Our analysis was conducted with the following settings: the size of the estimation window was fixed to ∆test = 30 business days. An event was excluded if
less than two thirds of the required observations were available. We further set
∆tgap = 3 business days and ∆tpen = 10 calendar days (the rationale here was
that the recognition of spam messages fades regardless of whether the market
was opened or closed). This decision dropped 374 events, keeping a total number
of 152 (note that multiple message arrivals citing the same ticker at the same day
count as one event only). After computing the abnormal returns and cumulative
abnormal returns for each event along an event window of size ∆tevt = 5, four
more events were excluded as outliers because their AR values for day t0 were
outside five times the 10–90 % percentile of the distribution.5
As a sort of robustness check, we tried different alternative settings, which
caused the results to change somewhat, but the main effect never disappeared
except when the exclusion of subsequent events is completely omitted. Longer
estimation windows do reduce the standard errors of the estimates (using the
asymptotic distributions as described in [21]) but do not change the general
results. At the same time, the number of events decreases because some of the
time series for price quotes do not date back long enough before the first relevant
events in our sample. Unlike the approach in [21], the statistical hypothesis tests
were computed as t-tests to better account for the uncertainty linked with a small
number of events. All p-values reported are more critical than the respective
results of the standard method (we verified this for all results). Both methods
should concur in the limit case of infinitely many events.
5
3 out of 4 outliers showed extremely high abnormal returns, hence excluding them
supports the Null hypothesis and makes our method more prudent.
15
3.4.2
Results
The main results are summarized in Table 5.6 We find a pattern of positive and
significant abnormal returns for days t0 (the effective event day) and t2 , as well
as significant negative abnormal returns for days t1 , t3 , and t4 . This is perhaps an
artifact of the interleaved buy- and sell orders from naăve victims (who believe in
the message and buy), spammers (who sell after they deem the market reaction
is on its maximum), and smart “victims” who jump on the bandwagon and
try to buy early to sell soon and thus profit from the price hike as well. But
the evidence for this interpretation is not very strong, though a similar pattern
remains stable for different subsets of events and also for different settings of
the key parameters (not reported here). Regarding the cumulative aggregated
returns, the picture becomes much clearer. There exists a non-negligible positive
bulge directly after the event that fades over time and finally turns negative on
day t4 (all estimates except t3 being statistically significant).
The finding of positive abnormal returns is consistent with the presumption
that stock spam is on average a profitable business model (for spammers). Otherwise the persistent presence of stock spam would cause a puzzle. However, this
finding does not imply that more than 50 % of the cases yield positive returns,
nor that the average return is positive. Similar to the initial tabulation in Table 4, a sign test on the individual AR estimates (before aggregation but after
applying the penalty rule) suggests the contrary: negative and positive abnormal
returns occur almost equally frequent. However, the positive outcomes tend to be
higher than the negative ones. But even positive abnormal returns do not always
imply profits. If the stock is in a downward movement that temporarily looses
pace due to spam events, then it is still difficult to make money in this situation.
Let alone that spammers quite likely have to bear the transaction costs as well,
which are completely disregarded in this study. (N.B. the volume analysis alone
suggests that a collusion between market makers charging transaction costs and
stock spammers would probably be profitable).
As in the analysis of volume, we have broken down the set of events into
smaller subsets to shed more light in interesting subordinated research questions. Similar to model M2 in Section 3.3, we exclude all events triggered by
messages that arrived after the market had opened. This allows us to rule out
an alternative explanation for the results, namely that spammers deliberately
select stocks after they have noticed an exceptional hike in its price. The result
pattern of AR is very similar to the baseline model; its positive abnormal returns
are even slightly higher, which yields more slowly decaying cumulative abnormal
returns (see Table 9 in the appendix).
Another break-down has been conducted by liquidity. One might assume
that lower liquidity implies higher market impact and thus more favorable (i.e.,
higher and more predictable) abnormal returns. This rationale also constitutes
the common argument why stock spammers target penny stocks only. As we
have no direct measure of liquidity in the data, we construct an indicator for
liquidity by measuring the fraction of days where high and low prices are equal.
6
For more details see Table 9 in the appendix.
16
Stock Spam Hypes Market Valuation
10
8
●
●
●
Abnormal return (in %)
●
●
6
4
2
●
●
●
0
●
●
●
−2
●
●
−1
0
all events
more than 10 messages
1
2
3
4
Day after event
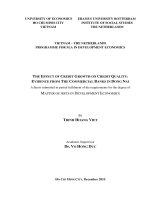
Fig. 7. Effect of the quantity of received messages on abnormal return. Bars indicate aggregated abnormal returns (AR) on single days; line markers show cumulative
abnormal returns (CAR). Estimates based on 152 resp. 33 events.
We assume that on those days no transaction has taken place. Though this is
only a rough measure – especially for penny stocks where the quantization to
ticks may underestimate the actual number of days with transactions – we use
this indicator to separate the lower (0–30 %) percentiles from the higher (70–
100 %) ones in the sample. Interestingly – and somewhat counter-intuitively –
we find that stocks with higher liquidity yield higher and persistently positive
cumulative abnormal returns, whereas stocks in the low liquidity group show
on average smaller and statistically insignificant reactions at day t0 , which is
quickly driven to the negative in the following days. Hence, the lower liquidity
might cause stronger market reactions when spammers and speculators dump
their stocks to realize short-term profits. It is up to further research to verify
this finding with more appropriate indicators, and to finally decide whether the
presumption is right or wrong (then, however, there must be other reasons why
spammers usually do not target listed stocks).
We have also analyzed the data for possible aggregated effects of learning
over time. Therefore we split the sample into two halves, with July 1st, 2005
marking the break. We observe clearly positive cumulative abnormal returns
from the very first (event) day on in the second half only. In the first half, the
abnormal return at the event day is not significant, and the measurable reaction
is overwhelmingly negative. This result can well be an artifact of the general
market conditions, which we did not control for. But it is also possible that
traders among the spam recipients made the experience that reacting to stock
spam is profitable for them as well, which causes them to jump on the bandwagon
and support the self-fulfilling prophecy even further. This interpretation is also
17
consistent with the positive (albeit not significant) interaction term for the effect
on volume over time in model M4 (Table 8).
Finally we looked at the influence of message quantity by calculating the
abnormal returns for the subset of events with more than 10 messages per day
(citing the same ticker). Here it is clearly visible that more messages drive the
abnormal return further to the positive. A visual comparison of the cumulative
abnormal returns of the baseline model and the subset with high message quantity is depicted in Figure 7. This is again consistent with our findings on quantity
and traded volume.
4
Conclusion
4.1
Discussion
Among all classes of unsolicited bulk e-mail, stock spam has the particular property that reactions can be observed indirectly from publicly available stock price
quotes. Our study makes use of this feature and finds evidence that spam message campaigns on average go along with a) an increase in trading activity of
the cited stock, and b) positive cumulative abnormal returns shortly after the
messages have been distributed. Hence, we conclude that the business model for
stock spam actually works. The dynamics in traded volume and prices can be
attributed to the sum of actions from at least three groups of individuals:
1. spammers, who trade the stock to capitalize profits from their campaign,
2. naăve recipients, who believe in the pretended investment advises, and
3. smart recipients, who try to participate in price hikes triggered by spammers.
With the given data we cannot disentangle the contributions from each channel.
Especially the third group (smart recipients) are interesting from a theoretical
point of view, since they build a link to research on herd behaviour in financial
markets [34, 35]. In addition, a game-theoretic framework suggests that spammers take the role of the third party in coordination games [36], and information
from spam messages creates focal points that guide investors to a social equilibrium strategy.
However, it is important to note that our study completely disregards longterm effects of stock spam. Therefore possible permanent negative consequences
for micro-cap companies do not show up in this analysis at all.7
Finally, the mere fact that a number of people obviously follow financial
advice delivered via e-mail from unknown senders, is relevant for the stability
of the entire financial system. Consider the potential of spammers replacing
investment hints with credible rumours about alleged solvency problems of large
banks, coupled with a call to withdraw all savings. It is conceivable that the right
mixture of reaction to such messages together with lacking crisis communication
7
While browsing through individual charts with indicated spam arrivals, the authors
found some distressing cases: it appeared like stock spam systematically squeezed
down some of the victim’s market value. This fits also into the big picture of [17].
18
may actually result in a self-fulfilling prophecy, yielding bank-runs and domino
effects with all their adverse consequences. Even if the probability of such cooccurrence is deemed low, such scenarios should certainly be on the agenda of
crisis teams in financial supervision authorities and in cyber-terrorism defense.
4.2
Limitations and Future Work
Although our results do not leave too many puzzles and proved to be quite
robust, there exists a long list of possible improvements for future research.
Probably the most salient limitation concerns the absence of a sound method
to test causality. Though we made efforts to rule out the possibility that high
abnormal returns are a result of the spammers’ ticker selection strategy, we did
not control for third variables that might affect both stock price and spammers’
decision to target a particular ticker. Since basic epistemology tells us that we
will never succeed in controlling for all possible third variables, some uncertainty
will always remain and therefore we should rather think of a relationship instead
of a causal link between stock spam and market indicators.
Another shortcoming of our study is the incomplete data from publicly available sources. A first step would be to collect price information for all 391 unique
tickers in the SSEM data. Improving the resolution of data (down to the tick
level of individual transactions) would perhaps enable us to tell the orders of
spammers better apart from assumed reactions of the recipients. More consistent information on market capitalization could also be useful to weight the
abnormal returns by firm size in the aggregation step. Possibly, we also face a
subtle reactivity problem in the SSEM data collection. Since intra-day analyses
of individual tickers are constantly published on Richardson’s website [18], spammers might use this information to exclude SSEM’s probe accounts from their
distribution lists, and/or learn how to trick the automatic stock spam detection
algorithm.
From a methodological point of view, the independence assumption about the
residuals in the regression models, and particularly in the event study analysis,
could be replaced by more realistic (and complicated) assumptions, possibly in
a proper framework for time series analysis.
We also have in mind a number of extensions. As all spam messages are
available in plain text, computer-linguistic content analyses could reveal possible clusters of origin. Moreover, the influence of specific characteristics of the
message draft on its market impact could yield interesting findings on persuasive
elements and response rates that are hard to obtain otherwise (because spammers usually do not disclose their response rates). Finally, a careful analysis of
properties of the affected companies could help us to understand the spammers’
strategy to select stocks. The determinants of spam attacks might also be of
interest for CFOs of public enterprises traded on OTC markets.
To sum it all up, although we found a clear relationship in our data, we are
aware that the evidence for stock spam causing people to buy a certain stock
is not rock solid. Therefore this paper should be regarded as a first and modest
step into an interesting direction.
19
Acknowledgements
Leonard Richardson deserves special credit for his fabulous stock spam archive
which served as main data source for this study.
References
1. Schneier, B., Wood, P., et al.: 2005 Attack Trends & Analysis. Counterpane
Internet Security and MessageLabs (2006) />attack-trends-2005-messagelabs.pdf.
2. Judge, P., Alperovitch, D., Yang, W.: Understanding and reversing the profit model
of spam. In: Workshop on the Economics of Information Security (WEIS), Cambridge, MA (2005) (Rump session
talk).
3. Freiling, F., Holz, T., Wicherski, G.: Botnet tracking: Exploring a root-cause
methodology to prevent distributed denial-of-service attacks. In S. de Capitani di
Vimercati et al., ed.: Proc. of ESORICS. LNCS 3679, Berlin Heidelberg, Springer
Verlag (2005) 319–335
4. Drucker, H., Vapnik, V., Wu, D.: Support vector machines for spam categorization.
IEEE Transactions on Neural Networks 10 (1999) 1048–1054
5. Cobb, S.: The Economics of Spam. ePrivacy Group (2003) mhelp.
org/articles/economics_of_spam.pdf.
6. Loder, T., van Alstyne, M.W., Wash, R.: An economic answer to unsolicited
communication. In: ACM Conference on Electronic Commerce. (2004) 40–50
7. Kraut, R.E., Sunder, S., Telang, R., Morris, J.: Pricing electronic mail to solve the
problem of spam. Human-Computer Interaction 20 (2005) 195–223
8. Ciphertrust: Spam statistics. Online Source (2004) hertrust.
com/resources/statistics/index.php.
9. Dwork, C., Naor, M.: Pricing via processing or combatting junk mail. In: 12th
Annual International Cryptology Conference (CRYPTO’92). (1992) 139–147
10. Dwork, C., Goldberg, A., Naor, M.: On memory-bound functions for fighting spam.
In: 23th Annual International Cryptology Conference (CRYPTO’03). (2003) 426–
444
11. Back, A.: Hashcash – A denial of service counter-measure. Online Source (2002)
/>12. Laurie, B., Clayton, R.: “Proof-of-work” proves not to work. In: Workshop on
the Economics of Information Security (WEIS), Minneapolis, MN (2004) http:
//www.cl.cam.ac.uk/~rnc1/proofwork.pdf.
13. Ahn, L.v., Blum, M., Langford, J.: Telling humans and computers apart. Communications of the ACM 47 (2004) 57–60
14. Fahlman, S.E.: Selling interrupt rights: A way to control unwanted e-mail and
telephone calls. IBM Systems Journal 41 (2002) 759–766
15. Pradhuman, S.D.: Small-Cap Dynamics. Bloomberg Press, New York (2000)
16. Expedite: OTC Pink Sheet stocks email marketing. Online Source (2006) http:
//www.expedite-email-marketing.com/OTCPinkSheetStocksEmailMarketin%g.
htm.
17. Cyr, J.: Spam stock tracker. (2005)
18. Richardson, L.: Stock spam effectiveness monitor. />features/StockSpam/ (2005)
20
19. N.N.: Stock market schemes and penny stock offers. Online Source (2006) http:
//rjohara.net/money/stocks/.
20. McIntyre, A.: Spam-advertised stocks. Online Source (2002) ngod.
com/angus/Computing/Internet/Spam/Stocks/Stocks.php.
21. MacKinlay, C.A.: Event studies in economics and finance. Journal of Economic
Literature 35 (1997) 13–39
22. Ettredge, M., Richardson, V.J.: Assessing the risk in e-commerce. In R. H.S.,
ed.: Proc. of the 35th Hawaii International Conference on System Sciences, Los
Alamitos, CA, IEEE Press (2002)
23. Campbell, K., Gordon, L.A., Loeb, M.P., Zhou, L.: The economic cost of publicly announced information security breaches: Empirical evidence from the stock
market. Journal of Computer Security 11 (2003) 431–448
24. Cavusoglu, H., Mishra, B., Raghunathan, S.: The effect of internet security breach
announcements on market value: Capital market reactions for breached firms and
internet security developers. International Journal of Electronic Commerce 9
(2004) 69–104
25. Telang, R., Wattal, S.: Impact of software vulnerability announcements on the
market value of software vendors – an empirical investigation. In: Workshop on
the Economics of Information Security (WEIS), Cambridge, MA (2005) http:
//infosecon.net/workshop/pdf/telang_wattal.pdf.
26. Bjerring, J.H., Lakonishok, J., Vermaelen, T.: Stock price and financial analysts’
recommendations. Journal of Finance 38 (1983) 187–204
27. Liu, P., Smith, S.D., Syed, A.A.: Stock price reaction to the Wall Street Journal’s
securities recommendations. Journal of Financial and Quantitative Analysis 25
(1990) 399–410
28. Larson, S., Luft, C., Levine, L.M.: Over the Counter Bulletin Board exchange:
Market structure, risk, and return. Journal of Alternative Investments 3 (2001)
29. Yahoo Finance: Historical data download. (2006)
30. Frank Russell Company: U. S. equity index values. />Indexes/US/index_values.asp (2006)
31. Pink Sheets: Frequently asked questions. />(2004)
32. Bates, D.M., Pinheiro, J.C.: Computational methods for multilevel models.
Bell Labs Technical Memorandum (1998) />departments/sia/project/nlme/CompMulti.pd%f.
33. Brown, S.J., Warner, J.B.: Using daily stock returns: The case of event studies.
Journal of Financial Economics 14 (1985) 3–31
34. Banerjee, A.V.: A simple model of herd behavior. Quarterly Journal of Economics
107 (1992) 797–817
35. Bikhchandani, S., Sharma, S.: Herd behavior in financial markets. IMF Staff Papers 47 (2001) 279–310 />01/pdf/Bikhchan.pdf.
36. Schelling, T.C.: The Strategy of Conflict. Harvard University Press, Cambridge,
MA (1960)
21
Appendix
Table 6. Tickers cited in stock spam (ranked by number of event days)
Rank
1.
2.
3.
4.
5.
6.
7.
8.
9.
10.
11.
12.
Ticker
symbol
VNBL.OB
CWTD.OB
NOTE.PK
EOGI.PK
CGKY.PK
AMBD.PK
YPIL.PK
APWL.PK
CEOA.PK
MOGI.PK
MWIS.OB
EXTP.PK
Company Name
VINOBLE INC
CHINA WORLD TRADE
NA
EMERSON OIL & GAS
CARNEGIE COOKE & COM
AMERICAN MOBILE DENT
IPACKETS INTL INC
ADVANCED POWERLINE
CEO AMERICA INC
MONTANA OIL & GAS
M-WISE INC
EXTREME POKER LTD
Event
days
77
52
51
45
37
37
35
31
31
29
27
26
Time period: Nov 2004 – Feb 2006
Messages
received
890
919
53
565
1320
57
769
240
347
424
400
84
Source: [18]
Table 7. Tickers cited in stock spam (ranked by total number of messages)
Rank
1.
2.
3.
4.
5.
6.
7.
8.
9.
10.
11.
12.
Ticker
symbol
CGKY.PK
CWTD.OB
VNBL.OB
YPIL.PK
USTA.PK
VERY.PK
EOGI.PK
DKDY.OB
MOGI.PK
PPTL.PK
MWIS.OB
SCRE.OB
Company Name
CARNEGIE COOKE & COM
CHINA WORLD TRADE
VINOBLE INC
IPACKETS INTL INC
US STARCOM INC
VERIDA INTERNET CORP
EMERSON OIL & GAS
DARK DYNAMITE INC
MONTANA OIL & GAS
PREMIUM PETROLM NEW
M-WISE INC
HUIFENG BIO-PHARM TH
Time period: Nov 2004 – Feb 2006
Event
days
37
52
77
35
11
9
45
14
29
25
27
21
Messages
received
1320
919
890
769
608
577
565
481
424
416
400
400
Source: [18]
22
Table 8. Estimated coefficients for effect of stock spam on traded volume
Parameter
Terms
M1
9.70
∗∗∗
1.15
∗∗∗
Constant (log v0 )
(0.152)
log α
(0.067)
log αpremarket
log α1
log α2
log α[3,4]
log α[5,8]
log α[9,16]
log α[17,32]
–
Model
M2
M3
9.71
∗∗∗
9.70
∗∗∗
M4
9.70
∗∗∗
0.94
∗∗∗
(0.152)
(0.152)
(0.152)
–
0.93
–
(0.177)
∗∗∗
(0.102)
–
–
–
0.92
∗∗∗
1.06
∗∗∗
1.30
∗∗∗
1.64
∗∗∗
1.57
∗∗∗
–
–
–
–
(0.154)
–
–
1.04
∗∗∗
(0.225)
–
–
–
(0.190)
–
–
∗∗∗
(0.140)
–
–
–
0.76
–
(0.177)
–
–
(0.191)
log α[33,+∞]
–
–
(0.176)
Trend interaction (log β1 )
–
–
–
–
0.36
(0.282)
Controls
(0.029)
log wWed
(0.029)
log wThu
(0.029)
log wFri
(0.029)
Volume trend (log β0 )
(0.033)
Summary
Std. dev. (ˆ
σζ )
Std. dev. (ˆ
σ)
AIC
BIC
No. of observations (t, i)
No. of tickers i
No. of spam events
0.05
0.05
log wTue
0.01
0.02
−0.02
1.57
1.50
101810
101884
27708
111
532
0.96
−0.01
23
∗∗∗
−0.01
0.95
(0.029)
∗∗∗
(0.033)
1.57
1.51
102015
102089
27708
111
222
∗∗
0.02
(0.029)
(0.029)
(0.033)
Standard errors in brackets; sig. levels: ∗ p < 0.05,
(0.029)
(0.029)
(0.029)
∗∗∗
0.04
(0.029)
(0.029)
−0.01
(0.029)
0.04
(0.029)
0.02
0.05
(0.029)
0.04
0.04
0.95
0.05
(0.029)
1.57
1.50
101807
101931
27708
111
532
p < 0.01,
∗∗∗
0.95
∗∗∗
(0.033)
1.57
1.50
101811
101893
27708
111
532
p < 0.001
Table 9. Results of the event study analysis: estimated abnormal returns
Model
Baseline model
0
1
1.7
∗∗∗
1.7
∗∗∗
Days after event
2
−0.9
∗∗∗
0.9
∗∗∗
0.9
∗∗∗
1.2
∗∗∗
3
−1.1
4
∗∗∗
−0.9
∗∗∗
−0.7
∗
AR (in %)
(0.26)
CAR (in %)
(0.26)
(0.36)
(0.45)
(0.52)
(0.59)
n
152
Models on subsets of events
Spam before market hours only
152
151
150
149
(0.26)
2.1
∗∗∗
2.1
∗∗∗
(0.26)
−1.0
∗∗∗
1.1
∗∗∗
(0.26)
1.6
∗∗∗
2.2
∗∗∗
(0.26)
0.2
−1.0
∗∗∗
1.1
∗∗∗
−0.8
AR (in %)
(0.29)
CAR (in %)
(0.29)
(0.42)
(0.52)
(0.60)
(0.67)
136
136
135
135
134
n
Stocks with high liquidity
(0.29)
4.3
∗∗∗
4.3
∗∗∗
(0.30)
−1.4
∗∗∗
2.9
∗∗∗
(0.30)
2.5
∗∗∗
5.4
∗∗∗
1.9
∗∗∗
7.6
∗∗∗
0.4
−1.3
∗∗∗
6.3
∗∗∗
AR (in %)
(0.42)
CAR (in %)
(0.42)
(0.59)
(0.73)
(0.87)
(0.97)
41
41
41
40
40
n
Stocks with low liquidity
(0.42)
0.7
AR (in %)
(0.77)
CAR (in %)
(0.77)
−2.2
∗∗∗
−1.5
∗∗
(0.77)
0.7
n
Events before July 1st, 2005
(0.42)
∗∗∗
−1.6
(0.43)
∗∗∗
(0.77)
−0.6
1.0
−0.8
−1.4
(1.33)
(1.53)
(1.71)
44
44
44
44
−0.7
∗∗
−0.8
∗
1.3
∗∗∗
−3.0
∗∗∗
−2.5
∗∗∗
−2.1
∗∗∗
−4.6
∗∗∗
AR (in %)
(0.47)
CAR (in %)
(0.47)
(0.67)
(0.81)
(0.94)
(1.05)
63
63
63
63
63
n
Events after July 1st, 2005
(0.47)
−0.1
3.0
∗∗∗
3.0
∗∗∗
AR (in %)
(0.50)
CAR (in %)
(0.50)
(0.47)
(0.47)
0.5
−1.0
∗∗∗
2.0
∗∗∗
(0.50)
0.6
∗
1.8
∗∗∗
(0.47)
−0.0
0.3
(0.51)
(0.52)
2.2
(0.53)
∗∗∗
2.1
(0.71)
(0.88)
(1.03)
(1.18)
n
89
89
Events with more than 10 message arrivals
88
87
86
7.3
∗∗∗
7.3
∗∗∗
−1.2
AR (in %)
(0.88)
CAR (in %)
(0.88)
(1.24)
33
33
n
∗
(0.88)
6.1
∗∗∗
Standard errors in brackets; sig. levels: ∗ p < 0.05,
24
1.9
∗∗∗
8.0
∗∗∗
(0.88)
−0.7
p < 0.01,
(0.88)
∗∗∗
6.6
(1.76)
(1.96)
33
33
33
∗∗
7.3
∗∗∗
∗∗∗
−0.7
(0.88)
(1.52)
∗
(0.77)
(1.08)
44
−0.1
2.5
(0.43)
(0.77)
∗∗∗
(0.30)
p < 0.001
∗∗∗