- Trang chủ >>
- Y - Dược >>
- Truyền nhiễm
The impacts of massive infectious and contagious diseases and its impacts on economy performance a case of wuhan, china
Bạn đang xem bản rút gọn của tài liệu. Xem và tải ngay bản đầy đủ của tài liệu tại đây (912.75 KB, 21 trang )
iew
ed
The Impact of Massive Infectious and Contagious Diseases and Its
Impact on the Economic Performance:
The Case of Wuhan, China
Keywords:
Economic Simulation, contagious diseases, China, Wuhan, Policy Modeling
JEL Code:
I15, I18
ev
Corresponding First Author
Mario Arturo Ruiz Estrada,
Faculty of Economics and Administration (FEA)
University of Malaya, 50603 Kuala Lumpur, MALAYSIA
[E-mail]
er
r
Second Author
Donghyun PARK,
Principal Economist,
Asian Development Bank (ADB),
6 ADB Avenue, Mandaluyong City, Metro Manila, Philippines 1550.
[E-mail]:
pe
Third Author
Evangelos Koutronas
Social Security Research Centre (SSRC)
Faculty of Economics and Administration (FEA)
University of Malaya, 50603 Kuala Lumpur, MALAYSIA
Email:
rin
tn
ot
Fourth Author
Alam KHAN,
Faculty of Economics,
Department of Economics, KUST,
Kohat 26000, Khyber Pakhtunkhwa, Pakistan
[E-mail]
Fifth Author
Muhammad TAHIR,
Department of Management Sciences,
Comsats Institute of Information Technology,
Abbottabad, Pakistan
[E-mail]
Abstract
Pr
ep
This paper attempts to evaluate the impact of massive infectious and contagious diseases and its final impact
on the economic performance anywhere and anytime. We are considering to evaluate the case of Wuhan,
China. We are taking in consideration the case of Wuhan coronavirus to be evaluated under a domestic,
national, and international level impact. In this paper, we also propose a new simulator to evaluate the impact
of massive infections and contagious diseases on the economic performance subsequently. This simulator is
entitled "The Integral Massive Infections and Contagious Diseases Economic Simulator (IMICDESimulator)." Hence, this simulator tries to show a macro and micro analysis with different possible scenarios
simultaneously. Finally, the IMICDE-Simulator was applied to the case of Wuhan-China respectively.
1
This preprint research paper has not been peer reviewed. Electronic copy available at: />
iew
ed
1.1. Introduction
Pr
ep
rin
tn
ot
pe
er
r
ev
In December 2019, an outbreak of respiratory illness is emerging caused by a novel (new)
coronavirus (named “2019-nCoV”) that was first detected in Wuhan City, Hubei Province, China
and which continues to expand. Chinese health officials have reported tens of thousands of infections
with 2019-nCoV in China, with the virus reportedly spreading from person-to-person in parts of that
country. Infections with 2019-nCoV, most of them associated with travel from Wuhan, also are being
reported in a growing number of international locations. At the time of this writing, Worldometer1
reported 28,726 confirmed 2019-nCoV incidents of which 3,826 are in critical condition, 565 died,
and 1,170 recovered, affecting 28 countries and territories around the world (Worldometer, 2020).
WHO is estimated that the novel coronavirus' case fatality rate has been estimated at around
2 percent (WHO, 2020), substantially lower than Middle East Respiratory Syndrome MERS (34
percent) and Severe Acute Respiratory Syndrome SARS (10 percent)(Worldometer, 2020). The
incubation period of the virus may appear in as few as 2 days or as long as 14 (World Health
Organization (WHO): 2-10 days; China’s National Health Commission (NHC): 2-14 days; The
United States’ Centers for Disease Control and Prevention (CDC) and 10-14 days), during which the
virus is contagious but the patient does not display any symptom (asymptomatic transmission). All
population groups can be infected by the 2019-nCoV, however, seniors and people with pre-existing
medical conditions (such as asthma, diabetes, heart disease) appear to be more vulnerable to
becoming severely ill with the virus.
Beyond the public health impacts of regional or global emerging and endemic infectious
disease events lay wider socioeconomic consequences that are often not considered in risk or impact
assessments. Endemic infectious deseases set in motion a complex chain of events in the economy.
They are rare and extreme events, highly diverse and volatile over time and across countries.
Estimating terrorism risk depends upon several factors that varied by the type of activity. The
idiosyncratic nature of endemic infectious deseases is based, among others, on the magnitude and
duration of the event, the size and state of the local economy, the geographical locations affected,
the population density and the time of the day they occurred. If the calculation of costs associated
with death loss, chronically ill cattle marketed prematurely at a discount, and treatment are are readily
traceable. the estimation of indirect costs such as reduced performance of the local labor force and/or
the impact on the international travel and trade can be an onerous task.
This paper formulates an analytical framework for estimating the economic consequences of
endemic infectious disease both in terms of immediate policy response in the aftermath of the desease
and of medium-term policy implications for regulatory and fiscal policy. The Integral Massive
Infections and Contagious Diseases Economic Simulator (IMICDE-Simulator) – to evaluate an
economy in times of massive infections and contagious diseases. The IMICDE-Simulator is based
on seven basic indicators - (i) the massive infections and diseases contagious spread intensity (cidc),
(ii) the level of treatment and prevention level (ηtp); (iii) the massive infections and diseases infected
causalities (-Lidc); (iv) the economic wear from massive infections and diseases contagious (Πidc);
1
Our sources include the United Nations Population Division, World Health Organization (WHO), Food and Agriculture
Organization (FAO), International Monetary Fund (IMF), and World Bank.
2
This preprint research paper has not been peer reviewed. Electronic copy available at: />
ev
iew
ed
(v) the level of the massive infections and diseases contagious multiplier (Midc); (vi) the total
economic leaking from massive infections and diseases contagious (Lidc-total); and (vii) the
economic desgrowth from massive infections and diseases contagious (-δidc). To illustrate and
illuminate the IMICDE-Simulator, we apply the simulator to the case of Wuhan coronavirus. The
model investigates the uncertainty and behavioral change under a new perspective within the
framework of a dynamic imbalanced state (DIS) (Ruiz Estrada & Yap, 2013) and the Omnia Mobilis
assumption (Ruiz Estrada, 2011).
The paper is organized as follows. Section 2 offers an overview of the massive infections and
contagious diseases in China for the last twenty years. Section 3 describes Wuhan’s economy.
Section 4 introduces the model. Section 5 sets a simulation framework and presents model findings
for the Wuhan province. Section 6 concludes.
er
r
1.2. A General Review of the Pandemics and Influenza Epidemics in China
Pr
ep
rin
tn
ot
pe
The world and specially China have witnessed the pandemics and influenza epidemics from
ancient time to now. It affected millions of people in China and all over the world through different
ways of emergence and its transmission. One of them is the pandemic influenza, which is emerged
and transmitted in various forms from centuries. Human pandemics are produced by emergence of
novel strains of influenza, which caused widespread death, illness and disruption. The history showed
there are five influenza pandemics occurred in the last hundred years (see Table 1). During this
period, the improvement in medicine, epidemiology, and globalization process changed the way of
these pandemics. From the literature it is cleared that these pandemics are the outcomes of human
development and due to the eruption of global landscaping according to Kuszewski and Brydak
(2000). On the other hand, there are continuous improvements in the prevention, treatment and
control of these infectious diseases. Now with the technological advancement human beings are able
to control these types of outbreaks, emergence and its transmission. But if proper care is not taken,
then due to globalization, free mobility, demographics and human behavior can increase spread of
these pandemics easily from one place to other place and it can spread globally. Therefore, it is
necessary that proper planning must be present at any to avoid such types of pandemics and when it
arises should not be transmitted to other areas and people. There are two subtypes of Influenza virus
characterized on the basis of antigenic properties of two surface glayco proteins, i.e. hemagglutinin
(H), and neuraminidase (N). There are 18 H subtypes and 11 N sub types identified by the US Centers
for Disease Control and Prevention (Centers for Disease Control and Prevention, 2014). However,
only three of them H1, H2, and H3 are causes transmission from human to human (Webby, 2003).
Due to drift in Antigenic, causes changes in the encoding of genes H and N antigens. This occurs
continuously, and it shrinks the immune system, that causes the occurrence of seasonal influenza
(Zambon (1999). Within the last hundred years there are five pandemics occurred due to the
emergence of the novel influenza strain, for that human beings had no or weak immunity.
3
This preprint research paper has not been peer reviewed. Electronic copy available at: />
iew
ed
Table 1. Five Pandemics and Influenza Epidemics in China
Spanish flu (H1N1), which occurred during 1918 to 1920 and
now outbreak in China which caused approximately 40 to 50
million deaths. This disaster in history is known as the greatest
medical holocaust (Waring (1971). This pandemic has three
different waves, the first was the spring (1918), and the second
was fall (1918), while the third was winter (1918–1919)
(Johnson and Mueller, 2002 and Humphries, 2013). The first
and third was considered as mild, while second was considered
globally disastrous, that caused about ten million deaths. The
number of deaths toll revised and told that the original deaths
were more than the earlier declared. The revised estimates in
1920s were about 21.5 million, while in 1991 it is recalculated
and estimates were between 24.71 to 39.3 million (Jordan 1927
and Patterson and Pyle, 1991).
Asian flu (1957–1958)
Asian flu(H2N2), which occurred during 1957 to1958 due to
(H2N2) strain that outbreak in China and caused one to two
million deaths approximately. In 1957, a new type of influenza
strain was detected in the Chinese province (Yunnan) (Pyle,
1986). Human under the age of 65 years did not possess
immunity to this type of strain. From China this type of virus
first spreads to Hong Kong, then to Taiwan, Singapore, Japan
and then spread all over the world (Fukumi, 1959). This
pandemic spread mainly through sea and land routes, while
some of the proportion through air travel (Pyle, 1986). The
global transmission mostly occurred through land routes from
Russia to Scandinavian countries and then to Eastern Europe
(Payne, 1958 and Langmuir, 1961).
Hong Kong flu (H3N2) that occurred during the period 1968 to
1970 due to the H3N2 strain and it outbreak in China and caused
deaths from 0.5 to 2 million (Guan,et.al, 2010), (Reperant,
Moesker and Osterhaus, 2016). The interesting things is that this
type of pandemic is mostly spread through the air travel
(Cockburn, Delon and Ferreira, 1969), (Longini, Fine and
Thacker, 1986). Although this pandemic is highly transmissible,
but this was milder than the earlier Asian flu.
tn
ot
Hong Kong Flu (1968–1970)
pe
er
r
ev
Spanish Flu (1918–1920)
rin
Swine Flu (2009–2010)
Pr
ep
Wuhan Coronavirus (2020)
While the Swine flu (H1N1) that occurred over the period from
2009 to 2010 in Mexico and deaths toll reached to 575,000
(Guan,et.al, 2010). This influenza pandemic spread in 30
countries within weeks (Smith, et.al, 2009) and within four
months it reached almost in 122 countries, while 134,000 cases
were confirmed and 800 deaths recorded (Henderson, 2009).
This type of virus detected currently in Wuhan (China) and more
than 4,500 peoples are affected and spreading very rapidly to
other areas and countries, so far more than 240 deaths have been
recorded. This type of virus causes pneumonia like illness with
fever and coughing in many cases of infection. With the fear to
affect other people and areas, Chinese government did not allow
the citizens of Wuhan to move freely to other regions, and many
countries stopped travelling to China with the fear to spread
virus.
4
This preprint research paper has not been peer reviewed. Electronic copy available at: />
Pr
ep
rin
tn
ot
pe
er
r
ev
iew
ed
1.3. A General Overview of Wuhan and its Economy
Wuhan is basically the capital city of Hubei province and is located in Central China. The
Wuhan city is comprising of three sub-parts Wuchang, Hankou and Hanyang. The Wuhan city has a
total physical area of 8,494 Km2. The total population is 10.60 million which makes Wuhan one of
the most populous cities of central China (Gain Report, 2018). It is considered one of the main hubs
for both industry and transport for the central China. Cheng and Zhou (2015) highlighted the
importance of Wuhan city and endorsed that it is playing a vital role in economic, transportation and
educational sectors of the Chinese economy. Cowley et al. (2018) discussed the importance of
Wuhan city in terms of transportation and commented that it has linked East with West and South
with the North. In recent times, Wuhan established itself as one of the largest hub of industry,
commerce, culture and education (Bovenkamp and Fei, 2016).
The city of Wuhan has a strong industrial base and has been considered an economic and
industrial powerhouse of central China. High technology industries such as Chip-making and
biomedicines are playing a significant part in the economic growth process of the city (Wong et al.
2019). The automobile industry is also playing a vital role in promoting the economic growth process.
Different economic and development zones were established in Wuhan by the government in order
to grow the economy. These zones include the Wuhan East Lake Hi-Tech Development Zone,
Wuhan Economic and Technological Development Zone and Wuhan Wujiashan Economic and
Technological Development Zone. The Wuhan East Lake Hi-Tech Development Zone includes
various important industries such as bio-medical, manufacturing, electronic information and energy
related industries. Similarly, the Wuhan Economic and Technological Development Zone is very
popular for its automobile industry and it successfully created a hundred billion RMB industry in
2010. Similarly, the Wujiashan Economic and Technological Development Zone consists of food
processing and high technology electronical products industries. Some other important industries
such as metallurgical, hydropower, shipbuilding are also located in Wuhan (Bovenkamp and Fei,
2016). Moreover, the economy of Wuhan has also attracted significant foreign direct inflows owing
to the presence of low wages and increased propensity to consume (Miura, 2017). Both low wages
and higher propensity of consumption are indeed the key driving forces of foreign direct investment.
Finally, Wuhan has also attracted investment from 230 Fortune Global 500 firms over the years
(Wong et al. 2019).
The establishment of economic zones have helped the economy of Wuhan a great deal in
subsequent years. The establishment of development and high-technology zones have contributed to
the industrialization process of the Wuhan economy significantly. The report published by Hubei
government in 2013 demonstrated that both development and high-technology zones promoted
industrial growth of Wuhan city and the value of output from high-technology industry reached to
more than 230 billion RMB. Miura (2017) demonstrated that in 2015, the contribution of hightechnology industries in Wuhan’s GDP increased to 20.5 percent which is indeed a reflection of
strong industrial capability of the Wuhan economy. The official report of Hubei government of 2018
reflected that in 2017, the output value of three strategic industries such as IT, health and life and
intelligent manufacturing has been increased by more than 17 percent which is indeed remarkable.
5
This preprint research paper has not been peer reviewed. Electronic copy available at: />
Pr
ep
rin
tn
ot
pe
er
r
ev
iew
ed
Lastly, the Wuhan is also famous for its tourist attractions and in 2014 it earned 28.9 billion dollars
from tourism (Kemp, 2017).
The economic performance of the Wuhan has been phenomenal indeed over the years.
According to the reports of the government of Hubei, the Wuhan economy achieved a growth rate of
7.8 percent in 2019. The economic growth of Wuhan economy is even higher than the national
average growth of Chinese economy. The contribution of high-technology sector and digital
economy was estimated to be 24.5 and 40 percent of the GDP respectively. Similarly, in 2018, the
Wuhan economy grew at a remarkable growth of 10.7 percent and reached to 1484 billion RMB
(Daxueconsulting, 2019). According to statistics, the GDP of Wuhan was 1090.56 billion RMB in
2015 and the growth rate of the economy was 8.8 percent which is indeed a significant improvement
as compared to previous years. The breakdown of GDP shows that the contribution of industrial
sector is 45.7 percent in GDP followed by service sector 51 percent. The share of agriculture sector
in Wuhan GDP is marginal as its contribution is only 3.3 percent. In 2013, Wuhan economy was the
ninth largest urban economy in China as its GDP crossed 900 billion RMB (Ke and Wang, 2016).
The policy makers set targets of achieving GDP worth 1900 billion RMB in 2020 with an ambitious
growth rate of 11 percent (Gain Report, 2018).
Overall, the growth of Wuhan economy is directly linked with the growth of Chinese
economy. Wuhan is considered the industrial, financial and transportation hub of Chinese economy
and therefore, its growth is important for the rest of Chinese economy. Important growth-promoting
industries such as automotive, manufacturing, iron and steel, electronic and food processing are
located in Wuhan. The contribution of Wuhan economy in the overall growth of Chinese economy
is quite substantial. In 2019, the growth of Wuhan economy was higher than the average growth of
Chinese economy. The statistics of 2015 shows that the GDP growth of Wuhan was 8.8 percent
which was highest in Central China and it secured 8th position among 100 major cities in China
(Canada Trade Commissioner Report). Similarly, in 2018, alone the economy of Wuhan achieved a
growth rate of 10.7 percent and its share in the GDP of China increased to 1.6 percent
(Daxueconsulting, 2019). At the same time, it also contributed more than 60 percent to the GDP of
Hubei province (Gain Report, 2018). Further, the statistics of 2018 also revealed that Wuhan’s
economy was the 9th largest in mainland China in absolute terms. Finally, Tan et al. (2014)
highlighted the economic performance of Wuhan economy and further documented that it has played
a noticeable role in the development process of other Chinese cities. To summarize, the economy of
Wuhan has done well economically owing to the presence of sound industrial base. Wuhan has
developed and established well performing economic zones and at the same time have also attracted
world leading firms owing to favorable business conditions. The economic growth of Wuhan has
been remarkable and it has contributed significantly to the overall growth of Chinese economy.
Therefore, the growth performance of Wuhan economy can affect the overall growth of Chinese
economy.
6
This preprint research paper has not been peer reviewed. Electronic copy available at: />
iew
ed
2. An Introduction to The Integral Massive Infections and Contagious Diseases Economic
Simulator (IMICDE-Simulator)
ep
rin
tn
ot
pe
er
r
ev
The primary objective of this paper is to set forth a simulator – The Integral Massive Infections
and Contagious Diseases Economic Simulator (IMICDE-Simulator) – to evaluate an economy in times of
massive infections and contagious diseases. The IMICDE-Simulator is based on seven basic indicators (i) the massive infections and diseases contagious spread intensity (cidc), (ii) the level of treatment and
prevention level (ηtp); (iii) the massive infections and diseases infected causalities (-Lidc); (iv) the
economic wear from massive infections and diseases contagious (Πidc); (v) the level of the massive
infections and diseases contagious multiplier (Midc); (vi) the total economic leaking from massive
infections and diseases contagious (Lidc-total); and (vii) the economic desgrowth from massive infections
and diseases contagious (-δidc). The methodology and approach used in the IMICDE-Simulator applies
different elements from an alternative mathematical and graphical analytical framework. To illustrate
and illuminate the IMICDE-Simulator, we apply the simulator to the case of Wuhan coronavirus. We
believe that our research makes a significant contribution to a more systematic, analytical and
accurate measurement of the economic impact of the massive infectious and diseases contagious
anywhere and anytime.
An important value-added of the IMICDE-Simulator, in the context of contributing to a more
precise understanding of any massive infectious and diseases contagious, is that it accounts for the
uncertainty and behavioural change inherent in new infections and diseases or consolidation of old
infections and diseases respectively. The simulator does so within the theoretical framework of a
Dynamic Imbalanced State (DIS) (Ruiz Estrada and Yap, 2013) and the Omnia Mobilis assumption
(Ruiz Estrada, 2011). The idea is to move beyond classical economic models – e.g. CGE modeling
and any classic econometric modeling – to a new economic mathematical modeling and mapping of
massive infections and diseases contagious - e.g. ex-ante (before the massive infections and diseases
contagious appear) versus ex-post (after the massive infections and diseases contagious appear) – by
utilizing high resolution multidimensional graphs (Ruiz Estrada, 2017) and maps. This alternative
analytical framework can yield interesting and relevant insights which can improve and strengthen
the measurement of the economic effects of any massive infections and diseases contagious.
In this section, we derive the IMICDE-Simulator presents firstly three basic indicators: (i) the
massive infections and diseases contagious spread intensity (cidc); (ii) the level of treatment and
prevention level (ηtp); (iii) the massive infections and diseases infected causalities (-Lidc). The
IMICDE-Simulator uses three different groups of organizations. The first group is the domestic health
organizations –hospitals and agencies- (HDi; i= (1,2,…, ∞)). The second group is the regional health
organizations (HRj; j= (1,2,…, ∞)). The last group is the large international health organizations such
as the World Health Organization (WHO) (HLk; k= (1,2,…, ∞)).
Pr
i. Initial Infection and Contagious Disease Stage
The IMICDE-Simulator assumes that there are four root causes of the infection and contagious
disease: (i) natural disasters (R1); (ii) humans’ disaster (R2); (iii) hybrid disasters – natural and
humans’ disaster together- (R3); and (iv) unknown disasters –non-natural disasters or non-humans’
7
This preprint research paper has not been peer reviewed. Electronic copy available at: />
iew
ed
disaster- (R4). These four factors directly affect “the massive infections and diseases contagious
spread intensity (cidc)”, which is a function of four variables as in (1).
cidc = ƒ(R1, R2, R3, R4)
(1)
So, the following measure is to compute the minimum and maximum level of the massive
infections and diseases contagious spread intensity (cidc) through the application of the first derivative
according to (2) and (3).
ƒ’(cidc) = (∂cidc/∂R1) + (∂cidc/∂R2)+ (∂cidc/∂R3) + (∂cidc/∂R4)
(2)
∆R1→0
∆R2→0
∆R3→0
(3)
ev
ƒ’(cidc) = ∑(lim ∆cidc/∆R1)+ (lim ∆cidc/∆R2)+ (lim ∆cidc/∆R3)+ (lim ∆cidc/∆R4)
∆R4→0
er
r
Moreover, the massive infections and diseases contagious spread intensity (cidc) applies a
second derivative to find the inflection point according to Expression 4.
ƒ”(R1, R2, R3, R4)= (∂2cidc/∂R12) + (∂2cidc/∂R22) + (∂2cidc/∂R32)+ (∂2cidc/∂R42)
(4)
pe
To probe the massive infections and diseases contagious spread intensity (cidc), we apply the
Jacobian determinants under the first-order derivatives (see Expression 5).
∂cidc/∂R1 ∂cidc/∂R2
’
|J |=
∂cidc/∂R3 ∂cidc/∂R4
(5)
tn
ot
On the other hand, the application of the Jacobian determinants under the second-order
derivatives can help to find the inflection point in the massive infections and diseases contagious
spread intensity (cidc) between the two players: (i) the health organizations effectiveness (hospitals
and agencies) (P1) and (ii) all sick patients from a massive infection and disease contagious under
control (P2) see Expression 6.
∂2cidc/∂R3 2 ∂2cidc/∂R42
(6)
rin
| J’’ | =
∂2cidc/∂R12 ∂2cidc/∂R22
Pr
ep
Consequently, the initial massive infections and diseases contagious stage is necessary to
assume that any massive infections and diseases contagious spread intensity (cidc) (endogenous
variable) is going to determine the level of treatment and prevention level (ηtp) (exogenous variable)
in the form of interaction among the domestic health organizations –hospitals and agencies- (HDi; i=
(1,2,…, ∞)), the regional health organizations (RHi; i= (1,2,…, ∞)), and the large international health
organizations such as world health organization (WHO) (HLk; k= (1,2,…, ∞)). In this part of the
IMICDE-Simulator if the massive infections and diseases contagious spread intensity (cidc) is
escalating then the level of treatment and prevention level (ηtp) is going to be more intensive until all
possibilities to eradicate less causalities and potential causalities are exhausted. Hence, the level of
8
This preprint research paper has not been peer reviewed. Electronic copy available at: />
iew
ed
treatment and prevention level (ηtp) depends directly on the massive infections and diseases
contagious spread intensity (cidc) in the short run.
ot
pe
er
r
ev
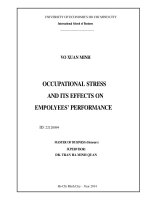
Fig. 2 The Relationship between the massive infections and diseases contagious speed intensity (cidc) and the level of
treatment and prevention level (ηtp)
Source: Authors
ep
rin
tn
Figure 2 shows the relationship between the massive infections and the diseases contagious
spread intensity (cidc) and the level of treatment and prevention level (ηtp). The relationship is a
logarithmic curve in the 2-dimensional Cartesian plane according to Expression 7. The interaction
of three organizations such as the domestic health organizations (DHO), the regional health
organizations (RHO), and the large international health organizations such as world health
organization (WHO) may play a crucial role in the level of treatment and prevention level (ηtp). If
the diseases contagious spread intensity (cidc) rises, then the level of treatment and prevention level
(ηtp) will play an important role in reducing number of causalities from any massive infections and
diseases contagious efficiently according to figure 2.
cidc = xlog2(ηtp) => { ηtp/ηtp : R ∩ DHO, RHO, WHO}
(7)
Pr
ii. The Rapidly Infection and the Disease Contagious Spread Stage
The rapidly infection and the disease contagious spread stage consists of two stages – (i) the
national infection and disease spread stage and (ii) the worldwide infection and disease spread stage.
9
This preprint research paper has not been peer reviewed. Electronic copy available at: />
P1(Rd) ≠ P2(Si)
(8)
iew
ed
ii.a. The National Infection and Disease Spread Stage
In the national infection and disease spread stage, it is necessary to assume that both players
such as (i) the domestic health organizations effectiveness –hospitals and agencies- control a massive
infection and disease contagious (P1) and (ii) all sick patients from a massive infection and disease
contagious under control (P2) have different levels of Respond (Rd) and Safety (Si) [see (8)].
P1(∆cidc) ≠ P2(∆cidc)
ev
Therefore, the massive infections and the diseases contagious spread intensity (cidc) for both
players (P1, P2) have different proportions (∆) according to (9).
(9)
er
r
Nevertheless, the nine variables used by both players (P1, P2) show the different proportions
(∆).
P1(∆cidcrespond) ≠ P2(∆cidcsafety) (10)
ot
pe
In the national infection and disease spread stage, both players fully exist different
proportions of expansion to find its critical point and solve fully complete to cover fully the national
infection and disease spread control. This means that if the massive infections and the diseases
contagious spread intensity (cidc) reaches its maximum limit then the level of treatment and
prevention level (ηtp) success (see Expression, 11).
cidcmax = ƒ’(ηtp) = ∂xlog2(cidc)/∂ηtp > 0
(11)
tn
Accordingly, this part of the IMICDE-Simulator requires the application of a second derivative
to observe the estimate the inflection point.
cidcmax = ƒ”(ηtp) = ∂2xlog2(cidc)/∂ηtp2 > 0
(12)
Pr
ep
rin
ii.b. The Worldwide Infection and Disease Spread Stage
If a worldwide infection and disease spread starts now then the respond (Rd) and safety levels
(Si) needs to take fast actions quickly, butt in different magnitudes [P1 (∆Rd) ≠ P2 (∆Si)]. The diseases
contagious spread intensity (cidc) is going to define the level of treatment and prevention level (ηtp)
worldwide respectively. The massive infections and diseases infected causalities (-Lidc) is calculated
using nine main variables. These nine variables are based on: (i) the late mass media information
systems to the general public (k1); (ii) the limited hospital emergencies access (k2); (iii) the limited
medicine diversity access (k3); (iv) the limited social platform protections access (k4); (v) the higher
water pollution levels (k5); (vi) the higher air pollution (k6); (vii) a poor healthiness measures (k7);
(viii) the limited international health cooperation (k8); and (ix) a basic knowledge of health education
(k9) see Expression 13. The IMICDE-Simulator also assumes that in the long run a high diseases
10
This preprint research paper has not been peer reviewed. Electronic copy available at: />
’
| J (∆K)| =
iew
ed
contagious spread intensity (cidc) is going to define the massive infections and diseases infected
causalities (-Lidc) directly. Hence, an uncontrolled national massive infection and disease contagious
spread albeit to different places worldwide dramatically.
∂k1(t+1)/∂k1(t-1) ∂k2(t+1)/∂k2(t-1) ∂k3(t+1)/∂k3(t-1)
∂k4(t+1)/∂k4(t-1) ∂k5(t+1)/∂k5(t-1) ∂k6(t+1)/∂k6(t-1)
∂k7(t+1)/∂k7(t-1) ∂k8(t+1)/∂k8(t-1) ∂k9(t+1)/∂k9(t-1)
-Lidc = 1 / | J’ (∆K) |
(14)
ev
The final calculation is shown in (14).
(13)
er
r
Therefore, the economic wear from the massive infections and diseases contagious (Πidc)
depends on the changes of the diseases contagious spread intensity (cidc) and the massive infections
and diseases infected causalities (-Lidc) according to expression 15.
Π = ƒ(cidc, -Lidc)
(15)
pe
The final step is to calculate the economic wear from the economic wear from the massive
infections and diseases contagious (Πidc) according to expression 16.
Πidc = [∫∫01 (-Lidc) [∫01 (cidc) dt] dt]
(16)
tn
ot
The next step is to specify the limits of each variable involved in the calculation of the
economic wear from massive infections and diseases contagious (Πidc) – i.e. ensure that the limit is
between 0 and 1.
Πidc = [∫01 -Lidc(cidc)-ntdt = lim -Lidc(cidc)-ntdt]
(17)
Y ->1
ep
rin
To find the present value of the economic wear from massive infections and diseases
contagious (Πidc) under a uniform rate of the diseases contagious spread intensity (cidc) and the
patients’ massive infections and diseases causalities (-Lidc) per year, we assume a continuous discount
rate of –n. Since we simply take the limit of a proper integral in evaluating an improper integral, the
final result is represented in the expression 18.
Πidc = [-Lidc∫01 (cidc)-nt dt = [-1/n (cidc)-nt ]01]
(18)
Y ->1
Pr
We estimate the massive infections and diseases contagious (Πidc) by first-order derivatives
(see Expression 19). At the same time, we apply the second-order derivative on the economic wear
from the massive infections and diseases contagious (Πidc) to find the inflection point see expression
20.
11
This preprint research paper has not been peer reviewed. Electronic copy available at: />
iew
ed
Πidc‘ = ∂Πidc(t)/∂Πidc(t+1) (19)
Πidc” = ∂2Πidc(t)/∂Πidc2(t+1) (20)
Hence, the boundary conditions for the economic wear from the massive infections and
diseases contagious (Πidc) are equal to the expression 21.
Πidc' = ∂Πidc’0/∂T│t=0 = 0, ∂Πidc’1/∂T│t=1 = 1, ∂Πidc’2/∂T│ t=2 = 2, …, ∂ Πidc’∞/∂T│ t=∞ = ∞
(21)
rin
tn
ot
pe
er
r
ev
iii.
Post Massive Infection and Disease Contagious Recovery
Initially, all sick patients from a massive infection and disease contagious (P2) show a
considerable deceleration respectively. Hence, we can calculate the final amount of the massive
infections and diseases causalities (-Lidc) and the economic wear from the massive infections and
diseases contagious (Πidc). The IMICDE-Simulator assumes that all organizations such as national,
regional, and the large international health organizations such as world health organization (WHO)
need to unified efforts will find it difficult to respond from the post massive infection and disease
contagious recovery. The recovery of the economic wear from the massive infections and diseases
contagious (Πidc) from the post massive infection and disease contagious recovery will levy huge
burden to its own economy which will slow down the domestic and global economy. Intuitively,
recovery from the economic wear from the massive infections and diseases contagious (Πidc) needs a
considerable period of time until the infection and disease has a stronger and effective medication
and a massive systematic control of quarantine. To improve the economic wear from the massive
infections and diseases contagious (Πidc) requires a multilateral reconstruction plan, international
assistance, and institutional and society re-organizing in order to rebuild any economy.
In the long run the recovery of all sick patients from a massive infection and disease
contagious can experience different magnitudes (∆). At the same time, this recovery depends highly
on the reduction of the massive infections and diseases causalities (-Lidc). Additionally, the recovery
of all sick patients from a massive infection and disease contagious highly depend on their integral
health system, civil society cooperation, military and emergency forces, and political support until
the massive infections and diseases causalities (-Lidc) is equal or close to zero.
-Lidc = 0 (22)
Pr
ep
iv.
The Level of the Massive Infections and Diseases Contagious Multiplier (Midc)
The level of the massive infections and diseases contagious multiplier (Midc) calculation is equal to
one divided by the final result from the annual population growth rate (∆Pidc-annual) minus the annual
the post massive infection and disease causalities growth rate (∆-Lidc-annual). Subsequently, we can
observe how any massive infection and disease contagious magnitude allows us to elaborate more
elaborated policies using the formula below (see Expression 23):
Midc = 1 / ((∆Pidc-annual) – (∆-Lidc-annual)) (23)
12
This preprint research paper has not been peer reviewed. Electronic copy available at: />
Economic Desgrowth from Infections and Diseases Contagious (-δidc)
In this section, we discuss the concept of the economic desgrowth from massive diseases
contagious (-δidc) (Ruiz Estrada, Yap, and Park, 2014), which plays an essential role in the
construction of the IMICDE-Simulator. The main objective of inclusion of “economic desgrowth from
massive infections and diseases contagious (-δidc)” is to create a health-socio-economic indicator that
can help us to analyze how controlled and non-controlled massive diseases contagious can adversely
affect GDP in the short run. The economic desgrowth from massive diseases contagious diseases
contagious (-δidc) is delineated as “an indicator that can show the impact of any massive infections
and diseases contagious leakage, originated from non-controlled infections and diseases that can bear
on the execution of the final GDP formation into a period of one year”. Additionally, the economic
desgrowth from infections and diseases contagious (-δidc) assumes that there are irregular oscillations
in different periods by applying the simple rule of irregular series. The IMICDE-Simulator assumes
that any infections and diseases contagious is perpetually in a province of constant chaos and subject
to different degrees of infections and diseases contagious ratio coverages. The economic desgrowth
from massive infections and diseases contagious (-δidc) applies different random intervals, which
builds its potential to analyze unexpected shocks from different non-controlled massive infections
and diseases contagious. These are the massive infections and diseases contagious that cannot be
anticipated and monitored easily by traditional methods of linear and non-linear mathematical
modelling. In addition, the IMICDE-Simulator assumes that economic desgrowth from massive
infections and diseases contagious (-δidc) has a substantial connection of total economic leaking from
massive infections and diseases contagious (Lidc-total).
The total economic leaking from massive infections and diseases contagious (Lidc-total) is
based on nine variables: (i) α11 is equal to V1 (food consumption) to the power of ε1 (speed of
consumption growth rate); (ii) α12 is equal to V2 (exports) to the power of ε2 (exports volume
dynamicity growth rate); (iii) α13 is equal to β3 (imports) to the power of ε3 (imports volume
dynamicity growth rate); (iv) α14 is equal to V4 (airways and tourism) to the power of ε4 (arrives to
the country growth rate); (v) α21 is equal to V5 (exchange rate) to the power of ε5 (depreciation growth
rate); (vi) α22 is equal to V6 (government spending) to the power of ε6 (public health spending growth
rate); (vii) α23 is equal to V7 (sells online) to the power of ε7 (customers respond growth rate); (viii)
α24 is equal to by V8 (financial service) to the power of ε8 (stock market performance growth rate);
(ix) α31 is equal to V9 (public services –electricity, water, education) to the power of ε9 (public
services demand growth rate). The final measurement of total economic leaking from massive
infections and diseases contagious (Lidc-total) is derived by applying a large number of multidimensional partial derivatives on each variable (9 variables) to evaluate the changes of each variable
(9 variables) based on the first derivative (between the present year (t+1) and the previous year (t-1)
(see Expression 24).
ΔVi = ∑∂Viε (t+1)/∂Viε (t-1) ≥ R+ ≤ 0 (24)
ep
rin
tn
ot
pe
er
r
ev
iew
ed
v.
Pr
Next step is to convert from ΔViε to ∆Vi-ε (see Expression 25).
[0 ≤ 1/∂Viε ≥ 1] = [0 ≤ ∂Vi-ε ≥ 1]
(25)
13
This preprint research paper has not been peer reviewed. Electronic copy available at: />
iew
ed
Where the exponent –ε can be replaced by any of the eight different exponents in the expression 26.
Vi-ε = (-ε1, -ε2, -ε3, -ε4, -ε5, -ε6, -ε7, -ε8, -ε9)
(26)
Initial conditions ex-ante (see Expression 27) and final conditions ex-post (see Expression 28).
ε1│t-1=0 = 0, ε2│t-1=0 = 0, -ε3│t-1=0 = 0, ε4│t-1=0 = 0, ε5│t-1=0 = 0 ε6│t-1=0 = 0, ε7│t-1=0 = 0, ε8│t-1=0 = 0, ε9│t-1=0 =
0 (27)
ev
ε1│t+1= ∞ = ∞, ε2│t+1= ∞ = ∞, ε3│t+1= ∞ = ∞, ε4│t+1=∞ = ∞, ε5│t+1= ∞ = ∞, ε6│t+1= ∞ = ∞, ε7│t+1= ∞ = ∞, ε8
│t+1= ∞ = ∞, ε9 (28)
er
r
Next step in this part of the IMICDE-Simulator need to run nine first partial derivatives
simultaneously to evaluate all possible changes in each economic leaking from massive infections
and diseases contagious (Lidc-total) in a fixed period of time (one year) according to all expressions
(29), (30), (31), (32), (33), (34), (35), (36), (37).
pe
α’11 = [0 ≥ ∂V1ε1 (t+1)/∂V1ε1 (t-1) ≤ 1] (29); α’12 = [0 ≥ ∂V2ε2(t+1)/∂V2ε2(t-1) ≤ 1] (30);
α’13 = [0 ≥ ∂V3ε3 (t+1)/∂V3ε3(t-1) ≤ 1] (31); α’21 = [0 ≥ ∂V5ε5(t+1)/∂V5ε5(t-1) ≤ 1] (32);
α’22 = [0 ≥ ∂V6ε6 (t+1)/∂V6ε6(t-1) ≤ 1] (33); α’23 = [0 ≥ ∂V7ε7(t+1)/∂V7ε7(t-1) ≤ 1] (34);
α’31 = [0 ≥ ∂V9ε9(t+1)/∂V9ε9 (t-1) ≤ 1] (35); α’32 = [0 ≥ ∂V10ε10(t+1)/∂V10ε10 (t-1) ≤ 1] (36);
α’33 = [0 ≥ ∂V11ε11(t+1)/∂V11ε11(t-1) ≤ 1] (37)
tn
ot
The next step in the calculation of total economic leaking from massive infections and
diseases contagious (Lidc-total) is to calculate the denominator by applying the Jacobian determinant
under the first-order derivatives. At the same time, we apply an inverse matrix according to the
expression 38.
rin
j-1 =
-1
α’11 α’12 α’13
α’21 α’22 α’23
α’31 α’32 α’33
(38)
ep
The final step is to determine the total economic leaking from massive infections and diseases
contagious (Lidc) by dividing 1 by the inverse matrix from expression 46 to the power of 2 refer to
the expression 39.
Lidc = 1/(j-1)2 (39)
Pr
Lastly, it is possible to calculate economic desgrowth from diseases contagious (-δidc) as in
the expression 40.
14
This preprint research paper has not been peer reviewed. Electronic copy available at: />
iew
ed
(40)
ev
The computation of the economic desgrowth from massive infections and diseases contagious
(-δidc) is based on the final GDP in real prices (GDPreal) and the total economic leaking from massive
infections and diseases contagious (Lidc-total) from the expression 40. This part of the IMICDESimulator reminds us that total economic leaking from massive infections and diseases contagious
(Lidc-total) always affects economic desgrowth from massive infections and diseases contagious (-δidc)
behavior according to figure 3.
tn
ot
pe
er
r
Fig. 3 The relationship between the total economic leaking from massive infections and disease
contagious (Lidc) and the economic desgrowth from massive infections and disease contagious (δidc).
Source: Authors
rin
Boundary conditions for economic desgrowth from massive infections and disease
contagious (-δidc) is equal to the expression 41.
-δ’dc = ∂-δ’idc0/∂T│t=0 = 0, ∂-δ’idc1/∂T│t=1 = 1, ∂-δ’idc2/∂T│ t=2 = 2, …, ∂-δ’idc∞/∂T│ t=∞ = ∞
(41)
Pr
ep
On the other hand, the full potential GDP (GDPreal) calculation is shown in the expressions
42 and 43.
Ξ = (-δidc + ∆GDPreal) *-1
(42)
GDPreal = ([1+ Ξ]*∆GDPreal)*100%
(43)
15
This preprint research paper has not been peer reviewed. Electronic copy available at: />
expression 44.
GDPPot = [(GDPreal) - (-δidc)]/100%
iew
ed
Therefore, it is possible to assess full potential GDPPot in real prices (GDPPot) by using the
(44)
The economic desgrowth from massive infections and diseases contagious (-δidc) is based on
the application of the Omnia Mobilis assumption of Ruiz Estrada and Park (2018) to generate the
relaxation of the total economic leaking (Lidc-total) calculation (non-controlled and controlled events)
and the full potential GDP (GDPPot) (see Expression 44).
Pr
ep
rin
tn
ot
pe
er
r
ev
3. The Application of IMICDE-Simulator on the Case of Wuhan, China:
According to the IMICDE-Simulator, it is possible to observe that the massive infections and diseases
contagious speed intensity (cidc) between SARS in year 2003/2004 (Hong Kong (cidc) = 0.53 with a
probability of contagious is equal to P=3/10,000 people) and Coronavirus in year 2020 (Wuhan (cidc)
= 0.77 with a probability of contagious is equal to P=10/10,000 people). This calculation is based on
the number of cases daily in a period of 12 days. On another hand, the massive infections and diseases
contagious speed intensity (cidc) in the case of SARS between domestic expansion (0.37/1) and global
expansion (0.49/1).
However, the massive infections and diseases contagious speed intensity (cidc) in the case of
Coronavirus between domestic expansion (0.77/1) and global (0.35/1), it is mean that SARS shows
a fast expansion globally more than locally and vice versa. Therefore, we can confirm that the
Coronavirus is more deadly than SARS domestically, we can confirm from now anytime can appear
a new virus mutation with more strong defences and a high difficulty to fight and control in areas
with high population concentration.
In the case of the level of treatment and prevention level (ηtp) between SARS in year 2003/2004
(Hong Kong (ηtp) = 0.82 with a capability to attend cases of 6 beds/for each 1,000 people) and
Coronavirus in year 2020 (Wuhan (ηtp) = 0.39 with a capability to attend cases of 2 beds/for each
10,000 people). We can observe that main land China is not prepared for an immediately massive
infections and diseases contagious action plan and infrastructure. Only, recently the Chinese government is
building a mega hospital in few days at Wuhan to attend more cases with Coronavirus. Hence, the patients’
massive infections and diseases infected causalities (-Lidc) between SARS in year 2003/2004 (Hong
Kong (-Lidc) = 0.43 with a probability of SARS causalities is equal to P=1 causality/100,000 people)
and Coronavirus in year 2020 (Wuhan (-Lidc) = 0.73 with a probability of Coronavirus causalities is
equal to P=3 causalities/10,000 people) respectively.
The economic wear from massive infections and diseases contagious (Πidc) between SARS in year
2003/2004 (Hong Kong (Πidc) = 0.24 and Coronavirus year 2020 (Wuhan (Πidc) = 0.64. We can
observe that the impact of Coronavirus in year 2020 is going to have 3 times more negative impact
on the Chinese economy than SARS in year 2003/2004 according to our results. Subsequently, the
level of the massive infections and diseases contagious multiplier (Midc) between SARS in year
2003/2004 (Hong Kong (Midc) = 0.35 and Coronavirus year 2020 (Wuhan (Midc) = 0.75. These results
16
This preprint research paper has not been peer reviewed. Electronic copy available at: />
er
r
ev
iew
ed
can show us the magnitude of any massive infections and diseases contagious multiplier effect and its
impact on the short run anywhere and anytime.
In fact, the total economic leaking from massive infections and diseases contagious (Lidc-total) show
that between SARS in year 2003/2004 (Hong Kong (Lidc-total) = -0.15 and Coronavirus in year 2020
(Wuhan (Lidc-total) = -0.45. It is mean that by each one percent of the GDPfull-potential growth rate of
China in the present year, China can lose easily approximately -0.45 per a unit of growth rate.
Additionally, we can observe the next results using the nine sub-variables of (Lidc-total): (i) food
consumption = -0.39; (ii) exports = -0.35; (iii) imports = +0.35; (iv) airways and tourism = -0.75; (v)
exchange rate = -0.35; (vi) government spending = +0.45; sells online = -0.37; (viii) financial service
= -0.55; (ix) public services = -0.35. Finally, the economic desgrowth from massive infections and
diseases contagious (-δidc) between SARS in year 2003/2004 (Hong Kong (-δidc) = -0.17 and
Coronavirus year 2020 (Wuhan (-δidc) = -0.45). According to our calculations, China economy can
drop its GDP (year 2019) = US$ 14.30 trillion dollars (GDPreal-price = 6.2%) to GDP (year 2020) = US$ 10.00
trillion dollars (GDPreal-price = 4.3%) (see Figure 4). We predict that China can lose from its GDPrealprice between 1.9% to 2%.
Pr
ep
rin
tn
ot
pe
4. Conclusions
The Wuhan Coronavirus is a major infections and diseases contagious in Asia with outsized
economic repercussions for the Chinese economy. The Chinese economy is the second biggest
economy within the European Union (EU) and U.S., a global trade and manufacturing center. The
uncontrolled Wuhan Coronavirus is still unclear at the time of this writing. Assessment of the
potential economic effects of Wuhan Coronavirus is unpredictable and inconsistent to calculate the
final impact on the Chinese economy and globally. More recently, in line with China emergence as
a globally significant economic power, China has become a major trade partner of the world
economy, which are semi-open and highly integrated into the global economy.
The central objective of this paper is to empirically assess the effect of Wuhan Coronavirus on
the Chinese trade and financial markets. To do so, we develop a new simulator – the IMICDESimulator (The Integral Massive Infections and Contagious Diseases Economic Simulator). The
simulator is based on seven main indicators, namely (i) the massive infections and diseases
contagious speed intensity (cidc), (ii) the level of treatment and prevention level (ηtp); (iii) the patients’
massive infections and diseases infected causalities (-Lidc); (iv) the economic wear from massive
infections and diseases contagious (Πidc); (v) the level of the massive infections and diseases
contagious multiplier (Midc); (vi) the total economic leaking from massive infections and diseases
contagious (Lidc-total); and (vii) the economic desgrowth from massive infections and diseases
contagious (-δidc). To assess the impact of Wuhan Coronavirus on the Chinese economy, we use the
IMICDE-Simulator to analyze and compare pre-massive infections and diseases contagious spread
versus post- massive infections and diseases contagious spread. The comparative analysis indicates
that Wuhan Coronavirus will have a deep negative economic effect on the Chinese economy. More
precisely, our simulation results indicate that the Chinese GDPreal-prices falls from (GDP (year 2019) =
US$ 14.30 trillion dollars and GDPreal-prices = 6.2%) to (GDP (year 2020) = US$ 10.00 trillion dollars and
GDPreal-prices = 4.3%) (See Figure 4). In addition, the Wuhan Coronavirus will affect the economic
17
This preprint research paper has not been peer reviewed. Electronic copy available at: />
ev
iew
ed
growth of East Asia and Southeast Asia considerably. Finally, it is important to note that the
IMICDE-Simulator represents a useful new analytical tool which can help policymakers and
researchers evaluate the effect of massive infections and diseases contagious on the economy,
international trade and financial transactions domestically and globally. The small amount of
economic studies about the impact of massive infections and diseases contagious and its impact on
the economic performance in the short run, however, important in that they highlight the areas that
are disproportionately prone to be evaluated deeply, such as the role of relationship between health
prevention programs and healthiness systems because of the uncertainty of appearance of any
massive infections and diseases contagious anytime and anywhere. To engage civil society,
government, and private sector to planning and coordinate dynamic and suitable programs to
monitoring massive infections and diseases contagious just at time should be implemented.
rin
tn
ot
pe
er
r
Fig. 4 the Visualization of the Chinese GDP after Coronavirus effect between year 2019 and year
2020.
Source: (Ruiz Estrada, 2017)
ep
5. References
Asian Development Bank (2020). Database. Online available at: Accessed on
05/02/2020.
Bovenkamp, J. & Fei, Y. (2016). Economic Overview of Hubei Province. Netherland Enterprise
Agency. Online available at: Accessed on 31/01/2020.
Pr
Canadian Trade Commissioner Service (2016). Economic Profile of China’s Hubei Province.
Online available at: Accessed on 29/01/2020.
18
This preprint research paper has not been peer reviewed. Electronic copy available at: />
iew
ed
Centers for Disease Control and Prevention (2014). Types of Influenza Viruses. Available online:
(accessed on 31 January 2020).
Cheng, J., & Zhou, J. (2015). Urban growth in a rapidly urbanized mega city: Wuhan. In Urban
Development Challenges, Risks and Resilience in Asian Mega Cities (pp. 301-322). Springer, Tokyo.
Cockburn, W.C.; Delon, P.J.; Ferreira, W.( 1969). Origin and progress of the 1968–69 Hong Kong
influenza epidemics. Bull. World Health Organ. 41, 345–348.
ev
Cowley, R., Caprotti, F., Ferretti, M. and Zhong, C. (2018). Ordinary Chinese Smart Cities: The Case
of Wuhan. In Karvonen, A., Cugurullo, F. and Caprotti, F. (eds) Inside Smart Cities: Place, Politics
and Urban Innovation. London: Routledge, pp.45-64. ISBN: 978-0815348689.
Daxueconsulting (2019). The economy of Wuhan: A hub of commerce, education, industry and
politics. Online available at: Accessed on 1/2/2020.
er
r
Fukumi, H. (1959). Summary report of the Asian influenza epidemic in Japan, 1957. Bull. World
Health Organ, 20, 187–198.
Gain Report. (2018). Emerging City Market Report-Wuhan. Report No. CH178043. Online available
at: Accessed on 29/01/2020.
pe
Guan, Y.; Yikaykrishna, D.; Bahl, J.; Zhu, H.; Wang, J.; Smith, G.J.( 2010). The emergence of
pandemic influenza viruses. Protein Cell, 1, 9–13.
Han, S. S., & Wu, X. (2004). Wuhan. Cities, 21(4), 349-362.
Hubei
Government
ot
Henderson, D.; Courtney, B.; Inglesby, T.; Toner, E.; Nuzzo, J. (2009). Public health and medical
responses to the 1957–58 influenza pandemic. Biosecur. Bioterror. 7, 265–273.
Report
(2018).
Government
work
report.
Online
available
at:
Accessed on 2-2-2020.
tn
Hubei Government Report (2013). Basic Economic Statistics of Hubei. www.hubei.gov.cn.
Accessed on 31/01-2020.
rin
Humphries, M. (2013). Paths of infection: The First World War and the origins of the 1918 influenza
pandemic. War Hist. 21, 55–81.
Johnson, N.; Mueller, J.( 2002). Updating the accounts: Global mortality of the 1918–1920 “Spanish”
influenza pandemic. Bull. Hist. Med. 76, 105–115.
ep
Jordan, E.O.( 1927). Epidemic Influenza: A Survey; American Medical Association: Chicago, IL,
USA.
Ke, Q., & Wang, W. (2016). The factors that determine shopping center rent in Wuhan,
China. Journal of Property Investment & Finance.
Pr
Kuszewski, K.; Brydak, L. (2000). The epidemiology and history of influenza. Biomed. harmacother.
54, 188–195.
19
This preprint research paper has not been peer reviewed. Electronic copy available at: />
iew
ed
Langmuir, A.D. (1961). Epidemiology of Asian influenza. Am. Rev. Respir. Dis. 83, 2–18.
Longini, I.; Fine, P.; Thacker, S.T. (1986). Predicting the global spread of new infectious agents. Am.
J. Epidemiol. 123, 383–391.
Miura, Y. (2017). China’s Economy. Mizuho China Monthly. Available online at :
Accessed
on 1-2-2020.
Patterson, K.D.; Pyle, G.F.( 1991). The geography and mortality of the 1918 influenza pandemic.
Bull. Hist. Med. 65, 4–21.
ev
Payne, A.M.( 1958). Symposium on the Asian influenza epidemic. Proc. R. Soc. Med. 51, 1009–
1015.
er
r
Potter, C.( 1998). Chronicle of influenza pandemics. In Textbook of Influenza; Nicholson, K.G.,
Webster, R.F., Hay, A.J., Eds.; Blackwell Science LTD: Oxford, UK.
Pyle, G.F.( 1986). The Diffusion of Influenza: Patterns and Paradigms; Rowan & Littlefield:
Totowa, NJ, USA.
pe
Reperant, L.; Moesker, F.M.; Osterhaus, A.D.( 2016). Influenza: From zoonosis to pandemic. Eur.
Respir. Soc. J. 2, 1–4.
Ruiz Estrada, M.A. (2011). “Policy Modeling: Definition, Classification and Evaluation”, Journal
of Policy Modeling, 33(4): 523-536.
ot
Ruiz Estrada, M.A. and Yap, S.F. (2013) ‘The Origins and Evolution of Policy Modeling’. Journal
of Policy Modeling. 35(1): 170-182.
tn
Ruiz Estrada, M.A., Yap, S.F., Park, D. (2014) ‘The Natural Disasters Vulnerability Evaluation
Model (NDVE- Model): An Application to the Northeast Japan Earthquake and Tsunami of March
2011. Disasters.’. Disasters. 38(S2): s206-s229.
Ruiz Estrada, M.A. (2017). “An Alternative Graphical Modeling for Economics:
Econographicology”, Quality and Quantity, 51(5): 2115-2139.
rin
Ruiz Estrada, M.A. Park, D., (2018). “The Past, Present, and Future of Policy Modeling”, Journal
of Policy Modeling, 40(1): 1-15.
ep
Smith, G.J.; Vijaykrishna, D.; Bahl, J.; Lycett, S.; Worobey, M.; Pybus, O.G.; Ma, S.K.; Cheung,
C.L.; Raghwani, J.; Bhatt, S.; et al.( 2009). Origins and evolutionary genomics of the 2009 swineorigin H1N1 influenza a epidemic. Nat. Med. 459, 1122–1125.
Tan, R., Liu, Y., Liu, Y., He, Q., Ming, L., & Tang, S. (2014). Urban growth and its determinants
across the Wuhan urban agglomeration, central China. Habitat International, 44, 268-281.
Pr
Waring, J. (1971). A History of Medicine in South Carolina; South Carolina Medical Association:
Columbia, SC, USA.
20
This preprint research paper has not been peer reviewed. Electronic copy available at: />
iew
ed
Webby, R.( 2003). Webster, R. Are we ready for pandemic influenza. Science, 302, 1519–1522.
WHO. (2020). Coronavirus. Retrieved from />Worldometer. (2020). WUHAN CORONAVIRUS OUTBREAK. Retrieved
o/coronavirus/
from
Wong, P., Lin, M. C., & Jackson, J. (2019). Best-Performing Cities. Milken Institute
Reports. Available at: (accessed
31/01-2020).
ev
Wu, F., Li, Z., Deng, N., & Wei, J. (2005). Economic development and eco-environment protection
in central China-The case of Wuhan city. Fresenius Environmental Bulletin, 14(11), 1077-1080.
Wuhan Municipality (2019). Wuhan Overview. Online available at:
Accessed on 2-2-2020.
Pr
ep
rin
tn
ot
pe
er
r
Zambon, M.( 1999). Epidemiology and pathogenesis of influenza. J. Antimicrob. Chemother. 44, 3–
9.
21
This preprint research paper has not been peer reviewed. Electronic copy available at: />