Measuring of the value electronic word of mouth and its impact on consumer communities
Bạn đang xem bản rút gọn của tài liệu. Xem và tải ngay bản đầy đủ của tài liệu tại đây (489.17 KB, 17 trang )
MEASURING THE VALUE OF
ELECTRONIC WORD OF MOUTH
AND IT’S IMPACT IN CONSUMER
COMMUNITIES
Dwyer, Paul (2007), Journal of Interactive Marketing 21 (2)
Marketing practitioners have recognized a need to measure customer-generated media in
addition to the traditional marketing metrics. Message boards, chat rooms, blogs, and virtual
brand communities have become important venues for customer-generated media. These
communities can be modeled as two distinct, albeit connected, networks: social and
informational. These networks change over time under the influence of online word of mouth.
This study introduces an adaptation of PageRank (APR), a new metric for measuring the value a
community assigns each word-of-mouth instance and the value the community assigns to the
members that create them. That metric is used to empirically support a model explaining how
highly-valued information builds the social network. These communities are egalitarian in
assigning value to informational content, without regard to the status of its source, and highlyvalued content explains 10% of social network growth.
PAUL DWYER
is a doctoral student in the
Department of Marketing at Texas
A&M University, College Station,TX;
e-mail:
Electronic
Electroniccopy
copyavailable
availableat:
at: /> />
Journal of Interactive Marketing
DOI: 10.1002/dir
“
There go the people. I must follow them,
for I am their leader.”
—Alexandre Ledru-Rollin
Jim Nail (2005) of Forrester Research recently reported
that VNU, a large market and media research company, purchased a stake in BuzzMetrics, a word-ofmouth measurement startup. He interpreted this
move as a signal that the measurement of consumer1generated media (refer to the Appendix for a glossary
of italicized terms) was becoming as important as traditional market research methods. BuzzMetrics
recently expanded its practice by offering a research
service that monitors the millions of TV viewers who
converse over the internet in virtual communities
such as chat rooms, message boards, and blogs (or,
weblogs). BuzzMetrics performs both a qualitative and
quantitative analysis of this online word of mouth
because they believe it provides a more complete
understanding of viewer involvement than any alternative research method. The Advertising Research
Foundation, American Association of Advertising
Agencies, and Association of National Advertisers
seem to recognize that existing ways of inferring
product involvement are inadequate as they have
announced a joint-venture to define a “consumer
engagement” metric to complement traditional exposure metrics (such as Nielsen ratings). Academic
research, such as Wang and Fesenmaier (2003) and
Richins et al. (1992), supports the BuzzMetrics
approach of inferring “consumer engagement” by
measuring word of mouth.
Even though the Internet abounds in customergenerated media, most of it receives little attention.
Current measures of word of mouth focus on quantity;
there is a need for quantitative measures of impact or
importance. This paper addresses this issue. Word of
mouth is a network phenomenon: People create ties to
other people with the exchange of units of discourse
(that is, messages) that link to create an information
network while the people create a social network
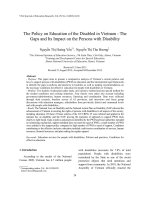
(Figure 1). As a result, this paper proposes a metric
1
Although the term “consumer” is used throughout the paper, the
term “customer,” as used in a B2B context, could be substituted as
the principles are equally applicable.
64
for word-of-mouth importance and investigates the
impact of highly valued discourse on the evolution of
online community social networks.
THEORETICAL BACKGROUND
General Network Typology
Newman (2003) lists four types of networks: social,
informational, technological, and biological. He defines
a social network as a set of people or groups with
some pattern of contact or interaction between them.
Social networks have been heavily studied by sociologists and marketing scholars. Most of these studies
are like the Reingen et al. (1984) exploration of brand
use commonality in a sorority: The sample size
is small, the data are qualitative, and the network
is analyzed as a static snapshot of its state at one
particular time. More extensive studies include a
study by Ebel et al. (2002) of email communications
between 5,000 students at Keil University and an
examination by Holme et al. (2004) of an online dating
community. Holme et al. (2004) performed one of the
few analyses documenting how a social network structure changes over time.
Informational networks are a way of modeling how
separate pieces of related information fit together.
The most often cited example of such a network is the
citation network of scientific papers as examined by
Price (1965) where the nodes of the network are journal articles and the ties between nodes indicate that
one paper cited another. Burnett (2000) pointed out
that virtual communities are both social and informational networks. Not only do units of discourse
create an information network while people create
a social network, but the content of community
messages can be classified as informational, social, or
indeed both.
Brand and Virtual Communities
as Social Networks
Boorstin (1974) described invisible communities of
consumption evolving after the industrial revolution.
He observed that community, once exclusively based
on geographic, political, or religious similarity, began
to be based on commonalities in product use. Schouten
and McAlexander (1995) described a more visible subculture of consumption in their immersive study of
JOURNAL OF INTERACTIVE MARKETING
Electronic
Electroniccopy
copyavailable
availableat:
at: /> />
Journal of Interactive Marketing
DOI: 10.1002/dir
FIGURE 1
Virtual Community as a Dual Network
Harley-Davidson owners. Even though Reingen et al.
(1984) did the first study of commonalities in brand
use within a social network, Muniz and O’Guinn
(2001) suggested the first model of a consumer or
brand community that was also a social network.
Rheingold (1993) introduced the idea of a virtual community in his discourse about his activities with the
WELL, a pioneering computer conferencing system
that allowed people from around the world to
participate in public conversations and exchange electronic mail. Wellman and Gulia (1999) performed the
first social network analysis of a virtual community.
Dholakia et al. (2004) recognized virtual communities
as consumer groups of varying sizes that connect and
interact online for the purpose of meeting personal
and shared goals. A brief perusal of the virtual communities hosted by Yahoo! reveals that many of these
communities thrive exclusively on the discussion of
specific products or product types and are thus both
brand and general consumption communities.
Involvement
This study embraces prior research that found word
of mouth to be motivated by involvement; however, it
does not seek to prove any such relationship. I adopted
Zaichkowsky’s (1985) definition of involvement as “a
person’s perceived relevance of the object based on
inherent needs, values, and interests.” She created
the highly used Personal Involvement Inventory, a
20-item scale to measure an individual’s involvement
with a product, advertisement, or purchase decision.
She found that a measure of high involvement on her
scale correlated with an interest in reading more
about the product, a process of detailed product comparison before purchase, and the eventual purchase of
a product.
This research adopts a broader focus than Zaichkowsky
(1985), which was primarily on the purchase decision.
I suggest that the resources of an online community can
be used by prospective buyers not only to facilitate
information gathering but also to connect with a community of users to enhance their enjoyment after
purchasing and using a product. A central premise of
this study is that community participation is directly
correlated to involvement; this is consistent with
Zaichkowsky’s (1985) findings in that high prepurchase
community participation is the online representation of
the information search process she described.
MEASURING THE VALUE OF ELECTRONIC WORD OF MOUTH
Electronic copy available at: />
65
Journal of Interactive Marketing
DOI: 10.1002/dir
Involvement and Word of Mouth
Holmes and Lett (1977) found that product usage and
purchase intention, both signs of product involvement, resulted in word-of-mouth behavior. Houston
and Rothschild (1978) were the first to distinguish
between enduring involvement and the situational
involvement that surround a purchase. They also
found that the highly involved excitement of a purchase dissipates over time. Their findings have been
generally supported, albeit with some modification,
by the work of later researchers such as Richins et al.
(1992). Word of mouth is a common example of an
involvement response.
Houston and Rothschild (1978) stated that external
stimuli (for example, a new dishwasher was sought
because the old one was beyond repair) cause situational involvement, and internal factors (such as a high
linkage between product use and personal happiness)
cause enduring involvement. Wang and Fesenmaier
(2003) found that enduring involvement was the major
reason for online community participation. Wang and
Fesenmaier (2003) found the secondary motives of
seeking benefits for oneself (for example, information)
and offering help to others to be the other important
precursors of community word of mouth.
Network Dynamics
Holme et al. (2004) demonstrated that network dynamics can be observed by doing a time series analysis of
the metrics used to measure static networks. The
models that explain how networks change are of two
types: growth and destruction.
Price (1965) and Barabasi and Albert (1999) presented
variations on a preferential attachment model, the principal explanation for how networks grow. In this model,
network nodes that already have a lot of ties are the
most likely attachment points for new network members. It is a “rich get richer” model of network growth.
Lazarsfeld and Merton (1954) defined a secondary
dynamic: homophily, which means like nodes will be
attracted and create ties. The two dynamics have been
combined to suggest that highly connected nodes are
attracted to highly connected nodes. The chief limitation to these models is that they do not explain network
decay.
66
Destruction models seek to explain how a network can
be weakened by the deletion of nodes to the point of
making communication through the network impossible. Albert et al. (2000) found that removing important
nodes had a devastating effect on communication flow.
Holme et al. (2002) expanded this area of study by
looking at how the removal of key ties also can have a
devastating effect. Newman (2003) pointed out that this
research has been directed at assessing the resilience
of the Internet to the failure of the computers that
are its nodes. Carley et al. (2001) applied the destruction research to terrorist networks, speculating that
the leaders of the decentralized terrorist networks
would not be found by looking for the people with the
most ties; rather, they would be the individuals with
“high cognitive load,” who emerge as leaders because
they delegate tasks and are more likely to have expert
power.
Unlike terrorist and technological networks, consumer
networks are not subject to attack. They do, however,
exhibit decay, possibly due to the dissipation of
involvement. This phenomenon was noticed by Holme
(2003) in his study of dating networks. He noticed that
ties decay exponentially as time goes on because of
decreasing contact.
Centrality, Prestige, and PageRank. Wasserman
and Faust (1994) define two measures of network
node importance: centrality and prestige. Centrality
can be simply defined as the number of nodes to
which a given node is connected. Prestige is a variant
of centrality where a node has many incoming ties but
is very selective in initiating ties with others. In a virtual community network a member gains prestige by
posting messages that inspire others to post replies,
thus creating incoming ties.
Burnett (2000) recommends using content analysis to
determine the importance of the text messages posted
to online communities. However, he admits that it is
extremely difficult to specify a criterion for importance. Google, the Internet search engine, was faced
with a similar problem when they wrestled with the
problem of listing Web pages returned from a search
in order of decreasing importance. They decided to
adopt a very populist criterion for importance: the
Web pages that were linked to the most were the most
JOURNAL OF INTERACTIVE MARKETING
Electronic copy available at: />
Journal of Interactive Marketing
important. This PageRank algorithm also factors in
the concept of prestige, where page importance is
decreased in proportion to the number of links to
other pages, and inheritance effects, where some of
the importance of incoming links increases the importance of the page being assessed.
According to Bianchini et al. (2005), the PageRank (xp)
of page p is computed by taking into account the set of
pages (pa[p]) pointing to p
xp ϭ d
qʦ
xq
ϩ ( 1 Ϫ d)
pa[ p] hq
a
(1)
where d ʦ (0,1) is a proportioning factor and hq is the
outdegree of q, the number of links coming out from
page q. The proportioning factor determines the amount
of importance added to p by the pages linking to it.
Page p has an inherent importance of 1 Ϫ d. The outdegree parameter addresses the prestige issue, reducing the inherited importance of pages that link to other
pages.
When PageRank is applied to information and social
networks, outdegree is very difficult to assess. We do
not know if the author of a message drew on the expertise of another person when composing its content. If
DOI: 10.1002/dir
a message is a reply to another message, it can be
assumed that the original message provided some
inspiration for the content of the reply. However, if a
message begins a new topic of discourse, then this
study assumes the source of its ideas to be the author
alone. In this study the outdegree parameter is set at
two (2) in the case of a reply and unity (1) otherwise.
Since Google does not reveal the value it assigns to
the proportioning factor, this study arbitrarily uses
d ϭ 0.15 in its adaptation of PageRank.
Applying this adapted PageRank (APR) to the information network recognizes that the value, or knowledge
capital, of a message or information node is not only
a function of its own inherent value but also the
value of information nodes derived from or inspired
by it. The sum of the individual message APRs yields
a measure of the whole community’s knowledge capital. Similarly, in the social network, APR measures
both collective and individual social capital by
aggregating the importance of members’ personal
contributions and the effect of having important
associates.
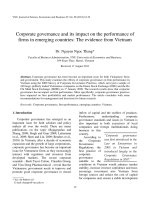
Figure 2 vividly shows how centrality-based (that is,
the number of immediate connections) measures of
FIGURE 2
Centrality versus APR
MEASURING THE VALUE OF ELECTRONIC WORD OF MOUTH
Electronic copy available at: />
67
Journal of Interactive Marketing
DOI: 10.1002/dir
importance are conceptually inferior to the APR metric.
Using centrality, informational node A would be ranked
twice as important as node B even though node B is
the basis for a much larger information network.
The Role of Trust. Even the limited sample of communities used in this study highlights the diversity of
subject matter around which online communities form.
Some of the content posted to these communities may
form the basis for consumer decisions, such as product
purchases, or may involve the revelation of personal
information—all acts that entail risk. Bart et al. (2005)
note that community features are a factor driving
trust in Web sites, especially those characterized by
information risk (the risk associated with revealing
personal information). They propose that “shared
consciousness and a sense of moral responsibility
and affinity enhance the consumer’s level of trust” and
may make consumers more confident in acting on
information gained from online communities. While
beyond the scope of this study, it would be interesting
to know whether the APR estimations of knowledge
and social capital reflect the level of trust readers
place in contributing members and their content. It
would also be interesting to assess the role of trust as
another mechanism of preferential attachment.
Another factor that might influence trust-building is
the appearance of the online community Web site.
Schlosser et al. (2006) found that consumers trust the
information contained on Web sites that look like they
required a high degree of investment to create. While
their study did not specifically involve community
Web sites, it is possible that the effect they observed
is a general phenomenon that is transferable. The
people contributing information to an online community may be granted credibility by the appearance of
the Web site even though they have no connection to the
company that hosts the community. It is also reasonable to speculate that a community Web site that
looks like it required a high level of investment may
keep people involved in the community longer, opposing the process of decay.
PURPOSE
Based on the theoretical background presented here,
this study proposes the model of Figure 3 to explain
some of the dynamics of network growth and decay.
68
The first phase of this study strives to validate the
APR metric. I have described how the APR metric is a
conceptually superior measure of information and
social network importance compared to the prevalent
metric of centrality (counting immediate connections). This study is designed to demonstrate a practical difference between the two metrics by showing
how they answer a question concerning the central
influence in preferential attachment: Is preferential
attachment (network members deliberately creating
ties with each other) driven by homophily (a desire to
be associated with similar people) or expert power (a
desire to be associated with experts)? In so doing, this
study tests the hypothesis that the APR metric is
merely a reflection of authored message volume and
longevity of community participation rather than a
measure of the community’s appreciation of that participation. The second phase of this study uses the
APR as a measure of knowledge capital to determine
the role highly valued content in the informational
network has in opposing decay (loss of members) in
the social network.
DATA
The archives (October 1998 to February 2006) of 10
product-oriented Yahoo! groups (Table 1) were used to
construct the social and informational networks studied. The data are therefore observational rather than
experimental. In each case the entire population of
data for each group is used. Figure 4 includes a sample
TABLE 1
Data Sources
GROUP
TYPE
1ALL_ROSWELL
2004-Prius
TV – Roswell
Brand – Automobile
2227
2517
27960
42419
7th_heaven
burningman-bcwa
cb-750
TV – 7th Heaven
Brand – Annual Event
Brand – Motorcycle
912
789
4541
6311
18291
93134
jumptheshark
SimWatch
sportsterowners
TV – Generic
Brand – Computer Game
Brand – Motorcycle
1124
4303
1630
53514
40944
36900
TheWestWing
x-files
TV – The West Wing
TV – X Files
1160
1655
12887
28844
20858
361204
Total
JOURNAL OF INTERACTIVE MARKETING
Electronic copy available at: />
MEMBERS
MESSAGES
Journal of Interactive Marketing
DOI: 10.1002/dir
FIGURE 3
Conceptual Model of Consumer Network Dynamic
screen shot from the Yahoo! archives that indicates
the author of each message, the date posted, and the
thread hierarchy of messages and their replies (for
example, message 18370 is a reply to message 17870).
This allows a knowledge network for each group to be
constructed in addition to a social network between
authors. These groups were selected in a purposive
manner to allow a study of large, highly active groups
with wide diversity in their underlying subject matter
and large volumes of messages.
DIRECTED ACYCLIC GRAPHS
The analyses used in this study refer to the methodology of Glymour et al. (1987) for directed acyclic graphs
(DAGs). This methodology uses the correlation between
variables and any knowledge of temporal relationships
to construct a diagram of nodes, representing variables,
and arcs, representing causal dependency among the
variables. These diagrams must then be compared with
known theory as a litmus test for their validity. Once
such a diagram has been accepted as theoretically
correct, then the same techniques used to calculate
parameter values and fit in structural equation models
(SEM) can be used.
In both the DAG and SEM methodologies, the modeler examines past research to gain some insight
into how the variables being studied interrelate.
The DAG methodology uses artificial intelligence
techniques to examine the data gathered and to propose relationships between variables. In addition
to a correlation matrix, these artificial intelligence
algorithms also accept metadata describing prior
knowledge, such as what relationships must exist
based on theory and how these variables relate
MEASURING THE VALUE OF ELECTRONIC WORD OF MOUTH
Electronic copy available at: />
69
Journal of Interactive Marketing
DOI: 10.1002/dir
FIGURE 4
Sample Yahoo! Forum Screen Shot
temporally (that is, one variable changed before
another it affects).
There is no universally accepted methodology for the
artificial intelligence algorithms that underlie DAGs.
This study uses one of the best-supported methodologies, proposed by Glymour et al. (1987). Their methodology begins by assuming no relationship between the
variables in the model and then uses F-tests, a correlation matrix, and prior knowledge metadata to find
the relationships supported by the data.
The DAG methodology is similar to exploratory factor
analysis in that it can provide insight where prior
TABLE 2
The Extent That Attaching to the Top 5%
Explains New Message Attachment
PERCENTAGE OF MESSAGES ATTACHING
FORUM
TO THE TOP 5%
APR
CENTRALITY
KN
SN
KN
SN
1ALL_ROSWELL
2004-Prius
79.7
55.0
27.9
12.9
43.0
30.8
13.1
25.3
7th-Heaven
burningman-bcwa
cb-750
71.3
59.7
68.7
13.7
26.6
21.9
23.1
18.5
17.9
19.6
43.4
32.3
jumptheshark
SimWatch
sportsterowners
70.3
68.4
71.0
35.5
22.3
17.1
22.6
29.2
25.1
51.0
26.8
48.3
TheWestWing
x-files
65.7
69.9
12.1
14.2
21.4
24.1
30.3
28.3
Mean
68.0
20.4
25.6
31.8
theory is lacking or ambiguous. A full explanation of
the DAG methodology is beyond the scope of this paper.
Glymour et al. (1987) is a good introduction for the interested reader. This methodology is growing in use and is
extremely powerful in its ability to provide insight.
METHOD AND DISCUSSION
Phase One: Validation of the APR
Is There a Difference? The first phase of this study
was designed to validate the superiority of the APR
algorithm in demonstrating preferential attachment
compared to the prevalent centrality-based method.
I calculated the APR and centrality for each message
and its author and then ranked each message in turn
by each of those four categories in descending order.
These calculations were done using a PC with a
2.0 MHz AMD 64-bit processor and 1.5 gigabytes of
RAM. It took approximately three (3) hours to perform these calculations for the 1ALL_ROSWELL community. I then took the messages in the top 5% of each
ranking and found the percentage of all messages that
got attached to them. Tables 2 and 3 summarize the
results. T-tests were used to show where there are significant differences in the use of the two methodologies
across the two networks (Table 3). Table 3a shows
TABLE 3
(a)
(a) and (b) Differences in Methods
Across Networks
KN vs. SN
(b)
APR
t ϭ 17.48, r Ͻ 0.01
KN
t ϭ 17.39, r Ͻ 0.01
Centrality
t ϭ Ϫ1.12, r ϭ 0.29
SN
t ϭ Ϫ3.06, r ϭ 0.01
KN ϭ Knowledge/Information network, SN ϭ Social network.
70
JOURNAL OF INTERACTIVE MARKETING
Electronic copy available at: />
APR vs. CENTRALITY
Journal of Interactive Marketing
that centrality is unable to detect a difference between
attaching messages to the top 5% of the social network
and attaching messages to the top of the knowledge
network. Table 3b shows there is a significant difference between the ways the two methods measure
attachment in the social and knowledge networks.
The APR metric shows that message posters are drawn
to reply to information of highest value to the group,
regardless of who the author is, while centrality is
unable to make any such distinction.
Volume, Duration, or Quality? When message
APRs are converted to z-scores to remove the influence
of network size every message that attains a top 5%
APR fits a curve of the form presented in Figure 5
DOI: 10.1002/dir
with an R2 Ͼ 0.8. Observe how these messages attract
comment early and quickly build their APR score.
As already described, an individual’s social capital
APR is a function of the number of messages authored,
both new threads of discussion (“seeds”) and contributions to existing threads (“replies”). It would be logical to
suggest that social capital APR might also be a function of duration of participation. If social capital APR
is a true representation of the quality of a member’s
contributions, then it is necessary to show that this
metric is not purely a function of the volume of messages posted and length of community membership.
Figure 6 shows how one individual’s social capital
FIGURE 5
The Typical Pattern of Message Knowledge Capital Accrual
FIGURE 6
An Example of Individual Social Capital Development and Decay
MEASURING THE VALUE OF ELECTRONIC WORD OF MOUTH
Electronic copy available at: />
71
Journal of Interactive Marketing
DOI: 10.1002/dir
FIGURE 7
Effect of Message Volume and Duration on Social Capital
developed over time (in days). I have examined many
such plots and found that there is no standard pattern
that holds true for a majority of individuals except the
general pattern of build-up and decay.
To show that social capital APR is a true representation of the quality of a member’s contributions, rather
than purely a function of the volume of messages
posted and the length of community membership,
I divided the contribution and longevity (in days) data
for every community member at the time of their
maximum APR (the vertical line in Figure 6) into two
sets: prior and post. When these two data sets are
processed using the Glymour et al. (1987) methodology, two DAGs, Figures 7 and 8, are significant at
r ϭ .05. The weights assigned to the arrows are the
result of using maximum likelihood to estimate
simultaneous linear equations with an adjusted goodness-of-fit (AGFI) equal to 1.00. Even though these
findings are statistically significant, the explanatory
power is weak. As a result, I conclude that the APR
metric is not merely measuring the volume and
longevity of activity.
72
Homophily or Expert Power? The second part
of this phase was designed to discover the extent
homophily, or tie creation between people of similar
social capital, influences in the mechanism of preferential attachment. I reenacted the evolution of each
forum beginning with its first message. As each subsequent message was added, I calculated the APR of
every member of the community and converted it to a
z-score. I then accumulated an average of the incoming and originating message authors’ APR. The final
averages are given in Table 4. The t-test shows that
the two sets of averages are significantly different.
Message originators come from the full spectrum of
community membership, but the people who reply to
these messages are usually possessed of greater social
capital and by implication, greater expert power.
However, Table 5 shows that homophily is present as
the density of ties between the top 5% of social capital holders is significantly greater than that of the
community as a whole. I can conclude therefore that
while homophily is present in most networks it is not
an important driver of preferential attachment.
JOURNAL OF INTERACTIVE MARKETING
Electronic copy available at: />
Journal of Interactive Marketing
DOI: 10.1002/dir
FIGURE 8
Effect of High Social Capital on Subsequent Community Involvement
TABLE 4
FORUM
The Insignificant Role of Homophily
in Preferential Attachment
ORIGINATING AUTHOR’S
AVERAGE APR
REPLYING AUTHOR’S
AVERAGE APR
TABLE 5
FORUM
The Presence of Homophily
DENSITY OF TOP 5%
IN SOCIAL NETWORK
OVERALL NETWORK
DENSITY
Z-SCORE
Z-SCORE
1ALL_ROSWELL
.24
1.07
1ALL_ROSWELL
2004-Prius
11.9
11.1
2.4
3.9
2004-Prius
7th_Heaven
burningman-bcwa
.64
.10
.33
1.00
.72
.56
7th_Heaven
burningman-bcwa
cb-750
5.2
35.6
28.3
7.9
12.7
5.6
cb-750
jumptheshark
SimWatch
.39
.30
.39
.98
.66
1.07
jumptheshark
SimWatch
sportsterowners
24.8
25.4
13.8
18.1
4.3
7.1
sportsterowners
TheWestWing
x-files
.38
.18
.13
.54
.78
.88
TheWestWing
x-files
Mean
8.2
2.7
16.7
8.8
6.1
7.7
Mean
t
.31
r
.83
Ϫ7.24
t
2.81
r
.02
Ͻ.01
MEASURING THE VALUE OF ELECTRONIC WORD OF MOUTH
Electronic copy available at: />
73
Journal of Interactive Marketing
DOI: 10.1002/dir
Phase Two: The Effect of Knowledge
Capital on the Social Network
In the final part of this study, I quantified and investigated the interplay between preferential attachment
and decay in the social network and changes in community knowledge capital over time. Table 6 summarizes some measurements of attachment and decay.
The Ongoing column contains the proportion of community membership that carries over from month
to month. The Joiners column is the proportion of
new members. The Leavers column is the proportion
of members contributing their last message. Most of
these series are stationary about a mean; however,
the means vary considerably. When the source data
for Table 6 is corrected for heteroskedasticity, it results
in the Glymour et al. (1987) DAG model shown in
Figure 9 (r ϭ .05, AGFI ϭ .97). The model shows a
high degree of autoregressive interaction between the
variables of interest. When autoregression is removed
from the model it simplifies to the contemporaneous
model of Figure 10 (r ϭ .05, AGFI ϭ 1.00).
TABLE 6
Attachment and Decay Measured
FORUM
AVERAGE PERCENTAGE
ONGOING
LEAVERS
1ALL_ROSWELL
59.2*
16.7*
23.2*
2004-Prius
7th_Heaven
burningman-bcwa
49.6*
59.2*
81.1*
19.9*
17.8*
14.9*
28.1*
20.0*
10.0
cb-750
jumptheshark
SimWatch
67.1*
68.8*
69.3*
16.8*
15.9*
15.4*
16.1
12.7*
19.6
sportsterowners
TheWestWing
x-files
73.3*
69.4*
57.4
15.1*
16.9*
16.9*
15.6
20.0*
19.7*
Mean
65.4
16.6
18.5
9.1
1.5
5.2
s
*Satisfies the Dickey and Fuller (1981) test of stationarity with t Ͻ Ϫ2.89 (95% sig.).
FIGURE 9
Dynamics of Knowledge Capital, Joiners and Leavers
74
JOINERS
JOURNAL OF INTERACTIVE MARKETING
Electronic copy available at: />
Journal of Interactive Marketing
DOI: 10.1002/dir
FIGURE 10
Effect of Changes in Knowledge Capital and Leavers on Joining
Here we see that changes in knowledge capital and
Leavers are endogenous drivers of Joiners. The negative coefficient on the arrow reflects that Leavers are
subtracted from the social network while Joiners and
the knowledge network only change in a positive
direction. Because Leavers actually could not be
influencing Joiners, I interpret these causal relationships to mean that an unobserved effect causes members to join, the absence of which causes members to
leave (Figure 11). Based on a survey of relevant theory, I suggest that this unobserved effect is product
involvement.
Performing a common factor analysis on Leavers and
Joiners finds the indicated result explaining 49% of
the variance in Leavers and Joiners albeit with a
miserable KMO of .5. An increase in high-value content seems to explain about 10% (58.6 – 49.0 ϭ 9.6) of
what causes people on the sidelines to join in on the
discussion and become active members (that is,
Joiners). Change in knowledge capital is Pearson
correlated to this common factor at .091 (r ϭ .02). If
this common factor represents an underlying product
involvement, it is consistent with this discussion that
it should be positively correlated with changes in
knowledge capital.
SUMMARY AND CONCLUSIONS
The PageRank-based algorithm is a superior basis for
measuring importance in the informational and social
networks compared to the prevalent centrality-based
metrics (counting a node’s immediate ties). Content of
high value to the community attracts attention with
little reference to who originated the content. Thus
expert power, in whatever form, is respected by the
FIGURE 11
Unobserved Common Effect
MEASURING THE VALUE OF ELECTRONIC WORD OF MOUTH
Electronic copy available at: />
75
Journal of Interactive Marketing
DOI: 10.1002/dir
community, is the prime influence in how the knowledge network causes the social network to evolve over
time. High-value content in the knowledge network
explains 10% of social network growth. Changes in
people’s enjoyment of the products they use may
account for a large part of the network changes my
model has not explained. Validating this supposition
would be a logical avenue for further research.
As stated in the introduction, many companies have
begun monitoring online communities of their customers as a source of feedback. They seem to be aware
that community members are often the most fanatical
of their customers and act as product evangelists.
With the APR metric, companies can automate the
process of filtering community message traffic to identify the information that attracted the most customer
attention, as well as the members who typically provided that information. Since high quality content
plays a significant role in building online community,
companies who have products with large and active
online communities should consider hosting a blog so
they can play an active and visible role in injecting
such content into their user community. Such efforts
should be in the spirit of Alexandre Ledru-Rollin’s
lead-by-following philosophy, that is, the company
must restrain itself from trying to control their consumer communities and let emergent forces among
the consumers be the guiding influence. The effort a
company applies to this mode of marketing communications should be rewarded by increased sales as the
enthusiasm of consumer-evangelists is maintained
and producers gain greater ability to create products
their customers desire.
Burnett, G. (2000). Information Exchange in Virtual Communities: A Typology. Information Research, 5, 4.
Carley, K. M., Lee, J.-S., & Krackhardt, D. (2001).
Destabilizing Networks. Connections, 24(3), 31–34.
Dholakia, U. M., Bagozzi, R. P., & Pearo, L. K. (2004). A
Social Influence Model of Consumer Participation in
Network- and Small-Group-Based Virtual Communities.
International Journal of Research in Marketing, 21,
241–264.
Dickey, D. A., & Fuller, W. A. (1981). Likelihood Ratio
Statistics for Autoregressive Time Series With a Unit
Root. Econometrica, 49, 1057–1072.
Ebel, H., Mielsch, L. I., & Bornholdt, S. (2002). Scale-Free
Topology of Email Networks. Phys. Rev. E., 66, 035103.
Glymour, C., Scheines, R., Spirtes, P., & Kelly, K. (1987).
Discovering Causal Structure: Artificial Intelligence,
Philosophy of Science, and Statistical Modeling. San
Diego, CA: Academic Press.
Holme, P. (2003). Network Dynamics of Ongoing Social Relationships. Europhysics Letters, 64(3), 427–433.
Holme, P., Edling, C. R., & Liljeros, F. (2004). Structure and
Time Evolution of an Internet Dating Community. Social
Networks, 24, 155–174.
Holme, P., Kim, B. J., Yoon, C. N., & Han, S. K. (2002). Attack
Vulnerability of Complex Networks. Physical Review E,
65, 056109.
Holmes, J. H., & Lett, J. D. (1977). Product Sampling and
Word of Mouth. Journal of Advertising Research, 17(5),
35–40.
Houston, M. J., & Rothschild, M. L. (1978). Conceptual and
Methodological Perspectives on Involvement. In S. Jain
(Ed.), 1978 Educator’s Proceedings (pp. 184–187).
Chicago: American Marketing Association.
Lazarsfeld, P. F., & Merton, R. K. (1954). Friendship as a
Social Process: A Substantive and Methodological Analysis. In M. Berger (Ed.), Freedom and Control in
Modern Society. New York: Van Nostrand.
Muniz, A., & O’Guinn, T. (2001). Brand Community. Journal
of Consumer Research, 27 (March), 412–432.
REFERENCES
Albert, R., Jeong, H., & Barabasi, A. L. (2000). Attack and
Error Tolerance of Complex Networks. Nature, 406,
378–382.
Barabasi, A. L., & Albert, R. (1999). Emergence of Scaling in
Random Networks. Science, 286, 509–512.
Bart, Y., Shankar, V., Sultan, F., & Urban, G. L. (2005). Are the
Drivers and Role of Online Trust the Same for All Web Sites
and Consumers? A Large-Scale Exploratory Empirical
Study. Journal of Marketing, 69(October), 133–152.
Bianchini, M., Gori, M., & Scarselli, F. (2005). Inside
PageRank. ACM Transactions on Internet Technology,
5(1), 92–128.
76
Boorstin, D. J. (1974). The Americans: The Democratic
Experience. New York: Vintage.
Nail, J. (2005). Brand Monitoring Moves Into the Mainstream. Forrester Research, 10/7/2005.
Newman, M. E. J. (2003). The Structure and Function of
Complex Networks. SIAM Review, 45(2), 167–256.
Price, D. J. D. (1965). Networks of Scientific Papers.
Science, 149, 510–515.
Reingen, P. H., Foster, B. L., Brown, J. J., & Seidman, S.B.
(1984). Brand Congruence in Interpersonal Relations:
A Social Network Analysis. Journal of Consumer
Research, 11(3), 771–784.
Rheingold, H. (1993). The Virtual Community: Homesteading
on the Electronic Frontier. New York: Harper Perennial.
JOURNAL OF INTERACTIVE MARKETING
Electronic copy available at: />
Journal of Interactive Marketing
DOI: 10.1002/dir
Richins, M. L., Bloch, P. H., & McQuarrie, E. F. (1992). How
Enduring and Situational Involvement Combine to Create Involvement Responses. Journal of Consumer
Psychology, 1(2), 143–153.
Wang, Y., & Fesenmaier, D. R. (2003). Assessing Motivation
of Contribution in Online Communities: An Empirical
Investigation of an Online Travel Community. Electronic
Markets, 13(1), 33–45.
Schlosser, A. E., White, T. B., & Lloyd, S. M. (2006).
Converting Web Site Visitors into Buyers: How Web Site
Investment Increases Consumer Trusting Beliefs and
Online Purchase Intentions. Journal of Marketing,
70(April), 133–148.
Wasserman, S., & Faust, K. (1994). Social Network Analysis. Cambridge: Cambridge University Press.
Schouten, J. W., & McAlexander, J. H. (1995). Subcultures
of Consumption: An Ethnography of the New Bikers.
Journal of Consumer Research, 22, 43–61.
APPENDIX
Wellman, B., & Gulia, M. (1999). Net-surfers Don’t Ride Alone:
Virtual Communities as Communities. In B. Wellman
(Ed.), Networks in the Global Village: Life in Contemporary
Communities (pp. 331–366). Boulder, CO: Westview Press.
Zaichkowsky, J. L. (1985). Measuring the Involvement Construct. Journal of Consumer Research, 12(3), 192–205.
GLOSSARY
Adjusted goodness-of-fit: The adjusted goodness-of-fit index (AGFI) is a measure of how well a proposed model fits a
body of data corrected for the degrees of freedom (that is, number of data observations minus the number of variables)
in the model. The closer the index is to 1.00, the better the fit.
Autoregression: When the current value of a variable is partially based on its previous value, or indeed the previous
values of other variables, that variable is said to show autoregression. Sometimes it is useful to know to what extent
a variable’s current value is based on previous values; however, if you are trying primarily to determine the extent to
which a current value is based on the present values of other variables, then you will want to remove the autoregressive
portion so that it will not be a source of confusion.
Blog: An abbreviated form of weblog (see Weblog).
Centrality: In a network or a set of connected entities, centrality is a common way of denoting which entity or entities
are most important. Centrality, expressed simply, is the number of direct ties connected to an entity by other entities
in the same network. The more ties an entity has, the more “central” it is said to be. Centrality is often more specifically
called degree centrality. Sometimes centrality is expressed as a percentage: If you know 30% of the people in a room—all
members of a club (that is, in a network)—your centrality is 30%.
Consumer-generated media: The term “consumer-generated media” is used interchangeably with the “customergenerated media.” It refers to online content that is produced by people who were hitherto assumed to be only users or
consumers of online content. The phenomenon reflects the availability of affordable new tools for authoring content
that can be easily disseminated through the Internet. Such content includes blogs, podcasts (an audio file, usually
containing commentary or entertainment content), video, cellular phone photos, word of mouth, and wikis (a Web site
that allows readers to edit the content and thus be a tool for collaborative authoring).
Contemporaneous: In the preceding definition of autoregression, I distinguish between past and present influences on a
variable’s current value. The present influences are said to be contemporaneous.
Decay: People come and go from social networks and communities, making the community subject to the opposing forces
of growth and decay. People are motivated to stay in communities by satisfying social and tangible rewards (for
example, information). When these rewards lessen, people leave. If this perception of lessened rewards becomes
widespread, then the community will eventually disappear.
Directed acyclic graph (DAG): A DAG is a diagram showing how a group of variables affect each other’s values. It is
termed acyclic because it never depicts a variable as having its value determined by itself, either directly or through
one or more other variables. A DAG is a type of structural equation model (defined below).
MEASURING THE VALUE OF ELECTRONIC WORD OF MOUTH
Electronic copy available at: />
77
Journal of Interactive Marketing
DOI: 10.1002/dir
Endogenous: A situation in which a variable’s value is fully determined or explained by the value of other variables that
it is known to be in a relationship with. For example, in the basic equation for a straight line:
y ϭ mx ϩ b
(2)
The variable y is endogenous in that its value is fully determined by the values of variables m, x, and b.
Exogenous: Exogenous is the opposite of endogenous. In Equation 2, variables m, x, and b are termed exogenous because
their value is determined by something other than any relationship defined by Equation 2.
Heteroskedasticity: Suppose that you are trying to determine how the weight of a calf increases over time as it grows.
Let’s say that you weigh the calf using the same scale every day for 100 days and then weigh it again for another
100 days using a different scale. It might seem reasonable that you could take all 200 values, plot a trend line, and
thereby get a good estimate of how calves gain weight. However, because the two scales might vary in their accuracy,
you have a potential for the introduction of error in your weight estimation due to heteroskedasticity. In this paper,
data are gathered from a variety of different communities, all possessing unique levels of variance. When these data
are merged to derive findings true of communities in general, heteroskedasticity must be removed. In this situation,
all values are converted to z-scores (see definition below), removing the variance unique to a community.
Homophily: Suppose you, a prospective club member, enter a room filled with members of that club. One general theory
that tries to explain what strategy you will employ to become integrated with the club (or network) is homophily, that
is, you will look for people similar to you. In an online community, we become aware that a new member has joined
when he or she posts a message. If the new member chooses to announce his or her presence by deliberately attaching
a message to that of another member, then he or she has practiced homophily. The similarity of homophily can be
expressed in almost unlimited ways.
Information network: When separate pieces of information are linked together and to other pieces of information
because they have been judged to be thematically or semantically related, that collection of interrelated information
can be called an information network. In this paper, I use this term interchangeably with knowledge network (see
definition following). An online community’s only tangible asset is the information contained in the messages
members post to it. Members generally add their messages so they logically relate to those already there. As a result,
these communities are informational networks.
Involvement: Involvement is a motivational state aroused by the personal relevance of some stimulus, object, or situation. In this study, the messages posted to online communities are seen to be a possible result and an arouser of
involvement in the participants. Prior research distinguishes between situational (short-term, context-dependent)
and enduring (long-term, lifestyle-related) involvement. Behavior that is motivated by involvement is called an
involvement response. Prior research has identified word of mouth as an involvement response.
Knowledge capital: As in an informational network, an online community’s only tangible asset is the messages posted
to it. These messages, and the way they relate to each other, have value and increase in value as more content is
added. This value is called knowledge capital. The adapted PageRank metric described in this paper is a way of
expressing the value a community has assigned to all or part of its information network.
Knowledge network: As said in the definition of informational network, this paper uses informational and knowledge
network interchangeably. Other writers in the marketing discipline define the term differently.
Metadata: This word literally means “data about data.” The directed acyclic graph methodology (defined earlier) is able to
take into account prior knowledge about the relationships between variables in a model. This prior knowledge is metadata.
Node: A network is composed of nodes connected by ties. Nodes refer to entities that belong to a network. The relationships that connect these entities are ties. A family is a common network. One example of a family might consist of a
husband, wife, and two children. The four people are nodes, and the marital, parental, sibling, and familial relationships are all ties.
Outdegree: The term outdegree uses the word degree in a manner similar to its use in the phrase degree centrality. If
you enter a room full of networked strangers and make 10 new friends, then your outdegree in that context is 10. A
related term is indegree, the number of relationships others have initiated with you. These two terms are integrated in
the concept of prestige (see definition).
78
JOURNAL OF INTERACTIVE MARKETING
Electronic copy available at: />
Journal of Interactive Marketing
DOI: 10.1002/dir
Preferential attachment: If, when you join a network, you exercise a strategy for selecting specific members of the
network for the creation of a relationship (such as friendship), then you have demonstrated preferential attachment.
Homophily, defined above, is an example of preferential attachment strategy. In this paper, I discuss two preferential
attachment strategies: homophily and expert power. Expert power refers to a strategy of creating ties with people who
possess superior knowledge.
Prestige: Prestige is a type of centrality (defined earlier) where a node has a much larger number of incoming ties
(indegree) than outgoing ties (outdegree). The implication is that others have sought you out for preferential attachment but that you are more self-sufficient and have not sought many ties with others.
Proportioning factor: When Google calculates a Web page’s PageRank, it uses a portion of the PageRank of Web pages
that it links to. The linking page inherits some of the importance of pages it references. This idea can be transferred to
social networks: Your importance is partially based on the importance of the people you know. Google keeps secret the
exact proportion it uses. This paper uses an arbitrary value of 15%.
Purposive selection: There are two ways to select a sample for a scientific study: randomly or purposively. Random
sampling is commonly used in laboratory settings when you want to avoid introducing sources of bias or nonrandom
variation. However, in a real-world setting, you can accomplish the same goal by deliberately looking for wide diversity
in your test subjects. Even though many product-oriented online communities have been started, few are highly active.
A random sampling of these communities would probably result in an attempt to derive conclusions from a small
amount of data. As a result, I used purposive selection, purposely looking for large and active communities interested
in a wide variety of product classes. While this might bias the findings toward attributes peculiar to large and active
communities, I contend that this risk of bias does not impair my ability to meet the goals of this study.
Social capital: The value of your social network added to your own inherent worth (i.e., unique knowledge and skills) is
your social capital. A whole network can also have social capital—the sum of the individual social capital of all its
members. What constitutes value in a social network is very specific to its context. Theorists have proposed that
expertise or knowledge is the core determinant of value. You have value because of what you know and the knowledge
you can access through your friends.
Social network: When a group of people is linked together by any relationship or set of relationships, from casual
acquaintance to immediate family, the group is said to be a social network. Members of the same online community
may never have physically met; however, if they have communicated ideas to each other, they have met semantically
and thereby become connected.
Stationarity: When some value is measured over time, it may exhibit an upward or downward trend; it may also
fluctuate about some average value. In the latter situation, the value can be said to be stationary about a mean.
There are ways of testing whether a series of values is stationary; this study uses the method proposed by Dickey
and Fuller (1981).
Structural equation model (SEM): The relationships between a set of variables that affect each other’s values can be
expressed as a diagram such as that in Figure 9. Measured variables are depicted as boxes connected by arrows that
denote directions of influence. The degree of influence is represented by a number on the arrow. SEMs can also depict
the influence of latent variables (see Figure 11), that is, variables that have not been directly measured but whose
value and influence can be inferred from the other variables in the model.
Weblog: A weblog, or blog, is a Web site where one or more regular authors initiate discussion on a topic of their
choosing. The Web site allows comments to be added to the end of the blog author’s entry thus allowing a two-way
conversation between author and reader and a many-to-many conversation among the readers. A weblog is usually
distinguished from a forum or message board by the presence of the blog entry, which is intended to control the
subject of conversation.
Z-score: A z-score or standard score is calculated using Equation 3:
zϭ
XϪm
s
(3)
where X is a member of a set of values having a mean of m and a standard deviation of s. Z-scores are useful when
comparing sets of values that differ in size and variance by placing the values on a common footing.
MEASURING THE VALUE OF ELECTRONIC WORD OF MOUTH
Electronic copy available at: />
79


![thang nguyen ngoc - 2011 - corporate governance and its impact on the performance of firms in emerging countries - the evidence from vietnam [cg]](https://media.store123doc.com/images/document/2015_01/02/medium_rfd1420194809.jpg)
![thang nguyen ngoc - 2011 - corporate governance and its impact on the performance of firms in emerging countries - the evidence from vietnam [cg]](https://media.store123doc.com/images/document/2015_01/06/medium_tlw1420548434.jpg)