Nofarm activity and rural income inequality a case study from two provices in china
Bạn đang xem bản rút gọn của tài liệu. Xem và tải ngay bản đầy đủ của tài liệu tại đây (449.06 KB, 27 trang )
WPS3811
Nonfarm Activity and Rural Income Inequality:
A Case Study of Two Provinces in China
Nong Zhu (INRS-UCS, University of Québec)°
Xubei Luo (DECVP, World Bank)°°
Abstract: Non-farm activity plays an increasingly important role in rural household income. Based on data
from the Living Standards Measurement Study in the provinces of Hebei and Liaoning, we study the
distribution of non-farm income in rural China. First, we assume non-farm income as an exogenous
transfer to total income to decompose the Gini index; second, we assume non-farm income as a potential
substitute for farm income to take household choices into account and simulate household income. The
results show that non-farm activity reduces rural income inequality by raising the income of poor
households to a larger extent than that of rich households. Improving rural infrastructure and
implementing universal basic education are critical to build up the capacity of households (in particular
poor households) to participate in non-farm activity. Strengthening the linkages between farm activity and
non-farm activity is essential to optimize the contribution of non-farm activity to pro-poor rural economic
development.
JEL Classification: D63, O15, Q12
Key words: Non-farm income, Inequality, China
World Bank Policy Research Working Paper 3811, January 2006
The Policy Research Working Paper Series disseminates the findings of work in progress to encourage the exchange
of ideas about development issues. An objective of the series is to get the findings out quickly, even if the
presentations are less than fully polished. The papers carry the names of the authors and should be cited accordingly.
The findings, interpretations, and conclusions expressed in this paper are entirely those of the authors. They do not
necessarily represent the view of the World Bank, its Executive Directors, or the countries they represent. Policy
Research Working Papers are available online at .
°
°°
Email:
Email:
Nonfarm activity and rural income inequality: A case study of two provinces
in China *
1 Introduction
Non-farm activity plays an increasingly important role in sustainable development and
poverty reduction in rural areas (FAO, 1998). It can be considered as an important way to
increase overall rural economic activity and employment – in many developing countries, nonfarm activity often accounts for as much as 50% of rural employment and a similar percentage
share of household income (Lanjouw, 1999a). Average non-farm income share of the total is
about 42% in Africa, 40% in Latin America, and 32% in Asia (The World Bank, 2000). Earnings
from non-farm activity can not only significantly increase total household income, but also
function as a safety net through diversifying income sources. Participating in non-farm activity
enhances households’ capability of overcoming negative shocks and investing in farm activity. It
mitigates income fluctuation and enables the adoption of more profitable but “risky” agricultural
technologies, which encourage the transformation of traditional agriculture to modern
agriculture.1 Non-farm income may also prevent rapid or excessive urbanization as well as natural
resource degradation through overexploitation. The non-farm sector can hence function as a route
out of poverty through reducing the pressure on the demand for land in rural areas, and through
breaking the vicious circle of “poverty – extensive cultivation – ecological deterioration –
poverty”.
There has been a debate on the role of non-farm income in rural inequality. Some studies
show that although non-farm income increases total rural income, it worsens income inequality
because it is more unequally distributed than farm income.2 However, some other studies suggest
*
An earlier version of this paper was prepared for the Conference on Poverty and Income Inequality in Beijing,
China (April 2005), organized by the World Institute for Development Economics Research of the United Nations
University. A French version of the paper was presented at the 45th Annual Conference of the Canadian Economic
Association in La Malbaie, Canada (May 2005). The authors thank Jean-Jacques Dethier, Shahrokh Fardoust, Alan
Gelb, Gillmore Hoefdraad, Bert Hofman, Russell Pittman, Mark Sundberg for helpful comments, and participants at
the conferences for fruitful discussions.
1
See Bright et al. (2000) and Islam (1997).
2
See the results obtained by Barham and Boucher (1998); Elbers and Lanjouw (2001); Escobal (2001); Khan and
Riskin (2001); Leones and Feldman (1998); Reardon and Taylor (1996); Shand (1987).
1
that, if the households have a higher participation rate (in particular in casual wage activity) than
rich households, non-farm income can reduce rural inequality.3
China is a good candidate for a country case study that examines the impacts of non-farm
activity on rural income inequality. The objective of this paper is to examine whether and why
non-farm activity reduces overall household income inequality in rural areas of two Chinese
provinces, Hebei and Liaoning, in 1995/1997.4
The oversupply of agriculture labor, the relatively limited quantity of arable land, and the
obsolete agricultural technology in China result in its low level of farm income per capita. The
economic reforms, in particular the implementation of the Household Responsibility System
(HRS), in the late 1970s, not only stimulated the incentive of the farmers and contributed to the
increase of the agricultural productivities, but also legitimized the rural redundant labor to leave
land and participate in non-farm activity.
Since then, the non-farm sector has played an
increasingly important role in absorbing the surplus agricultural labor and reducing rural
poverty.5 Based on the data from the Living Standards Measurement Study (LSMS), we study
rural household income determination. We examine the impacts of participation in non-farm
activity on rural income inequality in two ways: First, we assume non-farm income as an
exogenous transfer to total income to decompose the Gini index; second, we assume non-farm
income as a potential substitute for farm income to take household choices into account and
simulate household income. The results suggest that non-farm activity reduces rural inequality.
The poor households would have suffered a relatively larger income loss than the rich households
if they were not allowed to participate in non-farm activity.
The paper is structured as follows: section 2 briefly reviews the development of non-farm
activity in rural China; section 3 describes the income composition and characteristics of
households in the provinces of Hebei and Liaoning, based on the LSMS data; section 4 discusses
two analytical methods, namely, the decomposition of the Gini index and the simulation of
household income; section 5 studies the determination of non-farm activity participation and the
distribution of the household income with and without non-farm activity; and section 6 presents
the conclusions.
3
See the results obtained by Adams (1994); Chinn (1979); de Janvry and Sadoulet (2001); Lachaud (1999); Stark et
al. (1986).
4
See Annex 1 for more information on the location of the provinces of Hebei and Liaoning.
5
See Ravallion (2003); Ravallion and Chen (2004).
2
2 Economic reforms in China and the development of non-farm activity
The labor market in China was fragmented with a significant rural-urban divide. Following
the model of the former-USSR, the government of China heavily taxed agriculture to support the
development of heavy industries in the planned-economy era. Before the economic reforms in
1978, although labor productivity in rural areas was very low, farmers were not allowed to leave
the land. The rural collectivization and the civil registration system were the two major barriers
that made rural-urban migration impossible or impractical.6 The income of a farmer was mainly
determined by the time he or she spent on the collective land (rural collectivization, gongfenzhi).7
Under the civil registration system, one with rural hukou was not eligible for most of the social
services in urban areas, such as health care services and education for children.
The economic reforms in the late 1970s brought big changes in China. First, the collapse of
the system of “People's Commune” and the implementation of the HRS in rural areas restored
greater liberty to farmers in choosing their careers and their modes of production. 8 To some
extent, rural households can allocate their labor to maximize their expected returns between farm
activity, local rural non-farm activity, migration, etc. Second, agricultural reforms greatly
increased the supply of grains, which gradually led to the abolishment of the rationing system.
Food became available in free markets in urban areas in the 1980s. Housing, health services, and
education for children became more accessible for rural-to-urban migrants without urban civil
status (hukou) in the 1990s. Third, the development of the non state-owned economies generated
large demand for informal workers. Most of the job openings in informal sectors were low-paid
and unattractive to urban citizens, which offered opportunities for rural migrants. 9 All these
factors induced a vast movement of agricultural labor from rural areas to cities.
Although the fragmentation of the rural-urban labor market has been much improved after
the economic reforms, the misallocation of labor resources still leads to a significant economic
welfare loss. A recent study by the World Bank estimates large potential gains from greater labor
market integration – using 2001 as a baseline, with a mere 1% labor relocation from rural areas to
urban areas, the overall economy will gain by 0.5%. If the share of labor outflow reaches 5% and
10%, GDP will grow by 2.5% and 5%, respectively (The World Bank, 2005).
6
See Davin (1999); Zhu (2002).
See McMillan et al. (1989).
8
See de Beer and Rocca (1997); Zhu and Jiang (1993).
9
Because of the wide gap in earning opportunities between rural and urban areas, such low-paid jobs were still
attractive to rural migrants.
7
3
The oversupply of labor keeps agricultural productivity low in China. Rural to urban
migration is one of the major solutions for reducing the income gap between the urban formal
industrial sectors and the rural traditional agricultural sectors (Lewis, 1954). However, in the case
of China, the urban sectors are not capable of absorbing the large quantity of redundant labor in
rural areas. Although the shortage of food is no longer a threat, the government continues
nevertheless to control rural-to-urban migration through some direct or indirect measures for two
principal reasons. First, the urban infrastructure is not sufficient to offer enough public services to
rural migrants without lowering those to the urban citizens. The urban residents are not willing to
share their relatively higher living standards with the rural residents. Second, the urban areas also
have the problems of unemployment, in particular due to the state-owned-enterprises (SOEs)
reforms. The urban sectors cannot offer enough additional job opportunities for rural migrants.
The development of the service sector is going to be important for developing the “pull forces” to
the cities. In China, the “push forces” from the countryside are strong, but the “pull forces” in
cities remain insufficient. Excessive rapid rural-to-urban migration may lead to serious socialeconomic problems. In this context, the rural non-farm sector, consisting mainly of township and
village enterprises (TVEs) and the rural private economies, becomes irreplaceably important for
economic development in China. 10 Since 1978, the rural total household income per capita
increased rapidly, but the income earned from the primary sector decreased relative to that earned
from secondary and tertiary sectors. In early 2002, non-farm income represented about half of
total rural household income (National Statistics Bureau of China, 2003).
Some studies show that rural inequality in China has significantly increased since the
beginning of the economic reforms, and suggest that such an increase in inequality can essentially
be explained by the growing importance of non-farm income in total income. Knight and Song
(1993) and Hussain et al. (1994) argue that the distribution of non-farm income is more unequal
than that of farm income in China. Bhalla (1990), Burgess (1998), Ravaillon and Chen (1999),
Wagstaff (2005), Yao (1999), Zhu (1991) and Zhou (1994) suggest that the sharp increase in
inequality in rural household income is mainly attributed to the difference in skills, knowledge,
and capital endowments.
10
See also Aubert (1995); Banister and Taylor (1990); Byrd and Lin (1994); Goldstein and Goldstein (1991); Zhou
(1994).
4
Based on the LSMS data of the provinces of Hebei and Liaoning, our analysis suggests
that the poor households gain more from non-farm activity than the rich households. One of the
important reasons is that households that suffer stronger constraints in farm activity are more
likely to participate in non-farm activity, and earn relatively higher income compared to those
with better resources. Whether a household participates in non-farm activity depends on its
incentive and capability. Households are motivated to undertake rural non-farm activity by either
“pull” or “push” factors. If the non-farm sector has high returns, the “pull factors” will be strong;
if farm activity cannot provide enough income for households (for example, if farm output is
inadequate due to drought, flood, or insufficiency of land) or households need to diversify their
income sources, the “push factors” may kick in. Poor households are less capable of weathering
negative shocks, and are more risk averse. In order to have additional income as well as to
diversify and undertake activities with returns that may have a low or negative correlation with
those of farming, poor households may have stronger incentives to participate in non-farm
activity; while rich households may have better capacity to do so thanks to their better
endowments in physical and human capital (FAO, 1998). In rural China, the credit and insurance
markets are underdeveloped. Households have strong incentives to diversify their income
sources. However, because of their limited capacity and liquidity constraints, poor households
tend to participate in non-farm activity with a high labor to capital ratio and low entry barriers.
The high participation in non-farm activity among low-income rural households may
result in a more equal distribution of total income. For example, Adams and He (1995) and
Adams (1999) argue that non-farm income reduces overall inequality in Pakistan and in Egypt,
respectively. They suggest that households with low farm income (because of unequal access to
land, etc.) are more likely to engage in non-farm activity, and the pro-poor distribution of nonfarm income across the income scale of the population mitigates inequality.
In the following sections, we will examine the determinants of participation in non-farm
activity and those of non-farm income, and study the impacts of non-farm income on rural
inequality in the case of two Chinese provinces, Hebei and Liaoning.
5
3 Data descriptions
In this paper, we use the data from China’s LSMS, which was conducted in July 1995 and
July 1997 in two provinces: Hebei and Liaoning.11 The survey includes information from 787
rural households, which were selected from a total of 31 sample villages of 15 towns or
townships in 6 counties. Although the sample size is limited, the LSMS employs standardized
sampling techniques on household selection and offers a satisfactory sample for in-depth
studies.12 The sample can be considered a rough approximation of the rural population in Hebei
and Liaoning. 13 Compared with other survey data, which can merely serve for descriptive
analysis, the LSMS data have significant advantages. To our knowledge, the LSMS is the most
detailed and professional survey of rural households in China in recent years.
Rural household income consists of two major parts: farm income and non-farm income.
The farm sector includes agriculture, livestock, forestry, fishing, and hunting. The non farm
“sector” includes all economic activities in rural areas except the above farm activities.14 Formal
or informal wage-paying income and self-employment income are the two major sources of nonfarm income.15 Among the 787 households in the sample, 205 received only farm income, 537
both farm income and non-farm income, 38 only non-farm income, and 7 neither farm income
nor non-farm income.16 To focus the study on farm income and non-farm income, we exclude the
households that do not have farm income (which represents about 5% of the total sample), and
take “the income from other sources” out of total income of the household in the econometric
analysis by considering this income as exogenous.17 Table 1 describes the sample characteristics
of the remaining 742 households.
In 1996, the GDP per capita of these Liaoning and Hebei ranked 8th and 12th respectively among the 30 provinces
in China.
12
The LSMS is designed to provide a comprehensive picture of household welfare and the factors that affect it. In
order to minimize non-sampling error and ensure high quality data, the samples of the LSMS are relatively small.
Substantial efforts and resources, including long interviewer trainings, use of direct informants, concurrent data entry
with in-field corrections taking place at the households, and low supervisor-interviewer ratios, are devoted to
enhance data quality. See Munoz and Scott (2005).
13
See “China Living Standards Survey 1995-1997: Basic Information Document”, />for further information on the survey data.
14
See Lanjouw and Lanjouw (2001).
15
In rural China, households work on small plots of cultivable land. In general, no households need to hire extra
labor. Income earned from agricultural wage employment is limited.
16
Some households have incomes from non-productive activities, such as pensions, transfers, grants/subsidies,
financial income, etc.
17
Among the 45 households that do not have farm income, 70% of them do not have land; among the remaining 30%
households that have land, most of them have less than 2.5 mu (compared to 10.5 mu in average for the 742
households with farm income in the sample). The members of these households work as village teachers, village
11
6
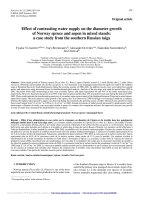
Table 1 Description of sample statistics
Households that
Households that
do not
participate in
participate in
non-farm
non-farm
activity
All households
activity
Household income (yuan)
Total income
Farm income
Non-farm income
Other income
Characteristics of households
Number of workers
Number of years of education
Proportion of members that have received some
technical training (%)
Proportion of household members that have been
an apprentice (%)
Number of dependent persons
Land surface of the household (mu)
Distance from village center to the site of the
township government (kilometer)
Distance from village center to the nearest railway
station (kilometer)
Distance from village center to the bus station
(kilometer)
Cultivable land per capita of the village (mu)
Number of observations
10183
5881
3338
964
9685
8633
1052
10353
4943
4476
935
2.44
5.89
2.06
4.99
2.57
6.20
8.5
3.4
10.2
8.0
0.99
10.48
3.7
1.09
13.95
9.5
0.95
9.30
3.50
4.00
3.33
41.49
47.74
39.36
0.67
5.12
0.86
6.03
0.60
4.81
742
205
537
The upper part of table 1 shows that the average income of the households that participate
in non-farm activity (10 353 yuans) is higher than that of the households that only participate in
farm activity (9 685 yuans). However, agricultural activity is still the major income source of
rural households. On average, the household farm income (5 881 yuans) is higher than non-farm
income (3 338 yuans).18
The lower part of table 1 summarizes the characteristics of households, which may have
significant impacts on non-farm activity participation and on non-farm income. The average
healthcare workers, etc. Instead of imposing an equation, which captures the potential substitution of farm activity
and non-farm activity participation for the households with farm income, to these households with specific
characteristics to simulate their income level in the absence of access to non-farm activity, we exclude them from our
simulation exercise in the following sections.
18
Given social security is not developed in rural areas in China, one reason that farmers often keep participating in
farm activity is to compensate for the insufficiency or absence of safety net coverage.
7
number of workers is 2.44 per household. 19 The average number of years of education is 5.89,
which is equal to the level of the primary school completion. The average land surface per
household is 10.48 mus,20 and the per capita level is only 2.92 mus. In other words, land is a
scarce resource in rural China, only 0.19 hectares per capita. Compared to the households that
participate only in farm activity, the households that participate in non-farm activity have a larger
number of workers, a higher education level, a lower level land surface, and live closer to urban
centers / hubs of transport.
4 Methodologies
Based on the LSMS data, we use two methods to study the impacts of non-farm income on
rural inequality. First, we consider non-farm income as an “exogenous transfer”, which adds to
pre-existing total household income, to decompose total household income and study the
distribution of each income source and its contribution to total income inequality. Second, we
consider non-farm income as a “potential substitute” for farm income, and compare the level and
distribution of observed total household income with those without non-farm income.
4.1 Method I: Decomposition of the Gini index
The method of the decomposition of the Gini index is often used to analyze income
inequality (Pyatt et al., 1980; Stark, 1991). Suppose that y1 , y 2 , L , y K stand for the K
K
components of household income and y 0 the total income, y 0 = ∑ y k . The Gini index of the
k =1
total income, G0 , can be decomposed as follows:
K
G 0 = ∑ Rk G k S k
(1)
k =1
where S k stands for the share of the component k in the total income, G k the Gini index
corresponding to the component k ; and Rk the correlation between the Gini indices of the
component k and the total income. Hence, the Gini index G0 is decomposed into three
components: (i) the share of the component k in total income, S k ; (ii) the inequality of the
19
20
Here “workers” are the household members who are at least 15 years old and can participate in productive activity.
1 mu = 1/15 hectares.
8
distribution of the said component, Gk ; and (iii) the correlation between the component k and
the total income, Rk .
To study the impacts of non-farm income on inequality, we compare the Gini index of total
income (which includes non-farm income), G0 , with that of farm income only, Ga . If the value
of G0 is inferior to that of Ga , non-farm income reduces total income inequality; and vice-versa.
This method provides a direct and simple measure of how non-farm income contributes to
total income. However, non-farm income is treated independently of farm income and considered
more as an income transfer. In other words, for a given household, with a given level of farm
income, an increase in non-farm income raises total income by the same amount. This could be
true if the non-farm activity participation was to compensate a short-term shock, such as a bad
harvest or drought/flood. But, more often than not, participation in non-farm activity is a longterm alternative choice of participation in farm activity for the households in our case. The nonfarm workers would contribute to their families in alternative ways if they had not participated in
non-farm activity. This method, the decomposition of the Gini index, does not address the
interdependence of farm and non-farm activity participation. If there is substitutability between
participation in farm activity and non-farm activity, the decomposition is biased (Escobal, 2001;
Kimhi, 1994). In the following sub-section, we will relax the assumption of independence of farm
activity and non-farm activity, and simulate total household income.
4.2 Method II: Simulation of household income
In order to compare the distribution of the observed household income with that of the
simulated income without non-farm activity, it is important to take the interactions between the
participation in non-farm activity and that in farm activity into account. Households that
participate in non-farm activity may be systematically different from those that only participate in
farm activity. Adams (1989) estimates a function of household income determination for nonmigrant households, and applies the coefficients and the endowment bundles of migrant
households (in the absence of migration and remittances) to impute their earnings under a nonmigration scenario and study the impacts of remittances on inequality. Barham and Boucher
(1998) correct the selection bias and improve the income simulation model. Using a bi-variate
probit model of double selection, Lachaud (1999) moves a step forward to simulate the household
9
income obtained in the absence of remittance and migration, and examines the impacts of private
transfers on poverty. To take into account the interdependence of the participation in farm
activity and non-farm activity, we will examine the impacts of non-farm income on inequality in
three steps: first, we estimate the household income equations based on the observed values;
second, we simulate the household income if the households only participate in farm activity; and
third, we compare the Gini index of the simulated income with that of the observed income (the
total income including non-farm income).
4.2.1 Estimation of income equations
The expected income of a particular activity is determined by the probability of
participating in this activity and the net expected income received by the household subject to
participation in this activity (Taylor & Yunez-Naude, 1999). Using the probit model, first, we
estimate the participation equation in which a dummy variable, which is equal to 1 if the
household participates in the activity and 0 otherwise, is regressed on the independent variables:
Pi* = αZ i + ε i
Pi = 1 ⇔ Pi > 0; Pi = 0 ⇔ Pi ≤ 0
*
*
(2)
*
where Pi is a non-observed continuous latent variable and Pi is an observed binary variable,
with a value of 1 if the household participates in the non-farm activity and 0 if it does not; Z i is a
vector of independent variables of the participation equation.
Second, we use the method of Heckman (1979) to correct the selection bias, and estimate
the income equation for the households that participate only in farm activity. We introduce the
inverse Mills ratio obtained from equation (2) to equation (3):
log yi = βX i + γλi + μ i
for Pi = 0
(3)
where yi is the total household income; X i a vector of independent variables; and λi inverse
Mills ratios.21 We consider equation (3) as the income equation in the case where a household
participates only in farm activity.
21
For the households that participate only in farm activity,
participate in non-farm activity,
λi = φ (αˆZ i ) Φ (αˆZ i ) .
λi = − φ (αˆZ i ) (1 − Φ (αˆZ i )) ; for the households that
10
4.2.2 Simulation of household income
Having estimated the income equations, we simulate the income of the households that
actually participate in non-farm activity if the access to the non-farm sources of income is absent.
For all households, we predict the income for all households, yˆ if , using equation (3)
estimated above:
log yˆif = βˆX i+γˆλi
for all households
(4)
Equation (4) gives the observable part of income in the case that the household participates
only in farm activity, that is to say, the part that can be explained by the exogenous variables.
However, for two reasons, the distribution of this estimated income cannot be considered as that
of the income in the absence of non-farm activity. First, in general, the variation of the estimated
value is less volatile than that of the observed value. The value of the Gini index of the
distribution of yˆ if is much lower than that of yi (observed income). Second, the unobserved
terms, i.e. the residual, may also play an important role in the income distribution. It’s necessary
to generate a full distribution of income for the households that participate in non-farm activity.
The method is as follows.
For the households that participate only in farm activity ( Pi = 0 ), we simply take the
observed value:
log yi = log yˆif + μi
for Pi = 0
(5)
where yi and yˆ if stand respectively for observed income and simulated income; μi the residual.
For the households that participate in non-farm activity, we simulate the residual (the
unobservable part) to generate the full income distribution. Using equation (5), we calculate the
variance of μi , noted as σ 2 , for the households that participate only in farm activity ( Pi = 0 ).
Suppose that (i) σ 2 is constant,22 (ii) the variance of μi for the households that participate only
in farm activity and for those that also participate in other activity are identical. Under these two
hypotheses, we generate a random value for each household that participates in non-farm activity
( Pi = 1 ):
μˆ i = σΦ −1 (r )
(6)
22
In fact, the variance of the error term varies across individuals in the estimation of two-step Heckman procedure
(Greene, 1997: p.979). Here, we simplify our study by supposing that this variance is constant.
11
where r is a random number between [0,1) ; Φ −1 the inverse of the cumulative probability
function of the normal distribution. μˆ i follows a normal distribution with the parameters (0,σ 2 ) .
For the households that do not participate in non-farm activity, we use the observed residual. As
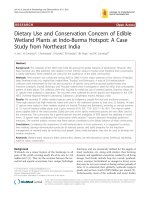
figure 1 shows, the income obtained in the case that the household participates only in farm
activity is defined as follows:
⎧⎪log y i = βˆX i + γˆλi + μ i
log yi' = ⎨
⎪⎩log yˆ if + μˆ i = βˆX i + γˆλi + μˆ i
Pi = 0
(7)
Pi = 1
Figure 1 Illustration of the simulation of household income
Total Sample
Income in the presence of non-farm activity
Households that participate only in
farm activity
yi
Households that participate in both
farm activity and non-farm activity
log yi = βX i + γλi + μ i
σ2
μˆ i = σΦ −1 (r )
log yˆ if = βˆX i + γˆλi
log yi' = log yˆif + μˆ i
log yi' = log yi
Observed value
Simulated value
yi'
Income in the absence of non-farm activity
To study the effects of non-farm income on rural inequality, we can compare the value of
the Gini index of the observed income, G ( yi ) , and that of the simulated income, G ( yi' ) , when
'
the household participates only in farm activity. If the value of G ( yi ) is inferior to that of G ( yi ) ,
the non-farm income reduces income inequality; and vice-versa.
5 Results and discussion
In this section, we study the role of non-farm income in rural inequality using two methods:
(i) we assume non-farm income as an exogenous transfer to the total income, and decompose the
Gini index; (ii) we assume non-farm income as a potential substitute for farm income, and
simulate the household income.
12
5.1 Non-farm income as an exogenous transfer
Under the hypothesis that non-farm income is an exogenous transfer, the Gini index can be
decomposed into three parts: the share of each income component, the Gini index of each income
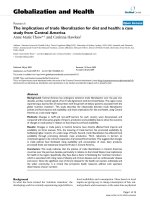
component, and the Gini correlation of each income component. The first column of table 2
shows that the farm income is the largest component of the total income (58.6%), following by
the non-farm income (31.5%). The second column shows that the Gini index of the distribution of
the observed total income, including the contribution of non-farm activity, is 0.508; while that of
the distribution of the farm income is 0.579. It suggests that, in the absence of non-farm activity,
household income would have been 14.0% more unequal. In other words, the presence of nonfarm income reduces rural income inequality.
Table 2 Decomposition of Gini Index
Percentage of
total income
Gini Index
Sk
Gk
100.0
0.508
1.00
100.0
Farm income
Agriculture
Livestock
Forestry and fishing
58.6
31.5
16.0
11.1
0.579
0.635
0.729
0.986
0.78
0.62
0.45
0.81
52.3
24.6
10.3
17.4
Non-farm income
Self-employment
Wage-paying
31.9
27.1
4.9
0.828
0.927
0.767
0.79
0.82
0.03
40.8
40.7
0.2
9.5
3.1
6.4
0.781
0.895
0.849
0.47
0.16
0.56
6.9
0.9
6.0
Total income
Other income
Private transfer
Others
Gini Correlation
Rk
Contribution to
inequality
S k G k Rk
G0
The LSMS data also show that the distribution of farm income is more equal than that of
non-farm income. 94.3% of the households participate in farm activity, while only 68.2%
participate in non-farm activity. 49% of the households have income from wage-paying activity,
and 39% of households have income from self-employment activity. The distribution of the self-
13
employment income is highly unequal, with a Gini index of 0.927. However, the distribution of
the wage-paying income is more egalitarian, with a Gini index of 0.767.23
5.2 Non-farm income as a potential substitute
We relax the strong hypothesis on the independence of the participation in non-farm
activity and farm activity, and consider non-farm income as a potential substitute for farm income.
Among the two major types of non-farm activity, the participation in wage-paying activity is
often conditioned by the spatial mobility, for the members concerned may leave their household
and work outside; while the self-employment activity is more likely to be local family work. In
general, the participation in wage-paying activity is an individual decision, while the participation
in self-employment activity can be a choice of the entire household.
The results of table 3 suggest that the households with more workers are more likely to
participate in non-farm activity. Because of the shortage of the cultivable land, the labor
productivity in agricultural activity is low. Other things being equal, a larger household will have
a lower opportunity cost of having some members working outside. After the implementation of
the HRS, surplus rural labor began seeking for job opportunities and leaving farms. However,
the number of workers does not influence the participation in self-employment activity. One of
the likely reasons is that, self-employment activity requires more starting funds and
entrepreneurship. Only some of the rural households with surplus labor are capable and willing to
run their own business. 24 If the households (in particular the rural households) have better
endowment in human and physical capital, and/or suffer less liquidity constraints from the
underdevelopment of the insurance and credit market, they will be more capable to participate in
self-employment activity, other things being equal.
23
The value of the Gini index is sensitive to the number of households that do not have the type of income in
question. Because more than 50% of the households do not have self-employment (or wage-paying) income, the
value of the Gini index of its distribution is relatively high.
24
The participation of the self-employment activity also depends on the number of the dependent persons, who can
partially participate in some non-farm work of the household, such as working in boutiques, restaurants, hotels, food
processing, etc.
14
Table 3 Estimation of participation equations in non-farm activity (probit model)
Number of workers
Average number of years of education
(reference group: 0-4 years)
4-6 years
6-8 years
8 years or above
Proportion of household members that have received
some technical and professional trainings
Proportion of household members that have been an
apprentice
Number of dependent persons
Land surface of the household
Land surface of the household in square (/100)
Distance from village center to the site of the township
government
Distance from village center to the nearest railway
station
Distance from village center to the bus station
Constant
Regression 1:
Non-farm
activity
0.464***
(6.77)
Regression 2:
SelfRegression 3:
employment Wage-paying
activity
activity
0.084
0.511***
(1.59)
(8.56)
0.239
(1.52)
0.434***
(2.73)
0.561***
(2.97)
0.297*
(1.93)
0.506***
(3.32)
0.422**
(2.42)
-0.044
(-0.28)
-0.017
(-0.11)
0.393**
(2.24)
1.032***
(2.73)
0.577**
(2.00)
0.422
(1.40)
0.875**
(2.53)
0.058
(0.97)
-0.032***
(-4.22)
0.012*
(1.81)
0.465*
(1.77)
0.150***
(2.88)
0.006
(0.43)
-0.044
(-1.27)
0.477*
(1.72)
-0.111**
(-2.07)
-0.025***
(-3.31)
0.012**
(1.97)
-0.043*
(-1.92)
0.024
(1.18)
-0.028
(-1.34)
-0.002***
(-2.62)
-0.111**
(-1.99)
-0.310
(-1.26)
0.001
(1.22)
-0.147***
(-2.67)
-1.117***
(-4.84)
-0.004***
(-4.69)
-0.013
(-0.23)
-0.753***
(-3.25)
Maximum likelihood in log
-370.366
-469.244
-438.406
0.153
0.048
0.147
Pseudo R2
Number of observation
742
742
742
Note: t-students are in parentheses. *** significant in 1%; ** significant in 5%; * significant in 10% .
The variable “average number of years of education” of the household members who are at
least 15 years old, which measures the human capital endowment, plays a positive role in the
15
participation of non-farm activity.25 The rural labor with primary school completion (6 years or
above in school) are more likely to participate in self-employment activity. However, only a
higher education level (8 years or above in school) has significant effects on the participation in
wage-paying activity. It suggests that the entry barriers, in terms of education, are higher for
wage-paying activity. One important reason is that, it is easier for the better educated rural labor
to find a non-farm job, other things being equal. The other two variables “percentage of members
that have received some technical or professional training” 26 and “percentage of household
members that have been apprentices”, which also measures the quality of labor force, plays a
positive role in non-farm activity participation as well. Special trainings can improve the
competence of the household members and facilitate their participation in non-farm work, which
often requires some knowledge of technology and management. The higher is the percentage of
the household members that have some technical and professional training, the higher is the
participation rate in self-employment activity. The higher is the percentage of household
members that have been apprentices, the higher is the participation rate in non-farm activity. In
short, households with more human capital (including formal and informal education) engage
more in non-farm activity.
The number of dependent persons plays a positive role in the participation in selfemployment activity and a negative role in wage-paying activity.27 One of the likely reasons may
be that the dependent persons can help with the local family activity; but they demand for some
routine care, which prevents the other members leaving home for wage-paying activity (Zhao,
1999).
The coefficient of the variable “land surface of the household” is negative and that of the
quadratic term is positive with marginal significance for non-farm activity participation.28 The
shortage of land, the major physical capital of a household, is one of essential motivations of the
25
See also Lanjouw (1999b).
In our case, these technical and professional trainings include: agricultural extension training (13.5%), medical
specialist (6.2%), teacher (4.66%), driver (24.9%), cook (2.1%), tailor (10.9%), veterinarian (0.5%) and others
(37.3%). Such training can facilitate the access to non-farm employment and increase the mobility of potential
migrants.
27
Dependent persons are defined as the persons who are at least 6 years old but not currently employed. Children
below 5 years are excluded, for they are not considered being able to offer labor services to the household.
28
The role of the “land surface” on non-farm activity participation is non-linear. However, the probability of nonfarm activity participation begins to increase when the land surface reaches 133 mus, which is much higher than the
average value in our case. It suggests that, in our case, households with less land are more likely to participate in
non-farm activity.
26
16
participation in non-farm activity. However, the land surface does not play a significant role in
self-employment activity participation.
The three distance variables, “distance from the village center to the site of the township
government”, “distance from the village center to the nearest railway station”, and “distance from
the village center to the nearest bus station”, which measure the geographic position of the village,
all play significantly roles in non-farm activity participation. In general, the site of the township
government is the nearest fair for farm households. The railway station often situates in the hubs
of transport/communication, or in urban centers. The distance to railway stations can reflect the
cost of a long-distance migration. The results suggest that, households live in villages far from
markets and/or hubs of transports are less likely to participate in non-farm activity. The long
distance from the market not only increases the transport/commute costs of non-farm activity
participation, but also lowers the profitability for the local non-farm business. In particular, if we
consider that railway stations often locate in cities where there are more wage-paying job
opportunities, the significant negative impacts of the distance between the village center and the
nearest railway station on the wage-paying activity participation suggests that the geographic
remoteness of a village (which is often aggravated by the insufficiency of the transport
infrastructures) is one major barrier for the surplus rural labor to participate in wage-paying
activity elsewhere. If we consider that bus stations often locate in local fairs / markets where
there are better opportunities for small business, the significant negative impacts of the distance
between the village center and the nearest bus station on self-employment activity participation
suggests that the segmentation from markets lowers the potential for households to participate in
self-employment activity. 29 Improving rural infrastructures and reducing transaction costs are
therefore critical for the development of rural non-farm activity.
29
The survey data suggests that households living near bus stations are more likely to participate in self-employment
activities, such as running stores or restaurants.
17
Table 4 Estimation of income equations
Number of workers
Average number of years of education
(reference group: 0-4 years)
4-6 years
6-8 years
8 years or above
Proportion of household members that have received some
technical or professional trainings
Proportion of household members that have been an
apprentice
Number of dependent persons
Land surface of the household
Land surface of the household in square (/100)
Inverse Mills ratio
Constant
Regression 4:
Households that participate in non-farm
activity
-0.029
(-0.13)
0.578**
(2.07)
0.397
(1.27)
0.714*
(1.73)
-0.497
(-0.60)
-0.778
(-0.88)
0.142
(1.29)
0.082***
(4.70)
-0.037***
(-4.16)
-0.255
(-0.41)
6.724***
(17.81)
0.320
R2
Number of observations
205
Note: t-students are in parentheses. *** significant in 1%; ** significant in 5%; * significant in 10% .
Using regression 1 as the selection equation, we estimate the income equation of the
households that participate in non-farm activity (table 4). The results suggest that the number of
workers does not have significant impacts on household income. It confirms that, in rural China,
the marginal labor productivity is low because of the other constraints, such as the shortage of
land and the backwardness of technology. Education has positive impacts on rural household
income. In particular, consistent with the findings in the literature30, the results indicate that basic
education (4-6 years in school) significantly increases farm productivities. As we argued in the
30
However, the informal education, including technical/professional training and apprentice, does not have
significant effects on household income.
18
previous sections, education has positive impacts on non-farm activity participation, which
implies that a person with better education is less likely to participate only in farm activity.
However, the effects of education on pure farm income are still positive. In other words,
education increases one’s earning potential. A person with better education is not only more
capable to participate in non-farm activity, but also more likely to have higher incomes if he or
she participates in farm activity. Only in case the return of farm income is high (high enough
compared to the opportunity costs), the households with well-educated members will participate
only in farm activity (Taylor & Yunez-Naude, 1999). As expected, households rich in land have
higher income.
Based on of regression 4, we simulate the total income of the households that actually
participate in non-farm activity if they had participated only in farm activity. Table 5 shows that,
for all the samples, the Gini index of the distribution of the simulated income (in the absence of
access to non-farm income) is about 30% higher than that of the observed income at the
household level as well as at the per capita level.31 In other words, the participation in non-farm
activity lowers the rural income inequality.32
Table 5 Comparison of the distribution of the observed household income and the simulated
household income (in the absence of non-farm activity)
Total household
Household income
income
per capita
Observed income
0.493
0.495
Simulated income (if the household had participated only in
0.609
0.621
farm activity)
It is true that the distribution of non-farm income is unequal among rural households,
because not all rural households participate in non-farm activity, while most rural households
participate in farm activity. Because of the non-zero opportunity costs of rural labor, the
participation in non-farm activity and farm activity is not independent. Non-farm income is a
substitute for farm income. The non-farm activity participation provides the possibility for the
households with low marginal labor productivity in farm activity to diversify their production in
31
According to the research by the Ministry of Agriculture of China, the Gini index increased from 0.3-0.4 in 1980s
to over 0.4 in the mid 1990s (Rural Economic Research Center, Ministry of Agriculture of China, 2003). Based on
the LSMS data, the Gini index in rural Hebei and Liaoning is relatively high, around 0.5.
32
Our results on the comparison of the inequality of the distribution of the observed income and the simulated
income are robust using other measures of inequality. See annex 2 for details.
19
non-farm sector and hence increase income. The households that are short of land but rich in
labor are more likely to participate in non-farm activity. The participation in non-farm activity
may raise the income of poor households to a larger extent than that of rich households, and
reduce the income inequality in rural areas. The LSMS data show that the households that
participate in non-farm activity have higher (total) income: the average income of these
households is 7% higher than that of the households that participate only in farm activity. But
these households with higher total income may not be the households that have high farm
income. In fact, the participation in non-farm activity is a long-term rational choice of the rural
households. The households that choose to participate only in farm activity are usually those with
comparative advantages in farming and with a higher expected farm income. If the access to the
non-farm sources of income is absent, the poor households, usually those with low level of land
resource per capita, are more likely to suffer from the binding constraint and face the cornered
solution, because their opportunity costs of labor are lower and their ability to weather negative
shocks are weaker, other things being equal. In addition, if those currently employed in the nonfarm sector were engaged in some alternative employment, such as being agricultural labor,
agricultural wage rates might be lower and overall income inequality might rise. So rather than
raising inequality, in this case, the non-farm sector actually prevents inequality from rising even
further.33
In conclusion, the results show that, the non-farm activity participation reduces rural
income inequality in China by widening the occupation choice that disproportionately favors the
poor households.
6 Conclusions
In rural China, non-farm activity has grown rapidly since the economic reforms in the late
1970s. Although farm income is still a principal income source of rural households, non-farm
income also plays a significant role. In the provinces of Hebei and Liaoning in 1995/1997, twothirds of the rural households had non-farm income, and non-farm income represented almost a
third of the total household income. The average income of the households that have participated
in non-farm activity is higher than that of the households that participate only in farm activity.
33
See also Barrett et al. (2001); Chapman and Tripp (2004).
20
Our results show that participation in farm activity and non-farm activity is interdependent.
With strict liquidity constraints due to the shortage of land, poor households have strong
incentives to diversify their income sources and to increase total income. Non-farm activity
widens the occupation choice of the rural households, which is disproportionately in favor of the
poor. Although the distribution of non-farm income is more unequal than that of farm income,
with a higher participation rate of poor households, non-farm activity reduces rural inequality. As
an alternative income source, non-farm income can be used to invest in farm activity and in
human capital, which can further equalize rural income in the long run.
The non-farm sector can be a path out of poverty and inequality in rural china. It can absorb
surplus agricultural labor and reduce the pressure on the demand for land, without creating
excessive burdens for urban infrastructure. To enhance the participation and profitability of nonfarm activity, it is important to improve rural infrastructure, reduce market segmentation, and
enlarge the potential of the rural areas; to ensure the pro-poor development of the non-farm
sectors, it is critical to increase the capability of the poor households by improving universal
basic education and by developing the credit and insurance market in rural areas; and to
maximize the impacts of non-farm activity in rural inequality reduction, it is essential to
strengthen the linkages between the farm and non-farm sectors, facilitate resource allocation, and
enhance overall productivity.
References
Adams, R. H. J., 1989, Worker Remittances and Inequality in Rural Egypt, Economic Development and
Cultural Change 38(1), 45-71.
Adams, R. H. J., 1994, Non-Farm Income and Inequality in Rural Pakistan: A Decomposition Analysis,
The Journal of Development Studies 31(1), 110-133.
Adams, R. H. J., 1999, Non-farm Income, Inequality and Land in Rural Egypt, Policy Research Working
Paper 2178, The World Bank.
Adams, R. H. J. & J. J. He, 1995, Sources of Income Inequality and Poverty in Rural Pakistan, IFPRI
Research Report 102.
Aubert, C., 1995, Exode rural, exode agricole en Chine, la grande mutation?, Espace Populations Société,
1995-2, 231-245.
Banister, J. & J. R. Taylor, 1990, China: Surplus Labor and Migration, Asia-Pacific Population Journal
4(4), 3-20.
Barham, B. & S. Boucher, 1998, Migration, remittances, and inequality: estimating the effects of
migration on income distribution, Journal of Development Economics 55, 307-331.
21
Barrett, C. B., T. Reardon & P. Webb, 2001, Nonfarm Income Diversification and Household Livelihood
Strategies in Rural Africa: Concepts, Dynamics, and Policy Implications, Food Policy 26(4), 315331.
Bhalla, A. S., 1990, Rural-Urban Disparities in India and China, World Development 18(8), 1097-1110.
Bright, H., J. Davis, M. Janowski, A. Low & D. Pearce, 2000, Rural Non-Farm Livelihoods in Central and
Eastern Europe and Central Asia and the Reform Process: A Literature Review, World Bank Natural
Resources Institute Report No. 2633.
Burgess, R., 1998, Diversification and Welfare in Rural China, mimeo, Department of Economics and
STICERD, London School of Economics.
Byrd, W. & Q. Lin, 1994, China’s Rural Industry: Structure, Development, and Reform (Oxford, Oxford
University Press).
Chapman, R., & R. Tripp, 2004, Background Paper on Rural Livelihood Diversity and Agriculture,
mimeo, AgREN electronic conference on the Implications of Rural Livelihood Diversity for Pro-poor
Agricultural Initiatives.
Chinn, D. L., 1979, Rural Poverty and the Structure of Farm Household Income in Developing Countries:
Evidence from Taiwan, Economic Development and Cultural Change 27(2), 283-301.
Davin, D., 1999, Internal Migration in Contemporary China (New York, St. Martin’s Press, Inc.).
de Beer, P. & J-L. Rocca, 1997, La Chine à la fin de l’ère DENG Xiaoping (Paris, Le Monde-Editions).
de Janvry, A. & E. Sadoulet, 2001, Income Strategies Among Rural Households in Mexico: The Role of
Off-farm Activities, World Development 29(3), 467-480.
Elbers, C. & P. Lanjouw, 2001, Intersectoral Transfer, Growth, and Inequality in Rural Ecuador, World
Development 29(3), 481-496.
Escobal, J., 2001, The Determinants of Nonfarm Income Diversification in Rural Peru, World
Development 29(3), 497-508.
FAO, 1998, The state of food and agriculture 1998 (Rome, FAO).
Goldstein, S. & A. Goldstein, 1991, Rural industrialization and migration in the People’s Republic of
China, Social Science History 15(3), 289-314.
Greene, W. H., 1997, Econometric Analysis (New Jersey, Prentice-Hall International).
Heckman, J., 1979, Sample selection bias as a specification error, Econometrica 47(1), 153-161.
Hussain, A., P. Lanjouw & N. Stern, 1994, Income Inequalities in China: Evidence from Household
Survey Data, World Development 22(12), 1947-1957.
Islam, N., 1997, The non-farm sector and rural development – review of issues and evidence, Food,
Agriculture and the Environment Discussion Paper 22, IFPRI, Washington D.C.
Khan, A. R. & C. Riskin, 2001, Inequality and Poverty in China in the Age of Globalization (New York,
Oxford University Press).
Kimhi, A., 1994, Quasi Maximum Likelihood Estimation of Multivariate Probit Models: Farm Couples’
Labor Participation, American Journal of Agricultural Economics 76(4), 828-835.
Knight, J. & L. Song, 1993, The spatial contribution to income inequality in rural China, Cambridge
Journal of Economics 17, 195-213.
Lachaud, J-P., 1999, Envois de fonds, inégalité et pauvreté au Burkina Faso, Revue Tiers Monde 40(160),
793-827.
22
Lanjouw, P., 1999a, The Rural Non-Farm Sector: A Note on Policy Options, Non-Farm Workshop
Background paper, The World Bank.
Lanjouw, P., 1999b, Rural Non-Agricultural Employment and Poverty in Ecuador, Economic
Development and Cultural Change 48(1), 90-122.
Lanjouw, J. O. & P. Lanjouw, 2001, The Rural Non-Farm Sector: Issues and Evidence from Developing
Countries, Agricultural Economics 26, 1-23.
Leones, J. P. & S. Feldman, 1998, Nonfarm Activity and Rural Household Income: Evidence from
Philippine Microdata, Economic Development and Cultural Change 46(4), 789-806.
Lewis, W. A., 1954, Economic Development with Unlimited Supply of Labour, The Manchester School of
Economic and Social Studies 47(3), 139-191.
McMillan, J., J. Whalley & L. Zhu, 1989, The Impact of China’s Economic Reforms on Agricultural
Productivity Growth, Journal of Political Economy 97(4), 781-807.
Munoz, J. & K. Scott, 2005, Household Surveys and the Millennium Development Goals, PARIS21 Task
Force on Improved Statistical Support for Monitoring Development Goals, mimeo.
National Bureau of Statistics of China, 2003, China Statistical Yearbook 2003 (Beijing, Chinese Statistics
Press).
Pyatt, G., C. Chen & J. Fei, 1980, The Distribution of Income by Factor Component, Quarterly Journal of
Economics 95(3), 451-473.
Ravallion, M., 2003, Externalities in Rural Development: Evidence for China, in R. Kanbur and T.
Venables (eds), Spatial Inequality (Oxford University Press).
Ravallion, M. & S. Chen, 1999, When Economic Reform is Faster than Statistical Reform: Measuring and
Explaining Inequality in Rural China, Oxford Bulletin of Economics and Statistics 61(1), 33-56.
Ravallion, M. & S. Chen, 2004, China’s (Uneven) Progress Against Poverty, Working Paper Series
#3408, The World Bank.
Reardon, T. & J. E. Taylor, 1996, Agroclimatic Shock, Income Inequality, and Poverty: Evidence from
Burkina Faso, World Development 24(5), 901-914.
Rural Economic Research Center, The Ministry of Agriculture of China (2003), Chinese Rural Research
Report (2001), Beijing, China Financial & Economic Publishing.
Shand, R. T., 1987, Income Distribution in a Dynamic Rural Sector: Some Evidence from Malaysia,
Economic Development and Cultural Change 36(1987), 35-50.
Stark, O., 1991, The Migration of Labor (Oxford, Basil Blackwell).
Stark, O., J. E. Taylor & S. Yitzhaki, 1986, Remittances and Inequality, Economic Journal 96(383), 722740.
Taylor, J. E. & A. Yunez-Naude, 1999, Education, migration et productivité : une analyse des zones
rurales au Mexique (Paris, Centre de Développement de l’OCDE).
The World Bank, 2000, Can Africa Claim the Twenty-First Century (Washington D.C.).
The World Bank, 2005, China: Integration of national product and factor markets – economic benefits
and policy recommendations (Washington D.C.).
Wagstaff, A., 2005, Decomposing Changes in Income Inequality into Vertical and Horizontal
Redistribution and Reranking, with Applications to China and Vietnam, The World Bank,
Development Research Group.
23
Yao, S., 1999, Economic Growth, Income Inequality and Poverty in China under Economic Reforms,
Journal of Development Studies 35(6), 103-130.
Zhao, Y., 1999, Leaving the Countryside: Rural-to-Urban Migration Decision in China, The American
Economic Review 89(2), 281-286.
Zhou, Q., 1994, Rural reforms and Development in China (Hong Kong, Oxford University Press).
Zhu, L., 1991, Rural Reform and Peasant Income in China (London, Macmillan).
Zhu, L. & Z. Jiang, 1993, From brigade to village community: the land tenure system and rural
development in China, Cambridge Journal of Economics 17, 441-461.
Zhu, N., 2002, Analyse des migrations en Chine: mobilité spatiale et mobilité professionnelle, Thèse de
doctorat, CERDI, Clermont-Ferrand, Novembre 2002.
24