Tài liệu Advanced PHP Programming- P10 docx
Bạn đang xem bản rút gọn của tài liệu. Xem và tải ngay bản đầy đủ của tài liệu tại đây (881.36 KB, 50 trang )
Please purchase PDF Split-Merge on www.verypdf.com to remove this watermark.
18
Profiling
IF YOU PROGRAM
PHP PROFESSIONALLY,THERE is little doubt that at some point you
will need to improve the performance of an application. If you work on a high-traffic
site, this might be a daily or weekly endeavor for you; if your projects are mainly intranet
ones, the need may arise less frequently. At some point, though, most applications need
to be retuned in order to perform as you want them to.
When I’m giving presentations on performance tuning PHP applications, I like to
make the distinction between tuning tools and diagnostic techniques. Until now, this
book has largely focused on tuning tools: caching methodologies, system-level tunings,
database query optimization, and improved algorithm design. I like to think of these
techniques as elements of a toolbox, like a hammer, a torque wrench, or a screwdriver
are elements of a handyman’s toolbox. Just as you can’t change a tire with a hammer, you
can’t address a database issue by improving a set of regular expressions.Without a good
toolset, it’s impossible to fix problems; without the ability to apply the right tool to the
job, the tools are equally worthless.
In automobile maintenance, choosing the right tool is a combination of experience
and diagnostic insight. Even simple problems benefit from diagnostic techniques. If I
have a flat tire, I may be able to patch it, but I need to know where to apply the patch.
More complex problems require deeper diagnostics. If my acceleration is sluggish, I
could simply guess at the problem and swap out engine parts until performance is
acceptable.That method is costly in both time and materials. A much better solution is
to run an engine diagnostic test to determine the malfunctioning part.
Software applications are in general much more complex than a car’s engine, yet I
often see even experienced developers choosing to make “educated” guesses about the
location of performance deficiencies. In spring 2003 the
php.net Web sites experienced
some extreme slowdowns. Inspection of the Apache Web server logs quickly indicated
that the search pages were to blame for the slowdown. However, instead of profiling to
find the specific source of the slowdown within those pages, random guessing was used
Please purchase PDF Split-Merge on www.verypdf.com to remove this watermark.
430
Chapter 18 Profiling
to try to solve the issue.The result was that a problem that should have had a one-hour
fix dragged on for days as “solutions” were implemented but did nothing to address the
core problem.
Thinking that you can spot the critical inefficiency in a large application by intuition
alone is almost always pure hubris. Much as I would not trust a mechanic who claims to
know what is wrong with my car without running diagnostic tests or a doctor who
claims to know the source of my illness without performing tests, I am inherently skepti-
cal of any programmer who claims to know the source of an application slowdown but
does not profile the code.
What Is Needed in a PHP Profiler
A profiler needs to satisfy certain requirements to be acceptable for use:
n
Transparency—Enabling the profiler should not require any code change. Having
to change your application to accommodate a profiler is both highly inconvenient
(and thus prone to being ignored) and intrinsically dishonest because it would by
definition alter the control flow of the script.
n
Minimal overhead—A profiler needs to impose minimal execution overhead on
your scripts. Ideally, the engine should run with no slowdown when a script is not
being profiled and almost no slowdown when profiling is enabled.A high over-
head means that the profiler cannot be run for production debugging, and it is a
large source of internal bias (for example, you need to make sure the profiler is not
measuring itself).
n
Ease of use—This probably goes without saying, but the profiler output needs to
be easy to understand. Preferably there should be multiple output formats that you
can review offline at your leisure.Tuning often involves a long cycle of introspec-
tion and code change. Being able to review old profiles and keep them for later
cross-comparison is essential.
A Smorgasbord of Profilers
As with most features of PHP, a few choices are available for script profilers:
n
Userspace profilers—An interesting yet fundamentally flawed category of profil-
er is the userspace profilers.This is a profiler written in PHP.These profilers are
interesting because it is always neat to see utilities for working with PHP written
in PHP itself. Unfortunately, userspace profilers are heavily flawed because they
require code change (every function call to be profiled needs to be modified to
hook the profiler calls), and because the profiler code is PHP, there is a heavy bias
generated from the profiler running. I can’t recommend userspace profilers for any
operations except timing specific functions on a live application where you cannot
install an extension-based profiler.
Benchmark_Profiler is an example of a
Please purchase PDF Split-Merge on www.verypdf.com to remove this watermark.
431
Installing and Using APD
userspace profiler in PEAR, and is available at />Benchmark.
n
Advanced PHP Debugger (APD)—APD was developed by Daniel Cowgill
and me. APD is a PHP extension-based profiler that overrides the execution calls
in the Zend Engine to provide high-accuracy timings. Naturally, I am a little
biased in its favor, but I think that APD provides the most robust and configurable
profiling capabilities of any of the candidates. It creates trace files that are machine
readable so they can be postprocessed in a number of different ways. It also pro-
vides user-level hooks for output formatting so that you can send profiling results
to the browser, to XML, or using any format you wanted. It also provides a step-
ping, interactive debugger, which us not covered here. APD is available from
PEAR’s PECL repository at
/>n
DBG—DBG is a Zend extension-based debugger and profiler that is available
both in a free version and as a commercial product bundled with the commercial
PHPEd code editor. DBG has good debugger support but lacks the robust profil-
ing support of APD. DBG is available at />n
Xdebug—Xdebug is a Zend extension-based profiler debugger written by Derick
Rethans. Xdebug is currently the best debugger of the three extension-based solu-
tions, featuring multiple debugger interfaces and a robust feature set. Its profiling
capabilities are still behind APD’s, however, especially in the ability to reprocess an
existing trace in multiple ways. Xdebug is available from .
The rest of this chapter focuses on using APD to profile scripts. If you are attached to
another profiler (and by all means, you should always try out all the options), you should
be able to apply these lessons to any of the other profilers.The strategies covered here
are independent of any particular profiler; only the output examples differ from one pro-
filer to another.
Installing and Using APD
APD is part of PECL and can thus be installed with the PEAR installer:
# pear install apd
After ADP is installed, you should enable it by setting the following in your php.ini
file:
zend_extension=/path/to/apd.so
apd.dumpdir=/tmp/traces
APD works by dumping trace files that can be postprocessed with the bundled pprofp
trace-processing tool.These traces are dumped into apd.dumpdir, under the name
pprof.pid, where pid is the process ID of the process that dumped the trace.
Please purchase PDF Split-Merge on www.verypdf.com to remove this watermark.
432
Chapter 18 Profiling
To cause a script to be traced, you simply need to call this when you want tracing to
start (usually at the top of the script):
apd_set_pprof_trace();
APD works by logging the following events while a script runs:
n
When a function is entered.
n
When a function is exited.
n
When a file is included or required.
Also, whenever a function return is registered,APD checkpoints a set of internal coun-
ters and notes how much they have advanced since the previous checkpoint.Three
counters are tracked:
n
Real Time (a.k.a. wall-clock time)—The actual amount of real time passed.
n
User Time—The amount of time spent executing user code on the CPU.
n
System Time—The amount of time spent in operating system kernel-level calls.
Accuracy of Internal Timers
APD’s profiling is only as accurate as the systems-level resource measurement tools it has available to it. On
FreeBSD, all three of the counters are measured with microsecond accuracy. On Linux (at least as of version
2.4), the User Time and System Time counters are only accurate to the centisecond.
After a trace file has been generated, you analyze it with the pprofp script. pprofp
implements a number of sorting and display options that allow you to look at a script’s
behavior in a number of different ways through a single trace file. Here is the list of
options to
pprofp:
pprofp <flags> <trace file>
Sort options
-a Sort by alphabetic names of subroutines.
-l Sort by number of calls to subroutines
-r Sort by real time spent in subroutines.
-R Sort by real time spent in subroutines (inclusive of child calls).
-s Sort by system time spent in subroutines.
-S Sort by system time spent in subroutines (inclusive of child calls).
-u Sort by user time spent in subroutines.
-U Sort by user time spent in subroutines (inclusive of child calls).
-v Sort by average amount of time spent in subroutines.
-z Sort by user+system time spent in subroutines. (default)
Display options
-c Display Real time elapsed alongside call tree.
-i Suppress reporting for php built-in functions
Please purchase PDF Split-Merge on www.verypdf.com to remove this watermark.
433
A Tracing Example
-m Display file/line locations in traces.
-O <cnt>Specifies maximum number of subroutines to display. (default 15)
-t Display compressed call tree.
-T Display uncompressed call tree.
Of particular interest are the -t and -T options, which allow you to display a call tree for
the script and the entire field of sort options. As indicated, the sort options allow for
functions to be sorted either based on the time spent in that function exclusively (that is,
not including any time spent in any child function calls) or on time spent, inclusive of
function calls.
In general, sorting on real elapsed time (using -r and -R) is most useful because it is
the amount of time a visitor to the page actually experiences.This measurement includes
time spent idling in database access calls waiting for responses and time spent in any
other blocking operations.Although identifying these bottlenecks is useful, you might
also want to evaluate the performance of your raw code without counting time spent in
input/output (I/O) waiting. For this, the -z and -Z options are useful because they sort
only on time spent on the CPU.
A Tracing Example
To see exactly what APD generates, you can run it on the following simple script:
<?php
apd_set_pprof_trace();
hello(“George”);
goodbye(“George”);
function hello($name)
{
echo “Hello $name\n”;
sleep(1);
}
function goodbye($name)
{
echo “Goodbye $name\n”;
}
?>
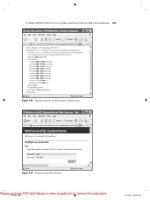
Figure 18.1 shows the results of running this profiling with -r.The results are not sur-
prising of course: sleep(1); takes roughly 1 second to complete. (Actually slightly
longer than 1 second, this inaccuracy is typical of the sleep function in many languages;
you should use usleep() if you need finer-grain accuracy.) hello() and goodbye() are
both quite fast. All the functions were executed a single time, and the total script execu-
tion time was 1.0214 seconds.
Please purchase PDF Split-Merge on www.verypdf.com to remove this watermark.
434
Chapter 18 Profiling
Figure 18.1 Profiling results for a simple script.
To generate a full call tree, you can run pprofp with the -Tcm options.This generates a
full call tree, with cumulative times and file/line locations for each function call. Figure
18.2 shows the output from running this script. Note that in the call tree, sleep is
indented because it is a child call of hello().
Figure 18.2 A full call tree for a simple script.
Please purchase PDF Split-Merge on www.verypdf.com to remove this watermark.
435
Profiling a Larger Application
Profiling a Larger Application
Now that you understand the basics of using APD, let’s employ it on a larger project.
Serendipity is open-source Web log software written entirely in PHP.Although it is most
commonly used for private individuals’Web logs, Serendipity was designed with large,
multiuser environments in mind, and it supports an unlimited number of authors.
In this sense, Serendipity is an ideal starting point for a community-based Web site to
offer Web logs to its users. As far as features go, Serendipity is ready for that sort of high-
volume environment, but the code should first be audited to make sure it will be able to
scale well. A profiler is perfect for this sort of analysis.
One of the great things about profiling tools is that they give you easy insight into
any code base, even one you might be unfamiliar with. By identifying bottlenecks and
pinpointing their locations in code, APD allows you to quickly focus your attention on
trouble spots.
A good place to start is profiling the front page of the Web log.To do this, the
index.php file is changed to a dump trace. Because the Web log is live, you do not gen-
erate a slew of trace files by profiling every page hit, so you can wrap the profile call to
make sure it is called only if you manually pass PROFILE=1 on the URL line:
<?php
if($_GET[‘PROFILE’] == 1) {
apd_set_pprof_trace();
}
/* regular serendipity code starts here */
Figure 18.3 shows the profile results for the Serendipity index page, sorted by inclusive
real times (using -R). I prefer to start my profiling efforts with -R because it helps give
me a good idea which macro-level functions in an application are slow. Because the
inclusive timing includes all child calls as well,“top-level” functions tend to be promi-
nent in the listing.
The total time for this page was 0.1231 seconds, which isn’t bad if you are running
your own personal site, but it might be too slow if you are trying to implement
Serendipity for a large user base or a high-traffic site. include_once() is the top-ranked
time-consumer, which is not uncommon in larger applications where a significant por-
tion of the logic is implemented in include files. Note, though, that include_once()
not only dominates the inclusive listing, but it seems to dominate the exclusive listing as
well. Figure 18.4 verifies this: Rerunning the profile with pprofp -r shows that
include_once() takes 29.7% of the runtime, without counting any child function calls.
Please purchase PDF Split-Merge on www.verypdf.com to remove this watermark.
436
Chapter 18 Profiling
Figure 18.3 Initial profiling results for the Serendipity index page.
Figure 18.4 An exclusive call summary for the Serendipity index page.
What you are seeing here is the cost of compiling all the Serendipity includes.
Remember the discussion of compiler caches in Chapter 9,“External Performance
Tunings,” that one of the major costs associated with executing PHP scripts is the time
spent parsing and compiling them into intermediate code. Because
include files are all
parsed and compiled at runtime, you can directly see this cost in the example shown in
Figure 18.4.You can immediately optimize away this overhead by using a compiler
cache. Figure 18.5 shows the effect of installing APC and rerunning the profiles.
include_once() is still at the top of inclusive times (which is normal because it includes
a large amount of the page logic), but its exclusive time has dropped completely out of
the top five calls.Also, script execution time has almost been cut in half.
Please purchase PDF Split-Merge on www.verypdf.com to remove this watermark.
437
Profiling a Larger Application
Figure 18.5 A Serendipity index profile running with an APC
compiler cache.
If you look at the calls that remain, you can see that these are the three biggest offenders:
n
serendipity_plugin_api::generate_plugins
n
serendipity_db_query
n
mysql_db_query
You might expect database queries to be slow. Database accesses are commonly the bot-
tleneck in many applications. Spotting and tuning slow SQL queries is covered in
Chapter 12,“Interacting with Databases,” so this chapter does not go into detail about
that. As predicted earlier, the high real-time cost of the database queries is matched with
no user and system time costs because the time that is spent in these queries is exclusive-
ly spent on waiting for a response from the database server.
The generate_plugins() function is a different story. Serendipity allows custom user
plug-ins for side navigation bar items and comes with a few bundled examples, including
a calendar, referrer tracking, and archive search plug-ins. It seems unnecessary for this
plug-in generation to be so expensive.
To investigate further, you can generate a complete call tree with this:
> pprofp -tcm /tmp/pprof.28986
Figure 18.6 shows a segment of the call tree that is focused on the beginning of the first
call to serendipity_plugin_api::generate_plugins().The first 20 lines or so show
what seems to be normal lead-up work. A database query is run (via
serendipity_db_query()), and some string formatting is performed. About midway
down the page, in the serendipity_drawcalendar() function, the trace starts to look
Please purchase PDF Split-Merge on www.verypdf.com to remove this watermark.
438
Chapter 18 Profiling
very suspicious. Calling mktime() and date() repeatedly seems strange. In fact, date() is
called 217 times in this function. Looking back up to the exclusive trace in Figure 18.5,
you can see that the date() function is called 240 times in total and accounts for 14.8%
of the script’s execution time, so this might be a good place to optimize.
Figure 18.6 A call tree for the Serendipity index page.
Fortunately, the call tree tells you exactly where to look:
serendipity_functions.inc.php, lines 245–261. Here is the offending code:
227 print (“<TR CLASS=’serendipity_calendar’>”);
228 for ($y=0; $y<7; $y++) {
229 // Be able to print borders nicely
230 $cellProp = “”;
231 if ($y==0) $cellProp = “FirstInRow”;
232 if ($y==6) $cellProp = “LastInRow”;
233 if ($x==4) $cellProp = “LastRow”;
234 if ($x==4 && $y==6) $cellProp = “LastInLastRow”;
235
236 // Start printing
237 if (($x>0 || $y>=$firstDayWeekDay) && $currDay<=$nrOfDays) {
238 if ($activeDays[$currDay] > 1) $cellProp.=’Active’;
239 print(“<TD CLASS=’serendipity_calendarDay$cellProp’>”);
Please purchase PDF Split-Merge on www.verypdf.com to remove this watermark.
439
Profiling a Larger Application
240
241 // Print day
242 if ($serendipity[“rewrite”]==true)
243 $link = $serendipity[“serendipityHTTPPath”].”archives/”.
244 date(“Ymd”, mktime(0,0,0, $month, $currDay, $year)).
245 “.html”;
246 else
247 $link = $serendipity[“serendipityHTTPPath”];;
248 if (date(“m”) == $month &&
249 date(“Y”) == $year &&
250 date(“j”) == currDay) {
251 echo “<I>”;
252 }
253 if ($activeDays[$currDay] > 1) {
254 print (“<A HREF=’$link’>”);
255 }
256 print ($currDay);
257 if ($activeDays[$currDay] > 1) print (“</A>”);
258 if (date(“m”) == $month &&
259 date(“Y”) == $year &&
260 date(“j”) == $currDay) {
261 echo “</I>”;
262 }
263 print(“</TD>”);
264 $currDay++;
265 }
266 else {
267 print “<TD CLASS=’serendipity_calendarBlankDay$cellProp’>”;
268 print “ </TD>”;
269 }
270 }
271 print (“</TR>”);
This is a piece of the serendipity_drawcalendar() function, which draws the calendar
in the navigation bar. Looking at line 244, you can see that the
date() call is dependent
on
$month, $currDay,and$year. $currDay is incremented on every iteration through
the loop, so you cannot cleanly avoid this call.You can, however, replace it:
date(“Ymd”, mktime(0,0,0, $month, $currDay, $year))
This line makes a date string from $month, $currDay,and $year.You can avoid the
date() and mktime() functions by simply formatting the string yourself:
sprintf(“%4d%02d%02d:, $year, $month, $currDay)
However, the date calls on lines 248, 249, 250, 258, 259, and 260 are not dependent on
any variables, so you can pull their calculation to outside the loop.When you do this, the
top of the loop should precalculate the three date() results needed:
Please purchase PDF Split-Merge on www.verypdf.com to remove this watermark.
440
Chapter 18 Profiling
227 $date_m = date(“m”);
228 $date_Y = date(“Y”);
229 $date_j = date(“j”);
230 print (“<TR CLASS=’serendipity_calendar’>”);
231 for ($y=0; $y<7; $y++) {
232 /* */
Then lines 248–250 and 258–261 should both become this:
if ($date_m == $month &&
$date_Y == $year &&
$date_j == $currDay) {
Implementing this simple change reduces the number of date() calls from 240 to 38,
improves the speed of serendipity_plugin_api::generate_plugins() by more than
20%, and reduces the overall execution time of the index page by 10%.That’s a signifi-
cant gain for a nine-line change and 15 minutes’ worth of work.
This particular example is easy to categorize as simply being a case of programmer
error. Putting an invariant function inside a loop is a common mistake for beginners; dis-
missing it is a mistake, though, for a number of reasons:
n
Experienced programmers as well as beginners make these sorts of mistakes, espe-
cially in large loops where it is easy to forget where variables change.
n
In a team environment, it’s extremely easy for simple inefficiencies like these to
crop up. For example, a relatively simple task (such as writing a calendar) may be
dispatched to a junior developer, and a casual audit of the work might fail to turn
up this sort of error.
n
Inefficiencies like these are almost never revealed by intuition. If you approach the
code base from afar, it is unlikely that you’ll think that the calendar (largely an
afterthought in the application design) is a bottleneck. Small features like these
often contain subtle inefficiencies; 10% here, 15% there—they quickly add up to
trouble in a performance-sensitive application.
Spotting General Inefficiencies
Profilers excel at spotting general inefficiencies. An example might include using a mod-
erately expensive user function repeatedly when a built-in function might do or fre-
quently using a function in a loop where a single built-in function would do the job.
Unlike the analysis done earlier in this chapter, using the inclusive timings, mild but
widespread issues are often better diagnosed by using exclusive time ordering.
My favorite example of this sort of “obvious” yet largely undetectable inefficiency
occurred during the birth of APD. At the company where I was working, there were
some functions to handle making binary data (specifically, encrypted user data) 8-bit safe
so that they could be set into cookies. On every request to a page that required member
Please purchase PDF Split-Merge on www.verypdf.com to remove this watermark.
441
Spotting General Inefficiencies
credentials, the users’ cookie would be decrypted and used for both authentication and
as a basic cache of their personal data. User sessions were to be timed out, so the cookie
contained a timestamp that was reset on every request and used to ensure that the ses-
sion was still valid.
This code had been in use for three years and was authored in the days of PHP3,
when non-binary-safe data (for example, data containing nulls) was not correctly han-
dled in the PHP cookie handling code—and before rawurlencode() was binary safe.
The functions looked something like this:
function hexencode($data) {
$ascii = unpack(“C*”, $data);
$retval = ‘’;
foreach ($ascii as $v) {
$retval .= sprintf(“%02x”, $v);
}
return $retval;
}
function hexdecode($data) {
$len = strlen($data);
$retval =
‘’;
for($i=0; $i < $len; $i+= 2) {
$retval .= pack(
“C”, hexdec(
substr($data, $i, 2)
)
);
}
return $retval;
}
On encoding, a string of binary data was broken down into its component characters
with
unpack().The component characters were then converted to their hexadecimal
values and reassembled. Decoding affected the reverse. On the surface, these functions are
pretty efficient—or at least as efficient as they can be when written in PHP.
When I was testing APD, I discovered to my dismay that these two functions con-
sumed almost 30% of the execution time of every page on the site.The problem was
that the user cookies were not small—they were about 1KB on average—and looping
through an array of that size, appending to a string, is extremely slow in PHP. Because
the functions were relatively optimal from a PHP perspective, we had a couple choices:
n
Fix the cookie encoding inside PHP itself to be binary safe.
n
Use a built-in function that achieves a result similar to what we were looking for
(for example, base64_encode()).
We ended up choosing the former option, and current releases of PHP have binary-safe
cookie handling. However, the second option would have been just as good.
Please purchase PDF Split-Merge on www.verypdf.com to remove this watermark.
442
Chapter 18 Profiling
A simple fix resulted in a significant speedup.This was not a single script speedup, but
a capacity increase of 30% across the board.As with all technical problems that have sim-
ple answers, the question from on top was “How did this happen?”The answer is multi-
faceted but simple, and the reason all high-traffic scripts should be profiled regularly:
n
The data had changed—When the code had been written (years before), user
cookies had been much smaller (less than 100 bytes), and so the overhead was
much lower.
n
It didn’t actually break anything—A 30% slowdown since inception is inher-
ently hard to track.The difference between 100ms and 130ms is impossible to spot
with the human eye.When machines are running below capacity (as is common in
many projects), these cumulative slowdowns do not affect traffic levels.
n
It looked efficient—The encoding functions are efficient, for code written in
PHP.With more than 2,000 internal functions in PHP’s standard library, it is not
hard to imagine failing to find
base64_encode() when you are looking for a
built-in hex-encoding function.
n
The code base was huge—With nearly a million lines of PHP code, the appli-
cation code base was so large that a manual inspection of all the code was impossi-
ble.Worse still, with PHP lacking a
hexencode() internal function, you need to
have specific information about the context in which the userspace function is
being used to suggest that base64_encode() will provide equivalent functionality.
Without a profiler, this issue would never have been caught.The code was too old and
buried too deep to ever be found otherwise.
Note
There is an additional inefficiency in this cookie strategy. Resetting the user’s cookie on every access could
guarantee that a user session was expired after exactly 15 minutes, but it required the cookie to be re-
encrypted and reset on every access. By changing the time expiration time window to a fuzzy one—between
15 and 20 minutes for expiration—you can change the cookie setting strategy so that it is reset only if it is
already more than 5 minutes old. This will buy you a significant speedup as well.
Removing Superfluous Functionality
After you have identified and addressed any obvious bottlenecks that have transparent
changes, you can also use APD to gather a list of features that are intrinsically expensive.
Cutting the fat from an application is more common in adopted projects (for example,
when you want to integrate a free Web log or Web mail system into a large application)
than it is in projects that are completely home-grown, although even in the latter case,
you occasionally need to remove bloat (for example, if you need to repurpose the appli-
cation into a higher-traffic role).
Please purchase PDF Split-Merge on www.verypdf.com to remove this watermark.
443
Removing Superfluous Functionality
There are two ways to go about culling features.You can systematically go through a
product’s feature list and remove those you do not want or need. (I like to think of this
as top-down culling.) Or you can profile the code, identify features that are expensive,
and then decide whether you want or need them (bottom-up culling).Top-down culling
certainly has an advantage: It ensures that you do a thorough job of removing all the fea-
tures you do not want.The bottom-up methodology has some benefits as well:
n
It identifies features. In many projects, certain features are undocumented.
n
It provides incentive to determine which features are nice and which are necessary.
n
It supplies data for prioritizing pruning.
In general, I prefer using the bottom-up method when I am trying to gut a third-party
application for use in a production setting, where I do not have a specific list of features
I want to remove but am simply trying to improve its performance as much as necessary.
Let’s return to the Serendipity example.You can look for bloat by sorting a trace by
inclusive times. Figure 18.7 shows a new trace (after the optimizations you made earlier),
sorted by exclusive real time. In this trace, two things jump out: the
define() functions
and the
preg_replace() calls.
Figure 18.7 A postoptimization profile.
Please purchase PDF Split-Merge on www.verypdf.com to remove this watermark.
444
Chapter 18 Profiling
In general, I think it is unwise to make any statements about the efficiency of define().
The usual alternative to using define() is to utilize a global variable. Global variable
declarations are part of the language syntax (as opposed to define(), which is a func-
tion), so the overhead of their declaration is not as easily visible through APD.The solu-
tion I would recommend is to implement constants by using const class constants. If
you are running a compiler cache, these will be cached in the class definition, so they
will not need to be reinstantiated on every request.
The preg_replace() calls demand more attention. By using a call tree (so you can
be certain to find the instances of preg_replace() that are actually being called), you
can narrow down the majority of the occurrences to this function:
function serendipity_emoticate($str) {
global $serendipity;
foreach ($serendipity[“smiles”] as $key => $value) {
$str = preg_replace(
“/([\t\ ]?)”.preg_quote($key,”/”).
“([\t\ \!\.\)]?)/m”, “$1<img ”$value\” />$2”, $str);
}
return $str;
}
where $serendipity[‘smiles’] is defined as
$serendipity[“smiles”] =
array(
“:’(“ => $serendipity[“serendipityHTTPPath”].”pixel/cry_smile.gif”,
“:-)” => $serendipity[“serendipityHTTPPath”].”pixel/regular_smile.gif”,
“:-O” => $serendipity[“serendipityHTTPPath”].”pixel/embaressed_smile.gif”,
“:O” => $serendipity[“serendipityHTTPPath”].”pixel/embaressed_smile.gif”,
“:-(“ => $serendipity[“serendipityHTTPPath”].”pixel/sad_smile.gif”,
“:(“ => $serendipity[“serendipityHTTPPath”].”pixel/sad_smile.gif”,
“:)” => $serendipity[“serendipityHTTPPath”].”pixel/regular_smile.gif”,
“8-)” => $serendipity[“serendipityHTTPPath”].”pixel/shades_smile.gif”,
“:-D” => $serendipity[“serendipityHTTPPath”].”pixel/teeth_smile.gif”,
“:D” => $serendipity[“serendipityHTTPPath”].”pixel/teeth_smile.gif”,
“8)” => $serendipity[“serendipityHTTPPath”].”pixel/shades_smile.gif”,
“:-P” => $serendipity[“serendipityHTTPPath”].”pixel/tounge_smile.gif”,
“;-)” => $serendipity[“serendipityHTTPPath”].”pixel/wink_smile.gif”,
“;)” => $serendipity[“serendipityHTTPPath”].”pixel/wink_smile.gif”,
“:P” => $serendipity[“serendipityHTTPPath”].”pixel/tounge_smile.gif”,
);
and here is the function that actually applies the markup, substituting images for the
emoticons and allowing other shortcut markups:
function serendipity_markup_text($str, $entry_id = 0) {
global $serendipity;
Please purchase PDF Split-Merge on www.verypdf.com to remove this watermark.
445
Removing Superfluous Functionality
$ret = $str;
$ret = str_replace(‘\_’, chr(1), $ret);
$ret = preg_replace(‘/#([[:alnum:]]+?)#/’,’&\1;’,$ret);
$ret = preg_replace(‘/\b_([\S ]+?)_\b/’,’<u>\1</u>’,$ret);
$ret = str_replace(chr(1), ‘\_’, $ret);
//bold
$ret = str_replace(‘\*’,chr(1),$ret);
$ret = str_replace(‘**’,chr(2),$ret);
$ret = preg_replace(‘/(\S)\*(\S)/’,’\1’ . chr(1) . ‘\2’,$ret);
$ret = preg_replace(‘/\B\*([^*]+)\*\B/’,’<strong>\1</strong>’,$ret);
$ret = str_replace(chr(2),’**’,$ret);
$ret = str_replace(chr(1),’\*’,$ret);
// monospace font
$ret = str_replace(‘\%’,chr(1),$ret);
$ret = preg_replace_callback(‘/%([\S ]+?)%/’, ‘serendipity_format_tt’, $ret);
$ret = str_replace(chr(1),’%’,$ret) ;
$ret = preg_replace(‘/\|([0-9a-fA-F]+?)\|([\S ]+?)\|/’,
‘<font color=”\1”>\2</font>’,$ret);
$ret = preg_replace(‘/\^([[:alnum:]]+?)\^/’,’<sup>\1</sup>’,$ret);
$ret = preg_replace(‘/\@([[:alnum:]]+?)\@/’,’<sub>\1</sub>’,$ret);
$ret = preg_replace(‘/([\\\])([*#_|^@%])/’, ‘\2’, $ret);
if ($serendipity[‘track_exits’]) {
$serendipity[‘encodeExitsCallback_entry_id’] = $entry_id;
$ret = preg_replace_callback(
“#<a href=(\”|’)http://([^\”’]+)(\”|’)#im”,
‘serendipity_encodeExitsCallback’,
$ret
);
}
return $ret;
}
The first function, serendipity_emoticate(), goes over a string and replaces each text
emoticon—such as the smiley face :)—with a link to an actual picture.This is designed
to allow users to enter entries with emoticons in them and have the Web log software
automatically beautify them.This is done on entry display, which allows users to re-
theme their Web logs (including changing emoticons) without having to manually edit
all their entries. Because there are 15 default emoticons, preg_replace() is run 15 times
for every Web log entry displayed.
Please purchase PDF Split-Merge on www.verypdf.com to remove this watermark.
446
Chapter 18 Profiling
The second function, serendipity_markup_text(), implements certain common
text typesetting conventions.This phrase:
*hello*
is replaced with this:
<strong>hello</strong>
Other similar replacements are made as well. Again, this is performed at display time so
that you can add new text markups later without having to manually alter existing
entries.This function runs nine preg_replace() and eight str_replace() calls on
every entry.
Although these features are certainly neat, they can become expensive as traffic
increases. Even with a single small entry, these calls constitute almost 15% of the script’s
runtime. On my personal Web log, the speed increases I have garnered so far are already
more than the log will probably ever need. But if you were adapting this to be a service
to users on a high-traffic Web site, removing this overhead might be critical.
You have two choices for reducing the impact of these calls.The first is to simply
remove them altogether. Emoticon support can be implemented with a JavaScript entry
editor that knows ahead of time what the emoticons are and lets the user select from a
menu.The text markup can also be removed, requiring users to write their text markup
in HTML.
A second choice is to retain both of the functions but apply them to entries before
they are saved so that the overhead is experienced only when the entry is created. Both
of these methods remove the ability to change markups after the fact without modifying
existing entries, which means you should only consider removing them if you need to.
A Third Method for Handling Expensive Markup
I once worked on a site where there was a library of regular expressions to remove profanity and malicious
JavaScript/CSS from user-uploaded content (to prevent cross-site scripting attacks). Because users can be
extremely…creative…in their slurs, the profanity list was a constantly evolving entity as new and unusual
foul language was discovered by the customer service folks. The site was extremely high traffic, which
meant that the sanitizing process could not be effectively applied at request time (it was simply too expen-
sive), but the dynamic nature of the profanity list meant that we needed to be able to reapply new filter
rules to existing entries. Unfortunately, the user population was large enough that actively applying the fil-
ter to all user records was not feasible either.
The solution we devised was to use two content tables and a cache-on-demand system. An unmodified copy
of a user’s entry was stored in a master table. The first time it was requested, the current filter set was
applied to it, and the result was stored in a cache table. When subsequent requests for a page came in, they
checked the cache table first, and only on failure did they re-cache the entry. When the filter set was
updated, the cache table was truncated, removing all its data. Any new page requests would immediately be
re-cached—this time with the new filter. This caching table could easily have been replaced with a network
file system if we had so desired.
Please purchase PDF Split-Merge on www.verypdf.com to remove this watermark.
447
Further Reading
The two-tier method provided almost all the performance gain of the modify-on-upload semantics. There
was still a significant hit immediately after the rule-set was updated, but there was all the convenience of
modify-on-request. The only downside to the method was that it required double the storage necessary to
implement either of the straightforward methods (because the original and cached copies are stored sepa-
rately). In this case, this was an excellent tradeoff.
Further Reading
There is not an abundance of information on profiling tools in PHP.The individual pro-
filers mentioned in this chapter all have some information on their respective Web sites
but there is no comprehensive discussion on the art of profiling.
In addition to PHP-level profilers, there are a plethora of lower-level profilers you can
use to profile a system.These tools are extremely useful if you are trying to improve the
performance of the PHP language itself, but they’re not terribly useful for improving an
application’s performance.The problem is that it is almost impossible to directly connect
lower-level (that is, engine-internal) C function calls or kernel system calls to actions you
take in PHP code. Here are some excellent C profiling tools:
n
gprof is the GNU profiler and is available on almost any system. It profiles C code
well, but it can be difficult to interpret.
n
valgrind, combined with its companion GUI kcachegrind, is an incredible
memory debugger and profiler for Linux. If you write C code on Linux, you
should learn to use
valgrind.
n
ooprofile is a kernel-level profiler for Linux. If you are doing low-level debug-
ging where you need to profile an application’s system calls,
ooprofile is a good
tool for the job.
Please purchase PDF Split-Merge on www.verypdf.com to remove this watermark.
Please purchase PDF Split-Merge on www.verypdf.com to remove this watermark.
19
Synthetic Benchmarks: Evaluating
Code Blocks and Functions
CHAPTER 18, “PROFILING,” DESCRIBES BENCHMARKING entire applications.This is use-
ful for doing comparative analysis between Web pages to identify slow pages and for
measuring the effects of application tuning. Similar techniques are useful for evaluating
the differences such as the following between different code blocks:
n
Is while() faster or slower than foreach() for loops?
n
Is substr() faster than strstr() for matching characters at the beginning of a
string?
You could go online and search the PHP general archives to look for the answers, or
you could pick up a book (like this one) for some sage advice on the subject, but neither
of these methods is really sufficient. One of PHP’s strengths is the rapid development of
the language itself. Performance differences that exist now may be absent from future
releases of the language. Nor does this happen only on major releases —the open-source
development model behind PHP means that many problems are addressed when they
itch someone enough to need scratching.These are just two examples of code patterns
that reversed themselves:
n
In every version of PHP until version 4.3, interpolated variables in strings were
much slower than concatenating strings. (Refer to the section “Interpolation Versus
Concatenation,” later in this chapter.)
n
Using the built-in parse_url() function is much slower than parsing the URL in
the userspace by using preg_match.This was also fixed in version 4.3. (Refer to
the section “Adding Custom Timer Information,” later in this chapter.)
When you’re tuning critical code, it is always preferable to make the comparison and the
appropriate code-usage choice yourself, as opposed to relying on someone else’s pur-
ported benchmarks.
Please purchase PDF Split-Merge on www.verypdf.com to remove this watermark.
450
Chapter 19 Synthetic Benchmarks: Evaluating Code Blocks and Functions
To answer the aforementioned questions and others, you need to write synthetic
benchmarks as test cases. Synthetic benchmarks provide a means for testing small portions
of code or individual functions to evaluate (and, by comparison, minimize) their resource
usage. By incorporating benchmarks into unit tests, you can also track performance
changes in libraries over time.
Synthetic benchmarks differ from application benchmarks in that they do not attempt
to simulate a realistic use of the application but instead focus simply on measuring the
performance of a particular piece of code. Synthetic benchmarks have a rich history in
computer science. In the 1950s, programmers used benchmarks with the goal of opti-
mizing physical systems’ implementations. One of the original and most famous synthet-
ic benchmarks is the Whetstone benchmark, designed to benchmark floating-point
operations. Other common examples include calculating Fibonacci Sequences, using the
Towers of Hanoi to test the speed of recursive function calls in a language, and using
matrix multiplication to test linear algebra algorithms.
The results of synthetic benchmarks often have little bearing on the overall perform-
ance of an application.The real issue is that nothing is intrinsically broken with the idea
of benchmarking; rather, it is simply an issue of optimizing the wrong parts of an appli-
cation. A critical companion to benchmarking is profiling, which allows you to pinpoint
the sections of an application that can benefit most from optimization.
In creating a good synthetic benchmark, you need to address the following two issues:
n
Does it test what you intend?—This might sound obvious, but it is very
important to make sure a benchmark is really designed to test what you are look-
ing for. Remember:You are not testing the whole application, but just a small
component. If you do not succeed in testing that component alone, you have
reduced the relevance of the benchmark.
n
Does it use the function the way you will?—Algorithms often vary dramati-
cally, depending on the structure of their input. If you know something about the
data that you will be passing to the function, it is beneficial to represent that in the
test data set. Using a sample of live data is optimal.
Intentionally missing from this list is the question “Is it relevant?” Benchmarking can be
a useful exercise in and of itself to help familiarize you with the nuances of PHP and the
Zend Engine. Although it might not be useful to optimize array iteration in a seldom-
used script, having a general knowledge of the performance idioms of PHP can help you
develop a coding style that needs less optimization down the road.
Benchmarking Basics
When comparing benchmarks, you need to make sure they differ with only one degree
of freedom.This means that you should vary only one independent factor at a time in a
test, leaving the rest of the data and algorithms as a control. Let’s say, for example, that
you are writing a class that reads in a document and calculates its Flesch readability
Please purchase PDF Split-Merge on www.verypdf.com to remove this watermark.
451
Building a Benchmarking Harness
score. If you simultaneously change the algorithms for counting words and counting sen-
tences, you will be unable to determine which algorithm change accounts for the per-
formance difference.
You should also keep in mind that benchmarks are highly relative. If I compare
array_walk() on my laptop versus a for loop on my development server, I will likely
just prove that a for loop on a more powerful machine is faster than array_walk() on a
less powerful machine.This is not a very useful statement.To make this into a benchmark
that has relevance, I should run my tests on the same machine unless the goal is to have a
laptop versus server shootout, in which case I should fix the functions I am comparing.
Standardized initial data is also extremely important. Many functions (regular expres-
sions being a prime example) exhibit extremely different performance characteristics as
the size and disposition of their operands change.To make a fair comparison, you need
to use similar data sets for all the functions you want to compare. If you are using stati-
cally specified data for the test, it should be reused between functions. If you are using
random data, you should use statistically equivalent data.
Building a Benchmarking Harness
Because you plan on benchmarking a lot of code, you should build a benchmarking har-
ness to help automate the testing process. Having a benchmarking infrastructure not only
helps to standardize benchmarks, it also makes it easy to incorporate benchmarks into a
unit testing framework so that you can test the performance effects of library changes
and PHP version changes.
The following are some of the features required in a usable harness:
n
Ease of use—Obviously, if the suite is hard to use, you will not use it. In particu-
lar, the benchmarking suite should not require you to modify your code in order
to test it.
n
Low or measurable overhead—The benchmarking harness itself takes resources
to run.You need the ability to either minimize this overhead or (better yet) meas-
ure it so that you can remove it from the measured results.
n
Good ability to select initial data—A benchmark is only as good as the data
you use to run it against.The ability to be able to specify arbitrary input data is
crucial.
n
Extensibility—It would be nice to be able to extend or modify the statistics that
are gathered.
PEAR’s Benchmarking Suite
PEAR has a built-in benchmarking suite, Benchmark_Iterate, that satisfies almost all
the needs described in the preceding section.
Benchmark_Iterate is suitable for many
simple benchmarking tasks.
Please purchase PDF Split-Merge on www.verypdf.com to remove this watermark.
452
Chapter 19 Synthetic Benchmarks: Evaluating Code Blocks and Functions
Benchmark_Iterate works by running a function in a tight loop, recording execution
times around each execution, and providing accessors for getting summary information
on the results.
To start, you need to install the Benchmark libraries. Prior to PHP 4.3, the Benchmark
class suite was packaged with PHP. After version 4.3, you need to either download the
classes from or use the PEAR installer for a one-step installation:
# pear install Benchmark
To benchmark the performance of the function foo() over 1,000 iterations, you create a
Benchmark_Iterate object, invoke the run method that specifies 1,000 iterations, and
report the average runtime:
require ‘Benchmark/Iterate.php’;
$benchmark = new Benchmark_Iterate;
$benchmark->run(1000, foo);
$result = $benchmark->get();
“Mean execution time for foo: $result[mean]\n”;
A simple example of this is to use the suite to compare the speed of the built-in func-
tion
max() with the PHP userspace implementation my_max().This is a simple example
of how iterating over arrays with built-in functions can be significantly faster than using
a userspace implementation.
The
my_max() function will work identically to the built-in max() function, per-
forming a linear search over its input array and keeping track of the largest element it
has seen to date:
Function my_max(&$array) {
$max = $array[0];
Foreach ($array as $el) {
If($element > $max) {
$max = $element;
}
}
return $max;
}
For testing array functions, it is nice to have random test data.You can write a conven-
ience function for generating such arrays and add it to the include
test_data.inc so
that you can reuse it later down the road:
Function random_array($size) {
For($I=0; $I<$size; $I++) {
$array[] = mt_rand();
}
return $array;
}
Please purchase PDF Split-Merge on www.verypdf.com to remove this watermark.