Tài liệu Windows 7 Resource Kit- P21 docx
Bạn đang xem bản rút gọn của tài liệu. Xem và tải ngay bản đầy đủ của tài liệu tại đây (1.76 MB, 50 trang )
Performance Monitoring CHAPTER 21
953
9. Select the Compare menu item and then click the Snap To Compare option. The second
window is resized to the same size as the anchor window and is overlaid on top of the
anchor window, as shown here.
note You can still interact with both Performance Monitor windows individually to
change properties; select menu items; and minimize, maximize, or close the windows.
Performance Monitor User Rights
Performance Monitor user rights are specified as follows:
n
Administrators Members of this group have local and remote full control.
n
Performance Log Users Members of this group can access and log performance
counter data locally and remotely (create, manipulate, and view logs).
n
Performance Monitor Users Members of this group can access performance
counter data locally and remotely (view logs).
note On earlier versions of Windows, Performance Monitor can be used to monitor
Windows Vista and later computers with options previously available on earlier versions
of Windows but without support for new Windows Vista and later Performance Monitor
features. The user of the earlier version of Windows must also be in the local Administra-
tors group on the Windows Vista or later computer.
Please purchase PDF Split-Merge on www.verypdf.com to remove this watermark.
CHAPTER 21 Maintaining Desktop Health
954
Remote Data Collection
To enable all remote performance logging and alerting, you must perform the following
actions:
n
Enable the Performance Logs And Alerts firewall exception on the user’s computer.
n
Add the user to the Event Log Readers group. (This applies only when the user belongs
to the Performance Log Users group.)
Managing Performance Logs and Event Trace Sessions with Logman
Logman.exe creates and manages Event Trace Session and Performance logs and supports
many functions of Performance Monitor from the command line. Logman commands include
the following:
n
logman create Creates a counter, trace, configuration data collector, or API
n
logman query Queries data collector properties
n
logman start Starts data collection
n
logman stop Stops data collection
n
logman delete Deletes an existing data collector
n
logman update Updates the properties of an existing data collector
n
logman import Imports a DCS from an XML file
n
logman export Exports a DCS to an XML file
n
logman /? Displays help for logman
The following usage examples illustrate logman syntax.
logman create counter perf_log -c "\Processor(_Total)\% Processor Time"
logman create trace trace_log -nb 16 256 -bs 64 -o c:\logfile
logman start perf_log
logman update perf_log -si 10 -f csv -v mmddhhmm
logman update trace_log -p "Windows Kernel Trace" (disk,net)
For detailed syntax of logman commands and more examples of usage, see
/>Using Windows PowerShell for Performance Monitoring
New in Windows 7 is the capability of using Windows PowerShell for gathering performance
data. Three new Windows PowerShell cmdlets provide functionality as follows:
n
Get-counter Gets real-time performance counter data from local and remote
computers
n
Import-counter Exports PerformanceCounterSampleSet objects as performance
counter log (.blg, .csv, .tsv) files
n
Export-counter Imports performance counter log files and creates objects that
represent each counter sample in the log
Please purchase PDF Split-Merge on www.verypdf.com to remove this watermark.
Resource Monitor CHAPTER 21
955
For example, the following Windows PowerShell command gets the current “% Processor
Time” combined values for all processors on the local computer every 2 seconds until it has
100 values and displays the captured data.
PS C:\Users\mallen>Get-counter -Counter "\Processor(_Total)\% Processor Time"
-SampleInterval 2 -MaxSamples 100
The following command continuously gets the current “% Processor Time” combined
values for all processors on the local computer every second (the default sampling interval)
and displays the captured data until you press CTRL+C.
PS C:\Users\mallen>Get-counter -Counter "\Processor(_Total)\% Processor Time"
–Continuous
You can pipe the output of the Get-counter cmdlet into the Export-counter cmdlet. For
example, the following command gets the current “% Processor Time” combined values for
all processors on the local computer every 2 seconds until it has 100 values and exports the
captured data as a performance counter log file named Data1.blg, which is saved in the
current directory (here the root folder of user Michael Allen’s user profile).
PS C:\Users\mallen>Get-counter "\Processor(*)\% Processor Time" -SampleInterval 2
-MaxSamples 100 | Export-counter -Path $home\data1.blg
You can also pipe the output of the Import-counter cmdlet into the Export-counter cmdlet.
You might do this, for example, to convert a performance monitor log file from one format to
another, such as from .csv to .blg format.
MoRe inFo For more information on using Windows PowerShell for performance moni-
toring, see the help for the Get-counter, Import-counter, and Export-counter cmdlets in the
Windows PowerShell Cmdlet Help Topics at
/dd347701.aspx.
Resource Monitor
The Resource Overview screen of the Reliability and Performance Monitor Control Panel item
in Windows Vista has become a separate tool in Windows 7 called Resource Monitor (see
Figure 21-6). You can open Resource Monitor using any of the following methods:
n
Type resource in the Start menu search box and click Resource Monitor when Resource
Monitor appears in the Programs group.
n
Type perfmon /res in the Start menu search box or at a command prompt and press
Enter.
n
Open Performance Monitor, right-click on the Monitoring Tools node, and select
Resource Monitor.
Please purchase PDF Split-Merge on www.verypdf.com to remove this watermark.
CHAPTER 21 Maintaining Desktop Health
956
n
Select Action Center, View Performance Information, Advanced Tools, Open Resource
Monitor.
FIGURE 21-6 The Overview tab of Resource Monitor
Resource Monitor provides considerably more information in Windows 7 than the Resource
Overview screen of the Reliability and Performance Monitor did in Windows Vista. The
following sections summarize the information displayed on each tab of Resource Monitor.
note Once you configure Resource Monitor to filter and display the information you
want, you can save the configuration as an XML file by selecting Save Settings As from
the File menu. You can save multiple configurations and then load each configuration as
desired to display only the information you want to see.
Overview Tab
The Overview tab (see Figure 21-6) displays graphs of CPU, disk, and network utilization,
and a graph showing the rate of hard memory faults on the computer. These graphs can be
resized using the Views button. The Overview tab also displays a summary of CPU, disk,
network, and memory usage on the system as follows:
n
CPU Displays the image name, Process Identifier (PID), description, status, number of
threads, current percent of CPU consumption, and average CPU consumption for each
process running on the computer. In addition, you can right-click a process and select
any of the following options:
•
End Process
•
End Process Tree
Please purchase PDF Split-Merge on www.verypdf.com to remove this watermark.
Resource Monitor CHAPTER 21
957
•
Analyze Wait Chain
•
Suspend Process
•
Resume Process
•
Search Online
By selecting the check box for one or more processes, you can filter the information
displayed in the Disk, Network, and Memory sections of this tab.
n
Disk Displays the image name, PID, file name, average number of bytes per second
read from the file, average number of bytes per second written to the file, average
total number of bytes per second read from and written to the file, priority of I/O
transfers, and disk response time in milliseconds for each process accessing the disk
subsystem on the computer.
n
Network Displays the image name, PID, address (IP, NetBIOS, or fully qualified
domain name [FQDN]) to which the process is connected, average number of bytes
per second sent, average number of bytes per second received, and average number
of bytes per second transferred for each process accessing the network subsystem on
the computer.
n
Memory Displays the image name, PID, average number of hard page faults per
second, kilobytes of virtual memory reserved by the operating system for the process,
kilobytes of virtual memory currently in use by the process, kilobytes of virtual
memory currently in use by the process that can be shared with other processes, and
kilobytes of virtual memory currently in use by the process that cannot be shared with
other processes for all processes on the system.
CPU Tab
The CPU tab displays graphs of percent total processor usage, percent processor usage used
by services, and percent processor usage for each logical or physical CPU on the computer.
The CPU tab also displays the following information concerning CPU utilization on the
computer:
n
Processes Displays the image name, PID, description, status, number of threads,
current percent of CPU consumption, and average CPU consumption for each process
running on the computer. In addition, you can right-click a process and select any of
the following options:
•
End Process
•
End Process Tree
•
Analyze Wait Chain
•
Suspend Process
•
Resume Process
•
Search Online
Please purchase PDF Split-Merge on www.verypdf.com to remove this watermark.
CHAPTER 21 Maintaining Desktop Health
958
n
Services Displays the image name, PID, description, status, service group name,
current percent of CPU consumption, and average CPU consumption for each process
running on the computer. In addition, you can right-click a process and perform any of
the following options:
•
Start Service
•
Stop Service
•
Restart Service
•
Search Online
n
Associated Handles By selecting the check box for one or more processes in the
Processes section of this tab, you can display the image name, PID, handle type, and
handle name for each handle associated with the process. You can also search for the
handles associated with a process by typing the name of the process in the Search
Handles box.
n
Associated Modules By selecting the check box for one or more processes in the
Processes section of this tab, you can display the image name, PID, module name,
module version, and full path to the module file for each module associated with the
process. You can also search for the modules associated with a process by typing the
name of the process in the Search Modules box.
Memory Tab
The Memory tab (see Figure 21-7) displays percentage graphs of used physical memory,
commit charge, and hard faults per second. The Memory tab also displays the following
information concerning memory utilization on the computer:
n
Processes Displays the image name, PID, average number of hard page faults per
second, kilobytes of virtual memory reserved by the operating system for the process,
kilobytes of virtual memory currently in use by the process, kilobytes of virtual
memory currently in use by the process that can be shared with other processes, and
kilobytes of virtual memory currently in use by the process that cannot be shared with
other processes for all processes on the system. In addition, you can right-click a pro-
cess and select any of the following options:
•
End Process
•
End Process Tree
•
Analyze Wait Chain
•
Suspend Process
•
Resume Process
•
Search Online
n
Physical Memory Displays a map of how physical memory is being allocated on the
computer.
Please purchase PDF Split-Merge on www.verypdf.com to remove this watermark.
Resource Monitor CHAPTER 21
959
FIGURE 21-7 The Memory tab of Resource Monitor, showing the map of physical memory allocation
note Hard page faults are a better indicator of memory starvation than soft page faults.
A hard page fault occurs when the referenced memory page is no longer in physical mem-
ory and has been paged to the disk. A hard page fault is not an error, but it can indicate
that more memory is needed to provide optimal performance.
Disk Tab
The Disk tab displays a graph of total disk activity on the computer and graphs of disk queue
length for each disk on the system. The Disk tab also displays the following information con-
cerning disk utilization on the computer:
n
Processes With Disk Activity Displays the image name, PID, average number of
bytes per second read from the file, average number of bytes per second written to
the file, and average total number of bytes per second read from and written to the
file for each process accessing the disk subsystem on the computer. In addition, you
can right-click a process and select any of the following options:
•
End Process
•
End Process Tree
•
Analyze Wait Chain
•
Suspend Process
•
Resume Process
•
Search Online
Please purchase PDF Split-Merge on www.verypdf.com to remove this watermark.
CHAPTER 21 Maintaining Desktop Health
960
By selecting the check box for one or more processes in the Processes With Disk
Activity section of this tab, you can filter the information displayed in the Disk Activity
section of this tab.
n
Disk Activity Displays the image name, PID, file name, average number of bytes
per second read from the file, average number of bytes per second written to the file,
average total number of bytes per second read from and written to the file, priority of
I/O transfers, and disk response time in milliseconds for each process accessing the disk
subsystem on the computer.
n
Storage Displays the logical drive number, physical disk number, percentage of time
the disk is not idle, free megabytes on the physical disk, total megabytes of space on
the physical disk, and average disk queue length for each logical drive on the com-
puter.
Network Tab
The Network tab displays graphs of average bytes transferred, number of Transmission Control
Protocol (TCP) connections, and total network utilization for each network connection on
the computer. The Network tab also displays the following information concerning network
utilization on the computer:
n
Processes with Network Activity Displays the image name, PID, average number
of bytes per second sent, average number of bytes per second received, and average
number of bytes per second transferred for each process accessing the network sub-
system on the computer. In addition, you can right-click a process and select any of the
following options:
•
End Process
•
End Process Tree
•
Analyze Wait Chain
•
Suspend Process
•
Resume Process
•
Search Online
By selecting the check box for one or more processes in the Processes With Network
Activity section of this tab, you can filter the information displayed in the Network
Activity section of this tab.
n
Network Activity Displays the image name, PID, address (IP, NetBIOS, or FQDN) to
which the process is connected, average number of bytes per second sent, average
number of bytes per second received, and average number of bytes per second trans-
ferred for each process accessing the network subsystem on the computer.
n
TCP Connections Displays the image name, PID, local address and port number,
remote address and port number, percentage of packet loss, and round-trip latency in
milliseconds for each TCP connection on the computer.
Please purchase PDF Split-Merge on www.verypdf.com to remove this watermark.
Reliability Monitor CHAPTER 21
961
n
Listening Ports Displays the image name, PID, listening IP address, listening port
number, network protocol, and firewall port status for each listening port on the
computer.
Reliability Monitor
Reliability Monitor provides a graphical overview of the stability of a computer over time to-
gether with detailed information about individual events that may affect the overall stability
of the system (see Figure 21-8). Reliability Monitor begins to collect data at the time of system
installation. It then presents that data in a chart format that can be used to identify drivers,
applications, or hardware that are causing stability issues or reliability problems on the com-
puter. You can open Reliability Monitor using any of the following methods:
n
Type reliability in the Start menu search box and click View Reliability History when it
appears in the Programs group.
n
Type perfmon /rel in the Start menu search box or at a command prompt and press
Enter.
n
Open Performance Monitor, right-click the Monitoring Tools node, and select View
System Reliability.
FIGURE 21-8 Reliability Monitor
Reliability Monitor tracks the following five categories of events:
n
Application failures
n
Windows failures
Please purchase PDF Split-Merge on www.verypdf.com to remove this watermark.
CHAPTER 21 Maintaining Desktop Health
962
n
Miscellaneous failures
n
Warnings
n
Information
How Reliability Monitor Works
Reliability Monitor gathers and processes data using the Reliability Analysis Component (RAC)
of Windows 7. Data is automatically collected by the reliability analysis metrics calculation
executable (RACAgent.exe), also known as the RACAgent process. The RACAgent analyzes,
aggregates, and correlates user disruptions in the operating system, services, and programs
and then processes the data into reliability metrics. The RACAgent runs as a hidden scheduled
task named RACAgent to collect specific events from the event log. The RACAgent runs once
every hour to collect relevant event log data and processes data once every 24 hours, so
stability data will not be available immediately after installation.
After the data is collected, the RACAgent processes this information using a weighted
algorithm. The result of the data processing is a stability index number that can vary on a
scale from 0 to 10, with 0 being the least reliable and 10 being the most reliable. The stability
index and the results of the event tracing are then displayed in graphical form over time.
System reliability information is displayed graphically as data points that represent the
reliability index of the system for a specific day or week, depending upon the view selected.
The horizontal axis displays the date range and the vertical axis displays the Stability Index
number. The chart uses icons (red circles for critical events, yellow triangles for warnings, and
blue circles for informational events) to indicate if an event of interest has occurred in one of
the major categories on the indicated day or week. You can access the details of an event or
failure by clicking the day or week the event occurred and then clicking View Technical Details
for the event in the scrolling list box at the bottom. The Stability Index is the primary indicator
of system stability over time based on the data that is gathered and processed by Reliability
Monitor. The graph indicates the value of the stability index over the time range selected.
Reliability Monitor tracks the number of user disruptions per day over a 28-day rolling
window of time, with the latest day of the rolling window being the current day. The Stability
Index algorithm processes the information and calculates the stability index relative to the
current day. Until the Reliability Monitor has collected 28 days of data, the Stability Index is
displayed as a dotted line on the graph, indicating that it has not yet established a valid base-
line for the measurement.
Please purchase PDF Split-Merge on www.verypdf.com to remove this watermark.
Windows Performance Tools Kit CHAPTER 21
963
diReCt FRoM tHe SoURCe
RACAgent Scheduled Task
CSS Global Technical Readiness (GTR) Team
T
he RACAgent is a hidden scheduled task (Microsoft\Windows\RAC\RacTask in
Task Scheduler) that is automatically configured during system installation. This
task is responsible for gathering reliability data and displaying it in chart view. The
RACAgent task typically runs once every hour and will not wake the computer if it is
sleeping. If the computer is a laptop on battery power, RACAgent.exe will imme-
diately exit if the battery capacity is at less than 33 percent. To view the RACAgent
task in Task Scheduler, select RAC in the Task Scheduler library and then right-click
and select View – Show Hidden Tasks in the MMC action pane.
If you do not want to track system stability, you can disable the RACAgent task by
selecting the Disable option, which is accessible in any of the following ways when
the RACAgent task is highlighted in the main MMC pane:
n
Via the action menu
n
Via the action pane
n
Via the shortcut menu for the task
Windows Performance Tools Kit
The Windows Performance Tools (WPT) Kit contains tools designed for analyzing a wide
range of performance problems on Windows 7, Windows Vista, and Windows Server 2008.
The types of performance problems that you can troubleshoot using the WPT Kit include
application start times, boot issues, deferred procedure calls (DPCs), interrupt service routines
(ISRs), system responsiveness issues, application resource usage, and interrupt storms. The
WPT Kit is available as part of the Windows software development kit (SDK) for Windows
Server 2008 or later and the Microsoft .NET Framework 3.5 or later. The WPT Kit is intended
for use by system builders, hardware manufacturers, driver developers, and general applica-
tion developers.
The WPT Kit is available as an MSI installer, one per architecture, and contains the Perfor-
mance Analyzer tool suite, which consists of the following three tools:
n
Xperf.exe Captures traces and post-processes them for use on any machine and
supports command-line (action-based) trace analysis
n
Xperfview.exe Displays trace content in the form of interactive graphs and summary
tables
Please purchase PDF Split-Merge on www.verypdf.com to remove this watermark.
CHAPTER 21 Maintaining Desktop Health
964
n
Xbootmgr.exe Automates on/off state transitions and captures traces during such
transitions
Typical scenarios where you might use Xperf include:
n
Profiling applications or the system itself using sampling profiler mode.
n
Capturing Event Tracing for Windows data for later analysis.
n
Determining whether an application is I/O- or CPU-bound.
To use Xperf to capture a trace of a system, follow these steps:
1. Install the WPT Kit on the system.
2. Turn tracing on using the xperf –on provider command.
3. Perform the activities you want to profile on the system.
4. Capture a log file using the xperf –d logfilename command.
5. Analyze your log file using the xperf logfilename command.
MoRe inFo For more information concerning the Windows Performance Tools, see
To obtain the latest
Windows SDK, see />Event Monitoring
Administrators, developers, and technical support personnel use event monitoring for gather-
ing information about the state of the hardware, the software, and the system, as well as to
monitor security events. To provide these users with useful information, you need to give an
event the right level or severity, raise it to the appropriate log, provide it with the correct at-
tributes, and give it a useful and actionable message.
Understanding the Windows Event Architecture
Prior to Windows Vista, the Windows Event Log API and ETW were separate components. The
Windows Event Log API published events in event logs, such as the System and Application
event logs, while ETW could be used to start event tracing sessions for detailed troubleshoot-
ing of system and application issues.
Beginning with Windows Vista, the Windows event logs and ETW are unified into a single
architecture that provides an always-present, selectively-on logging infrastructure. While the
Windows event logs and ETW integrated with each other in Windows Vista and later, event
logs and ETW generally target two different types of users:
n
ETW Used mainly by developers and for advanced troubleshooting by support pro-
fessionals, ETW must be manually enabled on a computer and generates events at a
Please purchase PDF Split-Merge on www.verypdf.com to remove this watermark.
Event Monitoring CHAPTER 21
965
higher rate (around 10,000 per second) than the event logs. ETW includes the following
features:
•
Defined declaratively in manifests
•
Has localizable strings
•
Has a flexible data model
•
Uses programmatic consumption
•
Has discoverability
n
Event logs Used mainly by system administrators, event logs are always on and typi-
cally generate events at a lower rate (around 100 events per second) than ETW. Event
logs include all the features of ETW, plus the following:
•
Admin-focused tools
•
Centralized event logs
•
Remote collection support
•
Data query support
•
Reduced logging rate
The Windows Event architecture consists of the following:
n
Event Providers These define events and register with the ETW/Event Log infrastruc-
ture using XML manifest files that define the events that can be generated, logging
levels, event templates, and other components.
n
Event Controllers These are used to start and stop tracing sessions on the computer.
n
Event Consumers These register to receive events in real time (from an event channel
or ETW sessions) or from an existing log file (an event log file or trace file).
Channels
To publish an event, the event must be registered using the ETW API. An XML manifest then
defines how the event is published. Windows events can be published to either a channel or
an ETW session.
A channel is a named stream of events. Channels are used to transport events from an
event publisher to an event log file so that an event consumer can get the event. Figure 21-9
shows the structure of the channels and event logs in Windows Vista and later versions.
Windows Vista and later versions include the following types of channels:
n
System System channels include the System, Application, and Security event log
channels. These channels are created when Windows is installed on the computer.
n
Serviced Serviced channels include the following:
•
Admin Events in this channel primarily target administrators, support technicians,
and users. Admin events generally indicate problems that have well-defined solu-
tions that you can act on.
Please purchase PDF Split-Merge on www.verypdf.com to remove this watermark.
CHAPTER 21 Maintaining Desktop Health
966
•
Operational Events in this channel are used for analyzing and diagnosing a prob-
lem with the computer. Operational events can be used to trigger tasks or tools for
troubleshooting problems.
n
Direct Direct channels include the following:
•
Analytic Events in this channel describe problems that cannot be resolved by user
intervention. Analytic events are published in high volume and can be queried but
cannot be subscribed to. Analytic channels are disabled by default.
•
Debug Events in this channel are used by developers or support technicians for
debugging system and application issues. Debug channels are disabled by default.
note Analytic and Debug channel event information should first be converted to the
standard Event Log (.evtx) file format to make it easier to read in Event Viewer.
Application
Log
Log
Log
Log
System
Security
Setup
Microsoft-Windows-<Component>
Log
Log
Operational
Setup
<Company>-<Product>-<Component>
Root
FIGURE 21-9 Event channel/event log structure
By default, an event log file is attached to each channel except the analytic and debug
channels. The event logs for those channels are disabled by default and are hidden from view
in Event Viewer. To make Analytic and Debug event logs visible in Event Viewer, select Show
Analytic And Debug Logs from the View method. Once these logs are displayed, you can
selectively enable them by right-clicking on them and selecting Enable Log.
Please purchase PDF Split-Merge on www.verypdf.com to remove this watermark.
Event Monitoring CHAPTER 21
967
Improvements to Event Monitoring in Windows 7
Previously in Windows Vista, event information (that is, event logs and ETW) could be accessed
using the following methods:
n
Using native and managed APIs programmatically.
n
Using the Event Viewer MMC snap-in.
n
Using the Wevtutil.exe command-line tool.
n
Using the Tracerpt.exe command-line tool.
New in Windows 7 is the additional capability of using Windows PowerShell for scriptable
consumption of event information on both local and remote computers. For more information
concerning this topic, see the section titled “Using Windows PowerShell for Event Monitoring”
later in this chapter.
Other improvements to ETW/Event Logs in Windows 7 include:
n
New Windows events and event providers.
n
Improved data formatting for event consumption.
n
Enhanced performance, scalability, and robustness.
n
Simplified event development for application developers using improved design-time
validation and automatic generation of code from XML.
Using Event Viewer
You can open Event Viewer by using any of the following methods:
n
In Control Panel, select Administrative Tools, Event Viewer.
n
In Computer Management, select System Tools, Event Viewer.
n
Type event in the Start menu search box and click Event Viewer when it appears in the
Programs group.
n
Type eventvwr.exe or eventvwr.msc at an elevated command prompt.
The sections that follow describe how to use the Event Viewer interface for viewing and
managing event logs.
Understanding Views
When Event Viewer is opened, the Overview And Summary screen is displayed (see Figure
21-10), which summarizes all events across all Windows Logs. The total number of events for
each type that have occurred are displayed, with additional columns that display the number
of events of each type that have occurred over the last seven days, the last 24 hours, or the
last hour. Clicking on the + (plus) sign allows you to browse to each event type and display
the Event ID, Source, and Log in which the event occurred. Double-clicking a specific event
summary takes you directly to that event in the log and automatically creates a filtered view
Please purchase PDF Split-Merge on www.verypdf.com to remove this watermark.
CHAPTER 21 Maintaining Desktop Health
968
showing all individual events with that event source and event ID, which can be accessed from
the left pane.
FIGURE 21-10 The Event Viewer snap-in
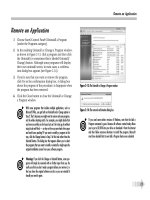
You can configure persistent event filters by using the Custom Views node in Event Viewer.
You can create views automatically by double-clicking events in the summary view, or you can
create views manually. A built-in custom view named Administrative Events shows all events
on the system that may require administrative action by filtering errors and warnings across
all admin logs on the system.
To create a view (filter) manually, follow these steps:
1. Right-click Custom Views and then select Create Custom View.
2. In the Create Custom View dialog box, shown here, enter the criteria for which you
want events displayed.
You can also click the XML tab and enter the XML filter directly. This may be useful
if you are creating an advanced query for which the graphical user interface (GUI)
options in the Filter tab are insufficient. Note that when you have edited a filter in the
XML tab, you cannot return to the Filter tab for that filter.
Please purchase PDF Split-Merge on www.verypdf.com to remove this watermark.
Event Monitoring CHAPTER 21
969
3. Select the fields used to filter events using the following criteria:
n
By Log If you are filtering by log, first select the logs you are interested in. The
Event Logs drop-down list adjusts to the list of logs relevant for those sources.
n
By Source If you are filtering by source, pick the sources of interest first. The
Sources drop-down list adjusts to just the sources available in those logs.
n
Logged Last Hour, Last 12 Hours, Last 24 Hours, Last 7 Days, or Last 30 Days.
Selecting Custom Range brings up the Custom Range dialog box, allowing you to
select a much more specific date range, including when events start and when they
stop.
n
Event Level Select Critical, Warning, Verbose, Error, or Information.
n
Event Logs Click the drop-down arrow to open the Event Log Selection window.
Select the event log or event logs that you want to include in the view.
n
Event Sources Click the drop-down arrow to display a list of available sources for
the selected log so that you can specify which event source(s) to include in the view.
In some cases, certain sources may not be listed (usually this can happen for event
sources from older versions of Windows), in which case you can type in the source
name manually.
n
Include/Exclude Event IDs Enter Event ID numbers or ranges to be included or
excluded, separated by commas. To exclude a number, include a minus sign in front
Please purchase PDF Split-Merge on www.verypdf.com to remove this watermark.
CHAPTER 21 Maintaining Desktop Health
970
of it. For example, typing 1,3,5-99,-76 will include event IDs 1, 3, 5 through 99 and
exclude 76.
n
Task Category Select a task category to filter for events that specify that task
category.
n
Keywords Enter keywords to be included in the filter.
n
User Enter the user name by which to filter the events.
n
Computer Enter the computer name by which to filter events. This will likely be
used when filtering saved logs from other computers or when filtering events for-
warded from several computers on to a centralized log.
4. Click OK, name the view, and then select where the view will be saved. Create a new
folder, if needed, to better categorize custom views you create for various purposes.
By default, custom views defined on a computer will be available to all users on that
computer. To define a custom view private to the current user, clear the All Users
check box before saving the view. Custom views are saved and you may reuse them
any time you run Event Viewer in the future. Furthermore, you can also export custom
views into an XML file at a specified location or imported from an XML file. This allows
administrators to share interesting event views by exporting them to a shared location
and importing into various Event Viewer consoles as needed.
Figure 21-11 shows the default Administrative Events custom view.
FIGURE 21-11 The default Administrative Events custom view
Please purchase PDF Split-Merge on www.verypdf.com to remove this watermark.
Event Monitoring CHAPTER 21
971
Viewing Event Logs
The Application, System, Security, and Setup logs are now located under the Windows Logs
node in the Event Viewer tree view. An event summary view including the name, type, number
of events, and size of each log is displayed when this node is selected. To view events in a log,
select the log you want to view in the left pane.
Hardware Events, Windows Internet Explorer, and other Windows components and
application events are accessible under the Applications And Services Logs node. Applications
And Services Logs are a new category of event logs that store events from a single application
or component rather than events that might have system-wide impact. Normally, available
application or service logs will be listed in a hierarchy under the manufacturer and product
name. (Some event providers that do not follow the naming convention that allows such
categorization may show up directly under the Applications And Services node.) A summary
view, including the name, type, number of events, and size of each log, is displayed when
the Applications And Services node or any subnode that contains logs is selected in the Event
Viewer tree view, as shown in Figure 21-12. If other applications are installed, such as Microsoft
Office 2007 applications, additional Applications And Services Logs may be displayed.
FIGURE 21-12 Summary view of Applications And Services Logs
As explained previously, Application and Services Logs include four log subtypes: Admin,
Operational, Analytic (trace), and Debug logs. Events in Admin logs are of particular interest
to IT professionals who use Event Viewer to troubleshoot problems, because events in the
Admin log provide guidance on how to respond to the event. Events in the Operational log
are also useful for IT professionals but sometimes require more interpretation.
Analytic and Debug logs are not as user friendly and are mostly designed to be used by
advanced administrators and developers. Analytic logs store events that trace an issue, and
often a high volume of events are logged. Debug logs are used by developers when debug-
ging applications. Both Analytic and Debug logs are hidden by default. If you will be working
Please purchase PDF Split-Merge on www.verypdf.com to remove this watermark.
CHAPTER 21 Maintaining Desktop Health
972
with these types of logs and want to see them in the Event Viewer, select the Show Analytic
And Debug Logs menu option from the View item on the Actions pane. Then, to turn logging
into a particular Analytic or Debug log on or off, select the log of interest and click Enable
Log or Disable Log on the Actions pane. Alternatively, you can also enable or disable Analytic
and Debug logs by typing wevtutil sl log_name /e:true at an elevated command prompt.
For more information concerning Wevtutil.exe, see the section titled “Using the Windows
Events Command-Line Utility for Event Monitoring” later in this chapter.
iMpoRtAnt When you enable Analytic (trace) and Debug logs, they usually generate
a large number of entries. For this reason, you should enable them only for a specified
period to gather troubleshooting data and then turn them off to reduce the associated
overhead.
You can view the events in a log by highlighting the log you want to view in the left pane.
Most Microsoft components that have their own channel are displayed under the Microsoft
node, as shown in Figure 21-13.
FIGURE 21-13 Events for different Microsoft components
Please purchase PDF Split-Merge on www.verypdf.com to remove this watermark.
Event Monitoring CHAPTER 21
973
note By right-clicking an event and selecting Attach Task To This Event, you can open the
Task Scheduler Wizard with the Event Log, Event Source, and Event ID fields automatically
pre-populated. Doing this lets you attach any task to an event by using Task Scheduler. For
more information, see the section titled “Using Task Scheduler” later in this chapter.
Saving Event Logs
You can use Event Viewer to save events and open saved event logs for archiving and analysis.
You can save an event log using any of the following formats:
n
Event log (.evtx) file (the default)
n
XML (.xml) file
n
Tab-delimited text (.txt) file
n
Comma-separated text (.csv) file
Saved event logs can be viewed using Event Viewer. The supported formats include the
following:
n
Event log (.evtx) file
n
Legacy event log (.evt) file
n
Trace log (.etl) file
Configuring Event Subscriptions
Using Event Viewer, you can view events on a single remote computer. However, trouble-
shooting an issue might require you to examine a set of events stored in multiple logs on
multiple computers.
Windows Vista and later versions include the ability to collect and forward event infor-
mation from multiple remote computers and store them centrally on the local computer.
To specify which events you want to collect, you create an event subscription. Among other
details, the subscription specifies exactly which events will be collected and in which log they
will be stored locally. When a subscription is active and events are being collected, you can
view and manipulate these forwarded events as you would any other locally stored events.
To use subscriptions, you must first configure the forwarding computers and the collector
computer. Event collecting functionality relies upon the Windows Remote Management
(WinRM) and Windows Event Collector (Wecsvc) services. The WinRM service must be run-
ning on both the remote and local computers participating in the forwarding and collecting
process. The Wecsvc service needs to be running only on the collector computer because the
source computer has a forwarding plug-in that runs in-process to WinRM.
To define a subscription, you must be an administrator on the collector computer. As part
of the subscription definition, you define what security context should be used when accessing
the logs on the source computers. This can be either a specific user account or the collector
Please purchase PDF Split-Merge on www.verypdf.com to remove this watermark.
CHAPTER 21 Maintaining Desktop Health
974
computer account. The specified account must have Read access to the logs on the source
computers that are participating in the subscription. One way to set this up is to use a new
built-in group called Event Log Readers to which you can add any accounts you want to give
access to reading logs.
To configure computers to forward and collect events, follow these steps:
1. Log on to all collector and source computers, which must be running Windows Vista
or later versions. If the computers are members of a domain, it is best to use a domain
account with administrative privileges.
2. On each source computer, type winrm quickconfig at an elevated command prompt.
When prompted, confirm that the changes should be made. To skip the prompt (for
example, if you are using this command in a script), add the –q parameter.
3. On the collector computer, type wecutil qc at an elevated command prompt. (If
you use Event Viewer, this will be done automatically for you on the collector.) When
prompted, confirm that the changes should be made. To skip the prompt, add the
/q:true parameter.
4. Add the computer account of the collector computer to the Event Log Readers group
on each of the source computers if you will be using the computer account as the
account to be used when collecting events. The advantage of using the collector
computer account is that you don’t need to deal with expiring passwords. However, if
you do use a specific user account, you will need to add that account to the Event Log
Readers instead of the collector computer account.
The computers are now configured to forward and collect events. Follow the steps de-
scribed in the section titled “Creating a New Subscription” later in this chapter to specify the
events you want to have forwarded to the collector.
note By default, the Local Users And Groups MMC snap-in does not allow you to add
computer accounts. In the Select Users, Computers, Or Groups dialog box, click Object
Types and then select the Computers check box. You will now be able to add computer
accounts.
note Beginning in Windows 7, you can now use the Set-WsManQuickConfig Windows
PowerShell cmdlet to configure WinRM on the local computer. For more information, see
/>CONSIDERATIONS FOR WORKGROUP ENVIRONMENTS
In a workgroup environment, you can follow the same basic procedure described in the
previous section to configure computers to forward and collect events. However, workgroups
require some additional steps and considerations:
Please purchase PDF Split-Merge on www.verypdf.com to remove this watermark.
Event Monitoring CHAPTER 21
975
n
You can use only Normal mode (Pull) subscriptions.
n
You must add a Windows Firewall exception for Remote Event Log Management on
each source computer.
n
You must add an account with administrator privileges to the Event Log Readers group
on each source computer. You must specify this account in the Configure Advanced
Subscription Settings dialog box when you create a subscription on the collector
computer.
n
Type winrm set winrm/config/client @{TrustedHosts=“<sources>”} at a command
prompt on the collector computer to allow all of the source computers to use NTLM
authentication when communicating with WinRM on the collector computer. Run
this command only once. Where <sources> appears in the command, substitute a
comma-separated list of the names of all of the participating source computers in the
workgroup. Alternatively, you can use wildcards to match the names of all the source
computers. For example, if you want to configure a set of source computers that each
has a name that begins with msft, you could type the command winrm set winrm/
config/client @{TrustedHosts=“msft*”} on the collector computer. To learn more
about this command, type winrm help config at a command prompt.
n
If you configure a subscription to use the HTTPS protocol by using the HTTPS option
in Advanced Subscription Settings, you must also set corresponding Windows Firewall
exceptions for port 443. For a subscription that uses Normal (PULL mode) delivery
optimization, you must set the exception only on the source computers. For a subscrip-
tion that uses either Minimize Bandwidth or Minimize Latency (PUSH mode) delivery
optimizations, you must set the exception on both the source and collector computers.
n
If you intend to specify a user account by selecting the Specific User option in Advanced
Subscription Settings when creating the subscription, you must ensure that the account
is a member of the local Administrators group on each of the source computers in step
4 in the previous procedure instead of adding the machine account of the collector
computer. Alternatively, you can use the Windows Event Log command-line utility to
grant an account access to individual logs. To learn more about this command-line
utility, type wevtutil -? at a command prompt.
CREATING A NEW SUBSCRIPTION
To configure a new subscription on the collector computer, follow these steps:
1. Right-click Subscriptions in the Event Viewer tree view and then select Create Subscrip-
tion, or select the Subscriptions node and click the Create Subscription action in the
Actions pane.
2. In the Subscription Properties dialog box, shown here, enter the Subscription Name.
Please purchase PDF Split-Merge on www.verypdf.com to remove this watermark.
CHAPTER 21 Maintaining Desktop Health
976
3. Select the Destination Log name to save the subscribed events to. By default, the event
subscriptions will be collected in the ForwardedEvents log.
4. Click Select Computers to open the Computers dialog box, shown here.
5. Click Add Domain Computers and add the source computers from which the subscrip-
tion will pull data. The Test button can be used to test connectivity to the selected
computer and ensure that the collector will have access to that computer to collect
events. Click OK when finished adding source computers.
6. Click Select Events to configure the specific events that you want to collect. The Select
Events button presents two options when you click the drop-down list:
n
Edit Opens the Query Filter dialog box to allow the creation of an event filter to
be used for the subscription.
Please purchase PDF Split-Merge on www.verypdf.com to remove this watermark.
Event Monitoring CHAPTER 21
977
n
Copy From Existing Custom View Allows the selection of an existing Custom
View to be used for the subscription.
7. Click Advanced to configure the options shown in the following dialog box. The
Advanced button lets you configure how collected events are delivered and also lets
you specify the account used to manage the process of collecting events. Event Viewer
provides three event delivery optimization options: Normal, Minimize Bandwidth, and
Minimize Latency, as shown here (see Table 21-1 for more information).
TABLE 21-1 Optimization Delivery Options for Configuring Event Collection
EVENT DELIVERY
OPTIMIZATION METHOD DESCRIPTION
Normal Ensures reliable delivery of events and does not attempt to
conserve bandwidth. This is the appropriate choice unless
you need tighter control over bandwidth usage or need for-
warded events delivered as quickly as possible. This method
uses pull delivery mode, batches 5 items at a time, and sets
a batch time-out of 15 minutes.
Minimize Bandwidth Ensures that the use of network bandwidth for event deliv-
ery is strictly controlled. This is an appropriate choice if you
want to limit the frequency of network connections made
to deliver events. This method uses push delivery mode and
sets a batch time-out of 6 hours. This method also uses a
heartbeat interval of 6 hours.
Minimize Latency Ensures that events are delivered with minimal delay. This is
an appropriate choice if you are collecting alerts or critical
events. This method uses push delivery mode and sets a
batch time-out of 30 seconds.
Please purchase PDF Split-Merge on www.verypdf.com to remove this watermark.