Tài liệu Lập trình ứng dụng cho iPhone part 6 ppt
Bạn đang xem bản rút gọn của tài liệu. Xem và tải ngay bản đầy đủ của tài liệu tại đây (802.34 KB, 22 trang )
102
Using
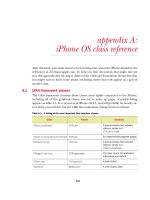
Canvas for web apps
We’ve already discussed two major ways to lay out high-quality iPhone web apps. As
we described in chapter 4, you can create primarily text-based applications that use
the new
HTML extensions of the WebKit. Alternatively, you can use a third-party
library like i
UI to create web pages that look a lot like iPhone native apps, as we
showed in chapter 5.
But what if you want to create graphical web apps for the iPhone, mirroring
items like Clock, Stocks, and Weather? At first this might seem a little daunting,
because we’ve already learned that we can’t use either Flash or
SVG on the iPhone.
Fortunately, Apple has a ready-made answer: Canvas.
Canvas is a scalable vector graphics toolkit implemented as an
HTML tag, with
limited animation functionality accessible through JavaScript, that was created by
This chapter covers:
■
Learning about Canvas
■
Using Canvas to draw simple shapes
■
Using Canvas for animations and other
complex graphics
103Getting ready for Canvas
Apple. It was originally created to build the Mac OS X dashboard utilities, but Canvas
soon afterward made it into the WebKit (and thus into Safari). Apple has continued to
support Canvas not just in mobile Safari, but also generally on the iPhone. The afore-
mentioned Clock, Stocks, and Weather utilities were all built using Canvas native to
the iPhone, so it will be very simple for you to mimic the same functionality when
you’re using Canvas on your web pages—you’ll be using the exact same tools as the
widget designers for the iPhone.
6.1 Getting ready for Canvas
Using Canvas on your iPhone is simplicity itself. There’s nothing to download and no
libraries to link in; it’s already part of the WebKit, as we learned in chapter 4. You just
need to use Canvas-related markup and commands, which will then be correctly inter-
preted by any Canvas-compliant browser. In this section, we’re going to look at how to
enable Canvas and maintain compatibility with other browsers at the same time, and
then we’re going put it all together in an example. We’ll kick things off with the all-
important
<canvas>
tag.
6.1.1 Enabling Canvas
The core of Canvas is the
<canvas>
tag, which defines a panel on your web page that
will display Canvas output:
<canvas id="mycanvas" width=320 height=356></canvas>
The
id
isn’t required, but it’s helpful for referring to the Canvas object. The
width
and
height
attributes define the size of the Canvas object, just like similar attributes
would for an
<img>
tag. Note that we’ve chosen a 320x356 canvas, which happens to
be the size of the live area of an iPhone display in portrait mode.
The graphics within the Canvas object will be entirely controlled by JavaScript. To
get access to them, you’ll need to use JavaScript to define a context for your Canvas
object:
var canvas = document.getElementById('mycanvas');
var context = canvas.getContext('2d');
Note that though we define our context as being of type
2d
, there isn’t any
3d
context
(or any other type for that matter). Canvas is expected to expand in that direction in
the future.
Unfortunately, using Canvas isn’t entirely that simple, and that’s because of the
many different browsers that exist on the World Wide Web.
6.1.2 Ensuring compatibility
Before we go any further, let’s stop a moment and talk about compatibility. If you’re
working on an iPhone web app, you don’t have to worry too much about browsers
other than mobile Safari. You’ve probably already built fallbacks into your iPhone web
apps so that users of Internet Explorer and other browsers won’t be able to access
them, as we discussed in chapter 3.
104 CHAPTER 6 Using Canvas for web apps
But Canvas applies to much more than just web apps. You could use Canvas on
your iPhone-friendly and iPhone-optimized pages too. If you do use Canvas for more
than just web apps, you’ll need to consider what other browsers Canvas runs on.
Although Canvas was originally an internal Apple language, it has since gained
wider acceptance. It has been incorporated into the WebKit and into the
HTML 5 pro-
tocol, and it has been implemented as part of the Gecko browser engine. This means
that it runs not only on Safari and mobile Safari, but also on Firefox version 1.5 or
higher, on Opera version 9 or higher, and on the various WebKit clients that we’ve
already discussed. The holdout, as you’ve no doubt already sussed out, is Internet
Explorer, which many of your users will unfortunately be using.
As a result, if your pages might be viewed by
IE (or other, older browsers), you
should put some compatibility text on your web page, and you must check for the
presence of Canvas in your JavaScript.
The compatibility text on your web page is simple. Just put whatever you want
IE
viewers to see inside the Canvas tag. It’ll be invisible to users with Canvas, and it’ll auto-
matically display to those without:
<canvas id="mycanvas" width=300 height=300>
This page is meant to be displayed on a Canvas-compliant browser. Please
download <a href= from
Apple, or use a modern version of Firefox.
</canvas>
Within your JavaScript code, you can check for the existence of the
getContext
oper-
ation before you start running the rest of your Canvas code:
If (canvas.getContext) {
var context = canvas.getContext('2d');
}
This will ensure that your JavaScript runs cleanly and warning-free whether your users
have access to Canvas or not.
6.1.3 Putting it together
Listing 6.1 puts together the basic Canvas setup and compatibility functionality to
show what a web page using Canvas really looks like. This should be used as the basis
for any of the advanced Canvas work you’ll be doing in this chapter.
<html>
<head>
<title>Canvas Test</title>
<meta name="viewport" content="width=320; initial-scale=1.0; maximum-
scale=1.0; user-scalable=0;"/>
<script type="application/x-javascript">
function drawOnCanvas() {
var canvas = document.getElementById('mycanvas');
if (canvas.getContext) {
Listing 6.1 The parts of a basic Canvas page
Prepares Canvas
for input
105Drawing paths
var context = canvas.getContext('2d');
}
}
</script>
</head>
<body onload="drawOnCanvas();" leftmargin=0 topmargin=0>
<canvas id="mycanvas" width=320 height=356>
This page is meant to be displayed on a Canvas-compliant browser. Please
download <a href= from
Apple, or use a modern version of Firefox.
</canvas>
</body>
</html>
This example just puts together everything you’ve learned so far. On the one hand,
you have your JavaScript, now nicely encapsulated in a function. On the other hand,
you have your simple Canvas object.
The only thing that’s new is what lies between them, a
<body>
tag. This does two
things: First, it sets an
onload
attribute, which makes sure that the JavaScript doesn’t try
to work with your Canvas object until it actually exists. Second, it sets some margins so
that your perfectly sized (320x356) Canvas object appears at the top left of your display.
This example also includes a
viewport
metatag, which should by now be standard
for any iPhone work you’re doing. Besides setting the viewport to a standard iPhone
size for easy reading, this tag also prevents users from resizing the page, which has
been pretty standard in our web apps.
Now that you’ve got your basic coding structure in place, you can use it as the foun-
dation for all the additional Canvas work you’re going to do in this chapter.
6.2 Drawing paths
Canvas builds its drawings around paths, which
are collections of lines, arcs, and invisible moves
between them. You create a new path by describ-
ing any number of these lines, and then you fin-
ish up the path by deciding how it’s going to
look, writing out your whole stack of commands
in the process. Nothing gets printed to the
screen until you dump out everything with a
completion command. This is all done with
JavaScript commands that you include as part of
a
drawOnCanvas
-like function, such as the one
we included in listing 6.1.
All Canvas drawing is done on a two-dimen-
sional grid with an origin at the top left. This is
depicted in figure 6.1.
With these fundamentals of Canvas in hand,
you can now begin drawing.
Runs when bod
y
is loaded, with
margins set
Defines Canvas object
with a simple tag
0,0
X-axis / Width
Y-axis / Height
•
150,50
•
50,150
•
250,250
Figure 6.1 Any Canvas object
maintains its own two-dimensional grid.
106 CHAPTER 6 Using Canvas for web apps
6.2.1 Basic path commands
Table 6.1 lists the basic path commands. They’re divided into three broad types: cre-
ation commands that get you going, draw commands that either draw or move while
you’re working on a path, and completion commands that are used when you’re fin-
ishing a path.
Listing 6.2 shows an example of how to use these commands to draw a simple banner.
This is just the first step in putting together a Canvas application. Things will get more
complex as we learn about additional methods.
var context = canvas.getContext('2d');
context.beginPath();
context.moveTo(10,110);
context.lineTo(10,10);
context.lineTo(40,40);
context.lineTo(70,10);
context.lineTo(70,110);
context.closePath();
context.stroke();
You start by repeating the
getContext
line
B
from the
setup example. The context is important because it’s the
object that gives you access to all of the drawing methods.
For future examples, we’ll always assume that we have
defined a context by the name of
context
. After creating
the context, you draw a path that defines an image, as
shown in figure 6.2.
Any path must start off with a
beginPath
line
C
. This
clears off the drawing stack and resets your virtual pencil to
the origin point of 0,0. As a result, most Canvas methods
Table 6.1 A variety of simple JavaScript commands help you create, draw, and finish basic Canvas paths
Method Type Variables Summary
beginPath
Creation method Starts a new path
lineTo
Draw method x,y Moves the virtual pencil visibly
moveTo
Draw method x,y Moves the virtual pencil invisibly
closePath
Draw method Completes a path by drawing back to the first point
fill
Completion method Draws a path by filling in the space between
visible lines
stroke
Completion method Draws a path by just drawing the visible lines
Listing 6.2 Simple Canvas commands draw quick two-dimensional shapes
B
C
D
E
F
G
Figure 6.2 This simple
banner was drawn with
eight path commands.
107Drawing paths
will follow the
beginPath
with a
moveTo
D
, to get the virtual pencil to where you want
to start drawing without actually drawing anything in between.
For this example, you next use a set of four
lineTo
methods
E
to draw an M-
shape. Because these are lines, they’ll display when you complete your path.
The
closePath
F
that ends the drawing is entirely optional. It’s really just a short-
hand way to draw a line between the final point that you explicitly designated and the
point that you began drawing at.
But none of this appears on the screen until you use a completion method
G
. You
can use
stroke
, as in this example, to just draw the line, or alternatively you can use
fill
, to color everything in. Note that when you use a
fill
command, you don’t need
a
closePath
command; instead, Canvas will automatically close your shape for you.
6.2.2 Curve commands
Once you’ve learned about lines, you’ve just got one other fundamental drawing tool
in Canvas: the curve. Three different curve commands are available to you: the arc
(which is available through two different methods), the quadratic curve, and the
Bezier curve. These are summarized in table 6.2.
Each of these curves requires more explanation, because they work slightly differently
and the two types of Bezier curves are somewhat complex.
THE ARC
arc
is a standard circle (or arc) command, and it is the easiest curve method to use.
But you need to be slightly careful in its use for two reasons.
First, it steps outside the standard paradigm for the drawing methods. Rather than
explicitly defining the endpoints of your arc as data points on your grid, you instead
define a center point, a radius, and the endpoints as angles. This makes drawing a cir-
cle pretty simple and intuitive, but it can cause problems if you’re drawing the arc as
part of a stack of paths, in which case you must first move to where your arc will start
to avoid leaving behind an unsightly path.
Second,
arc
defines everything in radians. If you don’t remember your high school
geometry, 2π radians is a full circle, the same as 360 degrees. Odds are that you’ll be
thinking of things in terms of degrees, in which case you’ll have to multiply everything
by π/180 in order to convert.
Table 6.2 Canvas supplies four methods for drawing curved paths.
Method Type Variables Summary
arc
Draw method x, y, radius, startangle,
endangle, anticlockwise
Draws a circle or an arc of a circle
arcTo
Draw method x1,y1,x2,y2,radius Draws an arc from point to point
quadraticCurveTo
Draw method cpx,cpy,x,y Draws a quadratic Bezier curve
bezierCurveTo
Draw method cpx1,cpy1,cpx2,cpy2,x,y Draws a cubic Bezier curve
108 CHAPTER 6 Using Canvas for web apps
Of the variables only the last, anticlockwise, requires any additional explanation.
It’s set to either true or false and defines the direction in which the circle is drawn
from the start angle to the end angle. Why “anticlockwise” instead of “clockwise,” you
ask? It’s another standard when using radians.
Once you’ve got these basics, you can draw a circle. The following example draws
a 33 radius circle centered at 150,150:
context.beginPath();
context.arc(150,150,33,0,360*Math.PI/180,true);
context.fill();
You can also use the
arc
command to draw, well, arcs. The follow example draws a
center point and then two arcs around it:
context.beginPath();
context.arc(150,150,2,0,360*Math.PI/180,true);
context.fill();
context.beginPath();
context.arc(150,150,20,0,90*Math.PI/180,true);
context.moveTo(185,150);
context.arc(150,150,35,0,90*Math.PI/180,false);
context.stroke();
The results of this are shown in figure 6.3, which better
shows off some of the functionality we’ve been talking
about.
Both of the arcs in figure 6.3 center around 150,150
with radiuses of 20 and 35 respectively. They both run
from 0 degrees to 90 degrees, but the first one goes anti-
clockwise, resulting in three-quarters of a circle, while the
second goes clockwise, resulting in one-quarter of a circle.
Simple calculation tells us that the first arc runs from 170,150 to 150,170 while the
second runs from 185,150 to 150,185. If not for the
moveTo
in between them, a
straight line would have been drawn from 150,170 to 185,150 as part of the path that
you’re drawing. If you’d like to test this out, just input the code, but leave out the
moveTo
method.
THE ARCTO
Note that there is also a second command,
arcTo
, which can be used to draw arcs
from one point to another. It more closely matches the draw-to paradigm that you’ve
used before, where you draw simple figures connecting one point to the next one.
THE BEZIER CURVES
The two Bezier curves also match this draw-to paradigm: your virtual pencil is on the
canvas and you’re drawing to another point. But Bezier curves don’t necessarily draw
very symmetric arcs.
That’s pretty much the definition of a Bezier curve. Each one has at least one con-
trol point, which defines how the curve changes—whether it’s steep or shallow, and
over which parts of the curve. The quadratic Bezier curve (
quadraticCurveTo
) has
Figure 6.3 Two simple arcs
are drawn around a central dot.
109Drawing paths
one control point that connects to both endpoints, and the cubic Bezier curve
(
bezierCurveTo
) has two control points, one per endpoint. If you’ve ever worked with
Adobe Illustrator, those lines that you drag off of the vertices of figures that you’ve
drawn are control points that allow you to make Bezier curves.
Listing 6.3 shows the commands required to draw two Bezier curves.
context.beginPath();
context.moveTo(20,200);
context.quadraticCurveTo(20,20,200,20)
context.moveTo(40,300);
context.bezierCurveTo(180,270,150,240,300,40);
context.stroke();
Figure 6.4 shows what the output of listing 6.3 looks like. To the left, we have it as it
appears on the iPhone screen; to the right, we have a version with the control points
and the endpoints drawn in for additional clarity.
We’ll offer one final caveat on these Bezier curves: they’re tricky to use. The qua-
dratic curve can be used for some nice rounded corners without too much trouble,
but figuring out what the cubic curve will look like is entirely trial and error. If you’ve
got a good drawing program that will let you accurately measure the positions of
Bezier curves, you might want to use that as your whiteboard; otherwise you’ll need to
keep inputting control points and seeing how they look on the screen.
Lines and curves may be good, but how can you use them to draw actual stuff? As it
happens, Canvas has a very limited selection of more complex shapes that you can
draw, forcing you to often fall back on your ingenuity.
Listing 6.3 Bezier curves allow for smooth arcs between two points
Figure 6.4 The Bezier
curves (left) were drawn
using the depicted
control points (right).
110 CHAPTER 6 Using Canvas for web apps
6.3 Drawing shapes
There is only one shape in the standard Canvas library, and that’s the rectangle.
Beyond that, you can write your own functions to draw other shapes.
6.3.1 Drawing rectangles
You can draw rectangles in three different ways, two of which are closely related to the
stroke and fill commands that we’ve already seen. These possibilities are all described
in table 6.3.
These integrated methods take care of everything for you. There’s no need to sepa-
rately begin a path, then later draw it. Instead, everything is done in one easy method.
The following code would draw one square inside of another:
context.fillRect(100,100,150,150);
context.clearRect(125,125,100,100);
context.strokeRect(150,150,50,50);
Note that in each of these method calls, the x,y
values define the top left of the rectangle, which is
then drawn out from that location. The results are
shown in figure 6.5.
We haven’t dwelled on it much so far, but shapes
in Canvas are drawn one on top of another, in the
order of invocation (or at least they are when you
use the default composition method, a topic we’ll
return to). Here, you drew a filled square (using the
fillstyle
attribute of the context, which we’ll also
cover in a minute), then cleared the space, and
finally drew a stroked square atop it all.
Note that the
clearRect
command effectively
acts as an eraser for a rectangle of space. It’ll be useful when you’re drawing on top of
other drawings, as you did here, or when you’re playing with animation down the line.
6.3.2 Writing shape functions
Unfortunately, the rectangle is the only shape that is directly built into Canvas. You
can create a circle pretty simply using the
arc
command, but from there you’re
Table 6.3 Three rectangle commands allow simpler access to these shapes, without using paths.
Method Type Variables Summary
clearRect
Integrated method x,y,width,height Clears the area
fillRect
Integrated method x,y,width,height Draws a filled rectangle
strokeRect
Integrated method x,y,width,height Draws a rectangle outline
Figure 6.5 A stack of three
rectangles are drawn one atop another.
111Drawing shapes
entirely on your own. If you’re planning to draw a lot of shapes in your Canvas pro-
gram, you’ll probably want to write your own shape functions. Because Canvas does all
of its work through JavaScript, this is easy to do, as shown in listing 6.4.
function rhombus(context,x,y,length,angle,style) {
context.beginPath();
context.moveTo(x,y);
width = length * Math.sin(angle/2);
height = length * Math.cos(angle/2);
context.lineTo(x-width,y-height);
context.lineTo(x,y-2*height);
context.lineTo(x+width,y-height);
context.closePath();
if (style == 'fill') {
context.fill();
} else {
context.stroke();
}
}
Going back to high school geometry once more (and, to be frank, we had to look it up
ourselves), a rhombus is a type of equilateral quadrangle, which is to say a four-sided
polygon where all the sides are of equal length.
We’ve decided to define our rhombuses by the bottom-most point (
x
,
y
), the size
of the angle just above that point, in radians (
angle
), and the length of one of its
sides (
length
). We’ve also included an option to fill or stroke the rhombus (
style
).
Finally, with a bit of trigonometric magic (and, yes, we had to look that up too), we
were able to draw a simplistic rhombus (with a very specific orientation) based on
those properties.
Here’s how our rhombus function could be put to use:
rhombus(context,100,100,25,45*Math.PI/180,'fill');
rhombus(context,150,100,25,90*Math.PI/180,'stroke');
The results are shown in figure 6.6.
You’ll note that the unfilled rhombus is a
rotated square, another shape function that you
could write for Canvas. The exact shapes you’ll
want to use in your graphical iPhone web apps
will probably vary, but they should be as easy to
program as this one.
We’ve now completed our look at the basic
line-drawing functionality in Canvas, so the
next question is how to make those lines more
attractive.
Listing 6.4 An example of a rhombus function
Figure 6.6 Our shape function allows
for a variety of rhombuses to be drawn.
112 CHAPTER 6 Using Canvas for web apps
6.4 Creating styles: colors, gradients, and lines
Plain black lines aren’t going to cut it for an iPhone web app. Fortunately, in Canvas
it’s easy to modify your simple lines and fills by applying styles and changing other
variables.
6.4.1 Color styles
Separate styles can be used to modify the colors of fills and strokes. These properties
are summarized in table 6.4.
Note that both
fillStyle
and
strokeStyle
affect the following fill (or stroke)
commands. This means that the most recently input style will affect the entire path
stack when it’s drawn. Earlier ones will be ignored, so if you want to have different
shapes with different styles, you’ll need to clear the stack after each one with a fill or
stroke command.
The actual color definition can be made via most
CSS3 definitions. You can use rec-
ognized words, #RGB values,
rgb
values, or even
rgba
values. Here are four ways to set
your fill style to red:
context.fillStyle = "#ff0000";
context.fillStyle = "red";
context.fillStyle = "rgb(255,0,0)";
context.fillStyle = "rgba(255,0,0,1)";
In the
rgba
example, the last value is for alpha transparency, set between 0 and 1. If
you decrease that value, you’ll make your upcoming fills or strokes partially transpar-
ent. You’ll also meet
globalAlpha
, a global transparency variable, down the line. It’ll
allow you to change the alpha transparency value of everything you’re drawing—but
the
rgba
command is more convenient for most usage (at least until you start saving
and restoring states).
6.4.2 Gradient styles
Besides colors, you can also produce good-looking gradients in Canvas. These are of
particular note because gradients are used throughout the iPhone’s user interface.
Thus, using gradients will be a notable step toward creating an iPhone-like interface
for your graphical web app. Table 6.5 lists the methods required to create gradients;
we’ll then apply them to fill (and stroke) styles, just like we did with basic colors.
The
createLinearGradient
and
createRadialGradient
methods each define
how your gradient will be drawn. With
createLinearGradient
you’re defining a
Table 6.4 By setting variables, you can choose how your fills and strokes look.
Property Type Value Summary
fillStyle
Style variable CSS3 Color Sets subsequent fills to the color
strokeStyle
Style variable CSS3 Color Sets subsequent strokes to the color
113Creating styles: colors, gradients, and lines
simple vector. The x1,y1 point is the start of your gradient (the 0 point for color stops,
which we’ll get to momentarily) and the x2,y2 point is the end of your gradient (the 1
point). The
createRadialGradient
method creates a slightly more complex two-
dimensional array of vectors. The circle defined by x1,y1,r1 defines the start of your
gradient (0), and the x2,y2,r2 points defines its end (1). Because of this complex defi-
nition of radial gradients, you can do something that you can’t do in most drawing
programs: define an asymmetrical gradient.
Once you’ve got your gradient defined, you can then add color stops to it with
the gradient’s
addColorStop
method. Color stops are defined on your gradient
between 0 and 1, which are the two endpoints we already met. Like other styles, they
use
CSS3 colors.
Listing 6.5 shows how a linear gradient is created and then applied to the rhombus
function we created earlier; radial gradients are formed similarly.
var gradient = context.createLinearGradient(0,100,0,300);
gradient.addColorStop(0,'rgba(255,0,0,0)');
gradient.addColorStop(1,'rgba(255,0,0,1)');
context.fillStyle = gradient;
rhombus(context,200,200,50,Math.PI/3,'fill');
When you create a new gradient, you assign its value to a variable
B
. This variable
comes with the
addColorStop
method, the first method we’ve met that doesn’t derive
from Canvas’s context object. You can use that method to
assign as many color steps as you want, though here we’ve
got the minimalist case of just two
C
.
This example uses an
rgba
method to define its colors,
to allow for a nice fadeout, but as we’ve noted before, you
can use any
CSS3 color definition. A gradient from one
color to a distinct color would work just the same.
You finally apply the gradient to a fill style
D
, and then
draw
E
using that style. All upcoming draw commands will
use the same gradient until you change it out for something
else. The results are shown in figure 6.7.
Table 6.5 Fill and stroke styles can include intricate gradients created by a suite of special gradient
methods.
Method Type Variables Summary
createLinearGradient
Style creation method x1,y1,x2,y2 Creates a linear
gradient’s vector
createRadialGradient
Style creation method x1,y1,r1,x2,y2,r2 Creates a radial
gradient’s vectors
addColorStop
Style creation method position,color Adds a color to a gradient
Listing 6.5 Instead of a color, you can apply a gradient as a style
B
C
D
E
Figure 6.7 Gradients allow
for attractive coloring.
114 CHAPTER 6 Using Canvas for web apps
6.4.3 Line styles
Before we finish our look at how to modify lines and fills, we’re going to look at one
last thing: line styles. These additional variables can be used to really define how your
lines look. You probably won’t use these nearly as much as colors and gradients, but
we nonetheless list them in table 6.6 for the sake of completeness.
These values are all properties of the Canvas context and can be set accordingly:
context.lineCap = 'round';
Of the four variables,
lineCap
and
lineJoin
will be used pretty infrequently and
miterLimit
even less so. Most of the time, you’ll be happy with the defaults—butt for
lineCap
, miter for
lineJoin
, and no miter limit. But
lineWidth
is of more relevance.
This is the value that most drawing programs call the stroke width. It’s initially set to a
unit of 1 pixel, and if you need thicker lines, this is the value to change.
There’s still a bit more that you can do to modify your shapes and lines: you can
choose not to show some of them.
6.5 Modifying composition and clipping
You can make your shapes and lines partially invisible three ways: by turning on alpha
transparency, by changing the composition method, and by creating clipping paths.
These possibilities are summarized in table 6.7.
The global variables are the simplest—but least precise—ways of controlling
shapes. Clipping paths use the path functionality that you’ve already learned to define
exactly how your shapes are drawn.
Table 6.6 You can get really picky about how your lines look by modifying their styles with a final set of
variables.
Property Type Value Summary
lineCap
Style variable butt,round,square Defines what the end of a line looks like
lineJoin
Style variable bevel,round,miter Defines how two lines come together
miterLimit
Style variable (number) Defines the upper limit of when to use a miter
join; above that, a bevel join is used instead
lineWidth
Style variable (number) Defines the width of a line’s stroke
Table 6.7 Two global properties and one method can be used to adjust precisely how your shapes are
drawn.
Method or property Type Value Summary
globalAlpha
Global variable 0 to 1 Sets transparency
globalCompositeOperation
Global variable (numerous) Sets composite method
clip
Completion method Creates clipping path
115Modifying composition and clipping
6.5.1 Global variables
As the names
globalAlpha
and
globalCompositeOperation
suggest, each of them is a
global variable that modifies everything you draw.
globalAlpha
sets the transparency level of everything that follows it from fully
transparent (0) to fully opaque (1). The default value is 1:
context.globalAlpha = .1;
globalCompositeOperation
defines what happens when shapes are drawn one on top
of each other. The default value is
source-over
, which means that newer shapes are
drawn on top of older shapes, as we saw when we were drawing rectangles (in figure 6.5),
and its opposite is
destination-over
. But a variety of more interesting operations may
be used to exclude, combine, or otherwise change the way overlapping shapes are com-
posited. Table 6.8 describes these possibilities.
Just as with
globalAlpha
, all you need to do is set the property to make the
change:
context.globalCompositeOperation = "darker";
Table 6.8 The
globalCompositeOperation property changes what happens when you draw
shapes on top of each other.
Value Type Summary
source-over
Stacking choice New shapes are drawn on top of existing content.
destination-over
Stacking choice New shapes are drawn behind existing content.
copy
New dominant Only the new shape is drawn.
source-in
New dominant Only the new shape is drawn, and only where the two
overlap.
source-out
New dominant Only the new shape is drawn, and only where the two
don’t overlap.
destination-atop
New dominant The new shape is fully drawn, and the old shape is only
drawn where they overlap.
destination-in
Old dominant Only the existing content is drawn, and only where the two
overlap.
destination-out
Old dominant Only the existing content is drawn, and only where the two
don’t overlap.
source-atop
Old dominant The existing content is fully drawn, and the new shape is
only drawn where they overlap.
lighter
Blending choice Where the shapes overlap, the color value is added.
darker
Blending choice Where the shapes overlap, the color value is subtracted.
xor
Blending choice Where the shapes overlap, nothing is drawn.
116 CHAPTER 6 Using Canvas for web apps
Much as with the composition tools that you find in professional painting programs, if
you want to use any of the more complex options like the blending choices, you’ll
probably need to test things out until you get a result you like.
6.5.2 Clipping paths
Clipping paths are much easier to figure out without seeing them first. They work as part
of the path-creation tools that we discussed in section 6.2. You start a path with
begin-
Path
, and then you use any number of lines, moves, arcs, or Bezier curves to draw. But
when you’re done, instead of using the stroke or fill methods, you use the
clip
method.
Instead of drawing the path, Canvas uses
clip
to bound what’s drawn afterward.
The following example shows a circle being used as a clipping path, restricting the
square that’s drawn under it:
context.beginPath();
context.arc(100,250,50,0,360*Math.PI/180,'true');
context.clip();
context.fillStyle = 'gray';
context.fillRect(50,230,100,100);
The square is thus drawn only inside the arc. The result is similar to what you can get
with the
globalCompositeOperation
values that make one shape dominant over
another, but we find clipping to be a more intuitive
method. You don’t have a bunch of weird names to
remember, and it’s more obvious that you’re creating a
specific shape to clip whatever appears after it. The
results of this simple clipping are shown in figure 6.8.
Before we finish our look at Canvas basics, we’re
going to cover two last methods you can use to change
the basics of a drawing.
6.6 Transforming and restoring
By now you’ve probably figured out that Canvas is a pretty fully featured scalable vec-
tor graphics program. You don’t just have basic functionality, but also a lot of subtlety.
Here we’re going to cover the last two methods that you can use to really change the
basics of your drawing: transformations and state stacking.
6.6.1 Transformations
Transformations are operations that allow you to change the grid that you’re drawing
on in various fundamental ways. There are three simple transformation methods, as
described in table 6.9.
These methods should all work as advertised. Note that the
rotate
method uses
radians, as usual. You can make transformations, change them, and reverse them, as
you see fit. The following line, for example, would move our origin to the center of
our 320x356 grid:
Context.translate(160,178)
Figure 6.8 A circle clips the
filled rectangle drawn after it.
117Incorporating images, patterns, and text
This is another area where the next question is probably: why? These transformations
are solely intended to make your drawing code easier to write. Certain symmetrical
shapes might be easier to draw if you center them on the origin, so you might use
translate
. Similarly,
rotate
could make it easier to draw a symmetrical array of
shapes. Finally,
scale
could be useful if you want to draw something notably larger or
smaller than the rest of your canvas.
6.6.2 State stacking
In these last three sections we’ve covered quite a few fundamental tools that you can
use to create your graphics: fill styles, stroke styles, line styles, global composition vari-
ables, global alpha variables, clipping paths, and transformations. Piling all of these
Canvas changes together can get confusing; worse, they can really limit the order in
which you can do things.
Fortunately, there’s a way that you can save the current state of these global vari-
ables and later restore them. It uses two methods, as described in table 6.10.
All states are maintained in a stack. As noted,
save
pushes the current state onto a
stack, and
restore
pops the last one off of it. Clearly, you can maintain a long history
of states if it’s useful. Generally, the best usage of these commands is to save the cur-
rent state just before you make any global change that will be temporary in nature,
and then
restore
when you’re done. They’re easy to use, and you can see an example
of these methods in use shortly, in listing 6.6.
Now that we’ve finished with all the basics of Canvas, we can move on to a topic
that will help our graphical web apps look even more like the native iPhone apps:
using images and text.
6.7 Incorporating images, patterns, and text
As you’ll see, images are well supported in Canvas. There are a variety of ways to pull
in pictures to really rev up your Canvas application. Unfortunately, the same can’t be
said for text.
Table 6.9 Transformations allow you to move your origin or change your grid.
Method Type Variable Summary
translate
Transformation method x,y Moves the canvas origin to x,y
rotate
Transformation method angle Rotates the canvas by angle
scale
Transformation method xmult,ymult Scales the canvas x in width, y in height
Table 6.10
Save and restore allow you to maintain states for your global variables.
Method Type Variable Summary
save
Style method (none) Pushes the current state
restore
Style method (none) Pops the last state
118 CHAPTER 6 Using Canvas for web apps
6.7.1 Image commands
The trickiest part of using an image in your graphical web app is importing the image
itself. In order to use an image in Canvas, you’ll need to have an Image JavaScript
object. The easiest way to get one is to import the image using the
Image
functionality.
You’ll probably want to use a nice PNG-24 image, which is a great choice to use with
Canvas because it supports transparency and an 8-bit alpha channel, meaning that you
can put these images straight on top of other objects and still have them look good.
Here’s how to import an image from a file:
var myImage = new Image();
myImage.src = '/smiley.jpg';
You don’t want these commands to go inside the
onLoad
part of your JavaScript;
instead, you want to get that image loading as fast as possible so that it doesn’t slow
down the drawing of your canvas when you actually use it.
Besides loading an image from a file, you can also use an image that’s already
loaded on the page. This same functionality can even be used to import a Canvas
object! The simplest way to do this is probably with the
document.getElementById
JavaScript method, which can be used in place of an image variable. In the case of
importing a Canvas object, make sure that the Canvas object you’re importing has
been drawn upon first.
Why would you want to duplicate an image already on your page inside your Can-
vas object? It can help you to control whether all your images are loaded before you
get started. Just place the images in
<div>
s that don’t display.
Once you’ve got an image object, you can access it with two methods, as described
in table 6.11. The
drawImage
method is listed three times, because it can be called in
three different ways.
The following example shows the three different ways to draw a 150x150 smiley face:
context.drawImage(myImage,0,0);
context.drawImage(myImage,150,150,50,50);
context.drawImage(myImage,0,75,150,75,125,125,50,25);
Table 6.11 External images can be drawn or used as patterns in Canvas.
Method Type Variables Summary
drawImage
Draw method image, x, y Draws an image at x,y
drawImage
Draw method image, x, y, width, height Draws an image at x,y scaled to
width,height
drawImage
Draw method image, slicex, slicey,
slicewidth, sliceheight,
x, y, width, height
Takes a slice from the original image
starting at the image’s slicex,slicey,
of size slicewidth,sliceheight, and dis-
plays it at the canvas’s x,y, scaled to
width,height
createPattern
Draw method image, repeat Creates a pattern variable
119Incorporating images, patterns, and text
The first line draws it at full size. Note that the x,y coordinate is for the top left of the
image, so this one is drawn from 0,0 to 150,150.
The second draws it at one-third size from 150,150 to 200,200.
The third
drawImage
method is the most confusing because it rearranges the
order of the arguments. Here we’re taking a slice of the original image, starting
at 0,75 that’s 150 wide and 75 tall. In other words, it’s the bottom half of our 150x150
image. Then we’re drawing it on our Canvas at 125,125, scaled down to a size
of 50x25, which is again one-third size because our half of the image is 150x75.
6.7.2 Pattern commands
Patterns work slightly differently. They’re a new type of fill style (or stroke style) that is
made out of an image but that otherwise works the same as colors and gradients.
Once again, you must be sure that the image object is fully loaded before calling this
method. The following example shows an image being turned into a pattern that’s
then used when creating our old friend the rhombus:
var myPattern = context.createPattern(myImage,'repeat');
context.fillStyle = myPattern;
rhombus(context,100,100,50,Math.PI/3,'fill');
The
createPattern
method can take four different repeat values:
repeat
,
repeat-x
,
repeat-y
, or
no-repeat
, each of which repeats the pattern in a different direction (or
not at all).
When you’re using patterns, you probably want them to be small textures (not like
our large smiley face). You may want to use them as a backdrop for your entire canvas,
which you can do by patterning a rectangle the size of the canvas. You may even want
to use this method to pregenerate some images, rather than drawing them on the fly.
We’ve got a screenshot of both these sorts of images in the example that finishes
off this section, just a page or two hence.
6.7.3 Text commands
Now you’ve learned all the basics of creating stuff in your Canvas app, including
shapes, colors, and images. Next you probably want to know how to embed text:
unfortunately, you can’t, using the Canvas standards. As of this writing, text is not sup-
ported, but it looks like it may be soon, because
fillText
and
strokeText
variables
were recently added to the Canvas standards. Until those features make it to Safari,
there are some alternatives.
First, you can choose to draw your letters by hand, essentially creating new vector
fonts. It certainly sounds like a pain in the neck, but it’s possible to build up a library
of functions for all the letters.
Second, you can play similar tricks by creating images for each letter and then
loading those with the
drawImage
method. You can put these all into one image file
and then show only the appropriate letter by using the most complex invocation of
drawImage
, which allows you to pull a slice from the original file.
120 CHAPTER 6 Using Canvas for web apps
Third, you can use overlaying HTML
<div>
s—just the sort of absolute positioning
that we’ve argued against elsewhere in this book (but which is perhaps necessary in
this situation).
Discussions on this topic are scattered across the internet, alongside individuals’
solutions for them. At the time of writing, none of the library solutions were compre-
hensive enough for us to recommend them here, but take a look around if you need
text in your Canvas object and you don’t want to write the routines yourself.
With that disappointment behind us, we’re going to finish our look at Canvas by
seeing how to put it all together.
6.8 Putting it together
Having shown lots of stand-alone Canvas methods, we’ll now show how a variety of
shapes can be painted onto a single Canvas object. Figure 6.9 includes a pair of
screenshots that show off most of the Canvas functionality that we’ve discussed.
Figure 6.9 Canvas allows for a wide variety of shapes to be created from a small set of primitives, as
this combination of images, patterns, curves, and shapes shows.
121Applying animation
Here we want to once more note that order matters. In this example, the gray back-
ground rectangle was drawn first, then everything else on top of it. The smile was
drawn after the gradient rhombus that’s below it (and here we can see the advantages
of using
PNG-24, because the blending looks good thanks to that extra alpha chan-
nel). The rhombus at the top of the page was similarly drawn as two parts: first a rhom-
bus filled with a pattern, and then a stroked rhombus to give it a clear delineation.
Finally, the circular clipping path was the penultimate command, because it clipped
everything after it—here, just a rectangle that ends up looking like a bowl thanks to
the clipping.
fillStyle
was also changed a number of times within the example, each
time before the next object was drawn.
With that example, we’re pretty much done explaining Canvas’s basic methods.
What we’ve discussed so far is the core of how Canvas is intended to work, and these
are probably the methods you’ll use most in making graphical iPhone web apps. But
Canvas also does have some limited animation abilities that we’ll examine to finish up
this chapter.
6.9 Applying animation
We’re going to start with a caveat: Canvas isn’t really intended for animation. You can
do it (depending on the good graces of your user’s CPU), but unlike with Flash, ani-
mation is not a core purpose of the programming language. This means that when-
ever you do animation with Canvas, it’s going to be a lot awkward and a little
kludgy—and thus, it’s generally something that you should use as spice in your graph-
ical web app, and not as the main course.
You’ll have to overcome two main obstacles when animating using Canvas. First,
you have to deal with the fact that Canvas doesn’t have any animation methods.
Worse, once things are drawn on the canvas, they stay on the canvas. That means that
whenever you animate, you have to clear your canvas (using
clearRect
), draw your
background, and draw your figure, and then clear your canvas, draw your back-
ground, and draw your somewhat changed or moved figure, and so on. You repeat
this exercise throughout the animation.
Second, you should note that whenever you’re writing to the canvas with a function,
nothing gets written to the canvas until the function is completed. Thus, you can’t use
anything obvious like a
for
loop to do an animation. Instead, you have to draw, end your
function, then later call it again with
setInterval
,
setTimeout
, or an event handler.
Listing 6.6 shows how to do a simple animation using our old friend the rhombus
function.
function initCanvas() {
var canvas = document.getElementById('mycanvas');
if (canvas.getContext) {
setInterval(animateRhombus,500);
Listing 6.6 An animation of a changing rhombus
B
122 CHAPTER 6 Using Canvas for web apps
}
}
function animateRhombus() {
var context = document.getElementById('mycanvas').getContext('2d');
context.clearRect(0,0,320,356);
context.save();
context.fillStyle = "#dddddd";
context.fillRect(0,0,320,356);
context.restore();
context.save();
var gradient = context.createLinearGradient(0,125,0,300);
gradient.addColorStop(0,'rgba(255,0,0,0)');
gradient.addColorStop(1,'rgba(255,0,0,1)');
context.fillStyle = gradient;
var time = new Date();
rhombus(context,200,200,50,
(time.getSeconds()%10 + 1)/20*Math.PI+.5*Math.PI,
'fill');
context.restore();
}
As suggested, this programs kicks off your animation with a
setInterval
statement
B
.
Every 500 milliseconds, you call the
animateRhombus
function. That routine starts off by
clearing your canvas
C
, and then it fills in your background
E
as required. Note that
you make use of the
save
function
D
, along with
restore
G
, so that you don’t have to
keep track of which styles you’ve set at which time.
Your actual animation is done with a call to the
rhombus
routine
F
. You use the sys-
tem clock to control the animation. This recognizes ten different frames and loads a
new one each second. Each frame uses a different value for the rhombus angle, with
the result being an animated rhombus that starts off as a square (angle = π radians)
and then collapses down toward a line (angle = .5π radians).
Clearly, other animations are possible using shapes, lines, or even images. It’s easy
to imagine an animated version of figure 6.9 where the heat lines above the bowl fluc-
tuate, thanks to changing Bezier curves, or where the smiley face changes by pulling
up different image files. Global variables or other means could be used to control the
animation if a clock doesn’t do the job.
For our purposes, however, the time has come to close the book on Canvas, and to
move on to the last aspect of iPhone web development: tools.
C
D
E
G
D
F
G
123Summary
6.10 Summary
In the previous two chapters, our advice on preparing web apps for the iPhone had a
distinctly textual focus. Fortunately, Apple provides a tool that you can use to add
great-looking graphics to your iPhone web apps: Canvas. Though its animation func-
tionality is somewhat limited, it does a great job of creating vector-based graphics.
One of the best things about learning Canvas is that its penetration of the browser
market is only going to grow. You can already view your iPhone Canvas code on Safari,
Opera, and Firefox. As the
HTML 5 standard moves toward completion, even Internet
Explorer will doubtless catch up with the rest of the field. Something as simple as a
scale
command, Canvas’s version of the viewport in a way, could allow you to quickly
port your iPhone graphics to those other browsers.
For now, however, Canvas is the last major tool in your iPhone web app toolkit. With
graphics, text, and a handful of iPhone
UI fundamentals in your back pocket, you
should now be able to create whatever great-looking iPhone web apps you imagine.
That doesn’t mean that we’re entirely done looking at web apps, however. We’ve
finished talking about the great libraries available to you, but there are also some
interesting programs available for creating iPhone web pages. The first one we’re
going to cover is Dashcode, which can offer an interesting (if orthogonal) way to cre-
ate web apps.
Lessons for SDK developers
When you start using the SDK, you’re going to have access to a few different drawing
libraries. One of them, Quartz, will look a lot like Canvas. Quartz is similarly built
around paths, and you’ll similarly have to decide whether to stroke or fill paths when
you’re done with them. You’ll also see a lot of other terminology in common, because
Apple created both libraries.
There are differences, in part because Quartz is built around Objective-C’s unique meth-
ods of object-orientation. There are also just enough practical differences to sometimes
get you into trouble, such as the fact that the Quartz coordinate system starts at the
bottom left, not the top left (though this is partially corrected for on the iPhone).
But there’s enough in common that if you learn Canvas, you’ll have a big leg-up on
Quartz, and vice versa.