Tài liệu Oracle CRM On Demand Dashboards- P9 doc
Bạn đang xem bản rút gọn của tài liệu. Xem và tải ngay bản đầy đủ của tài liệu tại đây (278.61 KB, 20 trang )
Oracle-Regular / Oracle CRM On Demand Dashboards / Michael D. Lairson / 174 534-3
136
Oracle CRM On Demand Dashboards
Oracle-Regular / Oracle CRM On Demand Dashboards / Michael D. Lairson / 174 534-3
Chapter 6: Displaying Reports on the Dashboard
137
Formatting Columns in the Pages Area
Columns that you add to the Pages area control the content of the page selector
drop-down list. This area uses column values in a very different way than the other
areas, so it stands to reason that the options on the columns here are a little different
too. In the More Options menu of columns in the Pages area you will find some of
the same options but the effects are unique.
The Hidden option hides the column values, just like in other areas, but since
the column values in the Pages area are displayed in a drop-down list, the
application of the effect is rather counterproductive. Since the combination of
column values determines the content of the page selector, hiding one of the
columns causes repeating values in the drop-down list. I have never needed to
do this.
If you are creating a separate drop-down list for each column, hiding a column
results in an error, as you must display at least one value per drop-down list.
When you add multiple columns to the Pages area, it is the combination of these
columns that determines what the pivot table page contains. Each unique
combination of column values from each column results in a separate page. The
column headings are initially displayed on a single line separated by a hyphen, and
the values on the single drop-down list are also hyphenated.
To create a new drop-down list for each column, click the More Options button
on the column and select the Start New Page Dropdown option. A new drop-down
list for the column appears on the next line in the Pages area of the pivot table.
As with the other areas, you will find the New Calculated Item option on your
More Options menu for the columns in the Pages area. The New Calculated Item
gives us the same flexibility here as in the other area, only the values appear in the
drop-down lists. You can use calculated items in the Pages area to filter out pages or
group data into single pages. The process for creating a new calculated item here is
the same as in other areas of the pivot table.
Just as we are able to add column totals to create a summary section in the
Sections area, you can also create summary page options in the page selector
drop-down list. All columns in the Pages area have a Totals (Σ) button except for the
last column. Click this button to open the Total menu. Initially, the None option is
checked. To add a summary page, select the Before, After, At The Beginning, or At The
End option. The Before option creates a page value in the list before each column
value. The After option gives you the additional page value after each column value
in the drop-down list. The At The Beginning and At The End options will group all of
your total pages before or after all of the values in the drop-down list.
The default label for the new value is the column value followed by “Total.” You
can change this if you like by clicking the Σ button and selecting Format Labels. A
typical Edit Format window opens with the Folder field at the top of the window.
Enter a new label into this field. Like before, if you want to retain the value name in
the heading, you can use the “@” wildcard to represent the value name.
Please purchase PDF Split-Merge on www.verypdf.com to remove this watermark.
Oracle-Regular / Oracle CRM On Demand Dashboards / Michael D. Lairson / 174 534-3
138
Oracle CRM On Demand Dashboards
Oracle-Regular / Oracle CRM On Demand Dashboards / Michael D. Lairson / 174 534-3
Chapter 6: Displaying Reports on the Dashboard
139
Since the label for the new page actually appears in the drop-down list, any
format changes you make beyond the name are ignored. You can format the values
in the summary pages by clicking the Σ button and selecting Format Values. Again, a
typical Edit Format window opens where you can format the font, cell, and border
for the measure values in the section. When you display a summary page in the
report, the data is formatted according to the settings here.
Pivot Charts
On the Edit View screen for the Pivot Chart view, you will find a Chart Pivoted
Results check box and a Chart Position field in the header bar. Click this check box,
and a chart based on your pivot chart data is inserted into the Pivot Chart view at
the location selected in the Chart Position field. Most of the basic charts are
available as a pivot chart, but there are some differences in how you format the
charts. Bubble charts and scatter charts are not available as pivot charts.
Pivot charts are based on the rows, columns, and measures in your pivot table. To
insert a chart, click the Chart Pivoted Results check box. The default position is to the
right of the pivot table, but you can choose to place the pivot chart on the left, top, or
bottom. You can also hide the pivot table and display only the charted pivot data.
One thing you will notice about pivot charts is that you do not select the
columns you want to display and assign the axis on which column data displays.
The control for this is in the layout of your pivot table. The locations of the row
data, column data, and measures differ by chart.
Select the graph, type, and style for your pivot chart, just like you would for a
Chart view. Most of the chart controls for pivot charts are also the same as the
controls available in the Chart view.
The first button in the toolbar is the General Chart Properties button. Click this
button to add a title to your pivot chart, specify how labels will appear, change the
data format, and specify the size for the chart. The only tangible difference between
the pivot chart and a normal Chart view here has to do with the sizing of the chart.
There are no slider bars for adjusting size. You have to do that here for the pivot chart.
The next button is the Axis Titles And Labels button. This button opens the Axis
Titles & Labels screen, which contains two or three tabs, depending on the chart
type. The Left tab (and Right tab for a line bar combo) allows you to configure the
title and label formats of the vertical axis. The Bottom tab also has a Title section and
Labels section for modifying the title and scale labels of the bottom axis.
Clicking the Axis Scaling button opens the Axis Scaling window. Your Axis
Scaling window will have one or two tabs, depending on the type of chart. A line
bar combo, for instance, has a scale on the left vertical axis and on the right vertical
axis. Both the Left and the Right tabs on the Axis Scaling window contain the same
fields, but may have different settings within those fields.
Here you can adjust the range of your axis scale and the number of major and
minor tick marks. You can also add scale markers to your pivot charts.
Please purchase PDF Split-Merge on www.verypdf.com to remove this watermark.
Oracle-Regular / Oracle CRM On Demand Dashboards / Michael D. Lairson / 174 534-3
138
Oracle CRM On Demand Dashboards
Oracle-Regular / Oracle CRM On Demand Dashboards / Michael D. Lairson / 174 534-3
Chapter 6: Displaying Reports on the Dashboard
139
To the right of the Axis Scaling button is the Additional Charting Options button.
This opens the Additional Charting Options window. This window contains the
Gridlines tab, Legend tab, Interaction tab, and Borders & Colors tab.
On the Gridlines tab you can change the color of the major and minor grid
lines. Clicking the Override Defaults check box enables the check boxes on the tab
that allow you to disable major and minor vertical and horizontal grid lines. On the
Legend tab you configure if and where your chart legend appears. The Interaction
tab allows you to select the type of interaction that will occur when a user clicks on
part of the chart. The Borders & Colors tab allows you to set a color for your chart’s
background, text, and border.
The Format Chart Data button opens the Format Chart Data window where you
can format the appearance of your chart data elements. On a pivot chart, the Format
Chart Data window contains two tabs. The Positional tab you are familiar with from
the normal Chart view. On the Positional tab you can specify the color and style for
each series and each chart component.
The Conditional tab gives you a formatting option that you do not have with the
normal Chart view. On the Conditional tab, you will find each of the columns in
your pivot chart listed on the left side of the tab.
Click the Add Condition button. A submenu appears that contains the list of
columns in the pivot chart. Select the column to which you would like to add a
conditional color format. A typical Create/Edit Filter window opens. Designate the
operator and values for the condition and click OK. A new condition is added to the
tab for the selected column. Click the Color box for the condition and select a color
from the palate. Now, whenever the condition is met, the chart element representing
that column will change to the specified color.
You can continue to add conditions to the column, change their order using the
arrow buttons, delete them using the X button, and modify the condition by clicking
the Filter button.
With the line bar combo and pie charts, you are able to make additional special
formatting changes by clicking the Advanced Properties button. On the line bar
combo, the Chart Type Special window contains a single check box that allows you
to synchronize the line and bar axis scales. For the pie chart, you are able to format
the data values as a percentage of the total or the actual value represented by each
wedge. You can also define what information is included in the data label. You can
display the value only, the name only, or both name and value.
Please purchase PDF Split-Merge on www.verypdf.com to remove this watermark.
This page intentionally left blank
Please purchase PDF Split-Merge on www.verypdf.com to remove this watermark.
/ Oracle CRM On Demand Dashboards / Michael D. Lairson / 174 534-3 / Blind folio:
Chapter
7
Dashboard
Filter Prompts
Please purchase PDF Split-Merge on www.verypdf.com to remove this watermark.
/ Oracle CRM On Demand Dashboards / Michael D. Lairson / 174 534-3
Oracle CRM On Demand Dashboards
/ Oracle CRM On Demand Dashboards / Michael D. Lairson / 174 534-3
Chapter 7: Dashboard Filter Prompts
here are many ways to filter a report in Oracle CRM On Demand.
Most reports, in fact, employ at least one, and often more than one,
type of filter. Regardless of the type of filter, they all have three things
in common. Every filter must have a column, condition, and value.
The column identifies the specific table and column from the database
that you are using to filter the report. The condition describes how the filter is
applied to the values in the column, such as “is equal to” or “is greater than.”
Finally, the value portion of the filter tells the report filter what to look for in the
data. Putting it all together, we end up with a complete filter, such as “revenue is
greater than 1000000.”
In this chapter, we will look at the dashboard filter prompt, which allows you to
pass filter conditions and values to a filter on one or more reports included in a
dashboard.
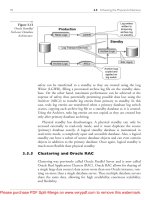
A dashboard prompt filters the results of the embedded reports to show only the
results that match the criteria present in the prompt. A dashboard prompt can filter
every report embedded in a dashboard or only the reports on the same page as the
prompt. When present on a dashboard page, the prompt is generally placed at the
top of the page, as shown in Figure 7-1. This makes the most sense, since we
generally read from the top of the page to the bottom.
When developing your dashboard prompt, you will select columns from the
subject area for the prompt and specify how they should appear on the prompt and
how users will enter or select values for the filter. Just like any filter, each prompt
must have a column, condition, and value. For each column you want to filter using
the dashboard prompt, you must have the same columns represented in each report
on the dashboard. The columns do not need to be visible in the report as long as
they are included in the report filter with the condition set to Is Prompted. Columns
in the prompt that are not included in a report will not be filtered and will have no
effect on the report.
T
Dashboard with filter prompt
Please purchase PDF Split-Merge on www.verypdf.com to remove this watermark.
/ Oracle CRM On Demand Dashboards / Michael D. Lairson / 174 534-3
Oracle CRM On Demand Dashboards
/ Oracle CRM On Demand Dashboards / Michael D. Lairson / 174 534-3
Chapter 7: Dashboard Filter Prompts
You will use the Answers On Demand application to build your dashboard filter
prompts, and you start in exactly the same way when beginning to build a report.
Open the Reports tab in Oracle CRM On Demand, and click the Design Analysis
link. This brings you to the Getting Started screen in Answers On Demand, just as
described in the previous chapter.
Dashboard filter prompts are built on a subject area just like a report; typically,
your dashboard prompt will use the same subject area as reports located on the
same dashboard, but this is not a requirement. To begin building your dashboard
prompt, select any subject area on the Getting Started screen. When I say that you
can choose any subject area, I mean it really does not matter which subject area you
choose here to begin with because you will be selecting the actual subject area for
your dashboard prompt in a moment. Essentially, we just need to get ourselves to
the Build And View Analysis screen in order to click the New Dashboard Prompt
button. The New Dashboard Prompt button is the rightmost button located above
the Active Subject Area heading on the left side of the Build And View Analysis
screen, as shown in Figure 7-2.
When you click the New Dashboard Filter button, Answers On Demand will ask
if you want to save the current analysis before you continue. Generally, I have
nothing to save at this point, as I only opened the Build And View Analysis screen to
get to the New Dashboard Filter button. Clicking Cancel on the dialog box results in
a pop-up list of all of the subject areas, with the Reporting subject areas at the top of
the list and the Analytics subject areas at the bottom. Selecting the subject area you
want to use for your dashboard prompt takes you to the Dashboard Prompt screen
shown in Figure 7-3.
On this screen, you add columns to your dashboard prompt by clicking columns
in the Columns list, just like you would for a report. Your dashboard filter prompt
must have at least one column from the subject area and can contain as many
columns as you like. Of course, you will want to consider how many columns you
really need in the prompt. Adding too many columns will affect the performance of
New Dashboard Filter button
Please purchase PDF Split-Merge on www.verypdf.com to remove this watermark.
/ Oracle CRM On Demand Dashboards / Michael D. Lairson / 174 534-3
Oracle CRM On Demand Dashboards
/ Oracle CRM On Demand Dashboards / Michael D. Lairson / 174 534-3
Chapter 7: Dashboard Filter Prompts
the dashboard prompt, since columns that show values in a drop-down list must
query the Oracle CRM On Demand server to populate the list. Oracle recommends
that you limit your dashboard prompts to nine or fewer columns for this reason.
As you click columns in the Columns list, they appear in the Prompts section of
the Dashboard Prompt screen. You will notice that the columns appear differently
than they do when you add them to a report. The columns are added to the screen
arranged in a vertical list, with each column identified in a row containing nine
fields. You can adjust the grouping, column formula, operator, control, shown
values, value defaults, variable, label, and order for each column in your dashboard
prompt.
At the top of the screen you will find a single field in the Dashboard Prompt section.
The Scope field controls how the filter is applied on dashboards with multiple
pages. If you select Dashboard in this field, the dashboard prompt affects every page
of the dashboard but does not need to appear on every dashboard page.
If you set the dashboard prompt’s scope to Page, the dashboard prompt affects
only the dashboard pages to which you have added the dashboard prompt.
If you have a multiple-page dashboard with different dashboard prompts
appearing on each page, be sure you set the scope of the dashboard prompts
appropriately, as a prompt with a scope of Dashboard will override any values set
on dashboard prompts with a scope of Page.
All of your dashboard prompt columns will be displayed on your prompt in a single
row by default, as shown in Figure 7-4. The columns are listed vertically on the
Dashboard Prompt screen
Please purchase PDF Split-Merge on www.verypdf.com to remove this watermark.
/ Oracle CRM On Demand Dashboards / Michael D. Lairson / 174 534-3
Oracle CRM On Demand Dashboards
/ Oracle CRM On Demand Dashboards / Michael D. Lairson / 174 534-3
Chapter 7: Dashboard Filter Prompts
Dashboard Prompt Edit screen, regardless of how you ultimately arrange the
columns, so you may find it useful to click the Preview Analysis button in the upper-
right corner of the screen as you are building your dashboard filter prompts.
If you want to stack the fields in your dashboard filter prompt, or group filter
fields into more than one row, you can group columns together using the Group
check boxes. To start a new row, select the Group check box to the left of the
column you want to appear in the first position of the new row. Figure 7-5 shows
a dashboard filter prompt with multiple rows of fields.
As you add your columns to the dashboard prompt, you will notice that the column
name appears under the Column heading and there is an Edit Formula button to the
right of the column name. You can modify the formula for the dashboard prompt
column by clicking this button, which opens the Edit Column Formula window.
Every column in Oracle CRM On Demand has a formula. Unedited, this formula
is known as the analytic field reference and contains the table and column name
that is referenced by the column in your reports and dashboard prompts. As an
example, Account.“Account Name” is the formula for the Account Name column
from the Account table. The table is identified before the period, and the column is
identified after the period. In this case, the column name is inside of double
quotation marks because it contains a space.
Ungrouped dashboard filter prompt
Grouped dashboard filter prompt
Please purchase PDF Split-Merge on www.verypdf.com to remove this watermark.
/ Oracle CRM On Demand Dashboards / Michael D. Lairson / 174 534-3
Oracle CRM On Demand Dashboards
/ Oracle CRM On Demand Dashboards / Michael D. Lairson / 174 534-3
Chapter 7: Dashboard Filter Prompts
There is one very important rule regarding column formulas that you must
remember when developing a dashboard filter prompt. The formula in the dashboard
prompt column must exactly match the column formula in the report. The great news
here is that most of the system fields that you will frequently filter on have the exact
same formula from one subject area to the next. That means that a dashboard filter
prompt built on the Activities subject area contains the same Account.“Account
Name” formula in the Account Name column as the Accounts subject area.
You can successfully filter on columns with custom formulas as long as the
custom formula is exactly the same in both the dashboard prompt and the filtered
report. For instance, if you have a CASE statement in your report that groups
accounts into different categories based on revenue tier and account type in your
report, and you want to allow users to select one of these categories in your
dashboard prompt, you just need to copy the formula from the report into a formula
field on the dashboard prompt. Again, they must be exactly the same, so copying
and pasting the formula is your most reliable method.
Because you have set your report filters to the “Is Prompted” operator on your
reports, the report is expecting to receive filter information from some other source:
a dashboard filter prompt. We have identified the column and ensured that the
formulas are exactly the same, so the link between the report column and
dashboard filter column is made. Next, we need to make sure that the filter on the
report receives the operator and value in order to filter the report based on
dashboard prompt selections.
The operator selected here for each column will obviously affect the way the
values are applied to the filters on the reports in the dashboard. Some of the
operators require a bit of explanation on the dashboard prompt itself, since an edit
box next to a field labeled “Revenue” does not give you quite enough information
about the filter. For this reason, the field control will sometimes contain a bit of text
describing the operator where needed. The text that appears is indicated in Table 7-1.
Each column in the dashboard filter prompt has an operator identified under the
Operator heading. The available operators will change based on the data type of the
column. The operators and the field types for which they are available are shown in
Table 7-1 as well.
Most of these operators are straightforward and do not need any additional
clarification, but I would like to mention that the “is LIKE” operator allows for a
wildcard. Your users will be able to use a percentage sign (%) as a wildcard character
when entering a value in the dashboard prompt using the “is LIKE” operator.
Next up in the dashboard filter prompt column configuration is the control. The
control options on the dashboard filter prompt columns allow you to specify the
Please purchase PDF Split-Merge on www.verypdf.com to remove this watermark.
/ Oracle CRM On Demand Dashboards / Michael D. Lairson / 174 534-3
Oracle CRM On Demand Dashboards
/ Oracle CRM On Demand Dashboards / Michael D. Lairson / 174 534-3
Chapter 7: Dashboard Filter Prompts
type of field that will be presented to the users of the dashboard. For each prompt
field in the dashboard, the user will either enter a value into an edit box (text field)
or select value(s) from a drop-down list or multiselect list. Date and Date/Time
columns have an additional option of the Calendar control. The Multiselect control
is only available for those columns where the operator selected is valid for more
than one value. Those operators are “is equal to or is in,” “is not equal to or is not
in,” and “contains.”
As we continue through the configuration options on your dashboard filter columns,
we encounter the show settings. For the vast majority of your dashboard filter
prompts, this setting is rather simple. You have the option of showing all values or
limiting the values based on a SQL query. The SQL option is described later in the
“Advanced Filter Prompts” section. For now, we will continue to focus on the basics.
If your control provides a list of values to the user, you have either one or two
check boxes in the Show section. The (All Choices) check box, when selected,
enables an option in your drop-down list. The (All Choices) option essentially
includes all values in the filter.
When you have multiple columns in your dashboard, you can use the Constrain
check box to limit users’ choices for the subsequent selections. For example,
suppose one column filters on Account Type and the next column filters on City. By
selecting the Constrain check box for City, you limit the City column to only show
Dashboard Filter Prompt Operators
Is equal to or is in All field types
Is not equal to or is not in All field types NOT
Is less than All field types <
Is greater than All field types >
Is less than or equal to All field types <=
Is greater than or equal to All field types >=
Is between All field types Between and
Contains Text fields only
Begins with Text fields only
Ends with Text fields only
Is LIKE (pattern match) Text fields only
Please purchase PDF Split-Merge on www.verypdf.com to remove this watermark.
/ Oracle CRM On Demand Dashboards / Michael D. Lairson / 174 534-3
Oracle CRM On Demand Dashboards
/ Oracle CRM On Demand Dashboards / Michael D. Lairson / 174 534-3
Chapter 7: Dashboard Filter Prompts
those cities where the selected Account Type is present in the data set. Any column
that you constrain is constrained by all of the other columns in the prompt, not
just the previous filter.
The next step in configuring your dashboard filter prompt column is setting the
default value for the prompt field. Most often, you will likely leave this setting at
Report Defaults, which will leave the field blank, ready for the user to enter or select
a filter value.
The other options in the Default To field are All Choices, Specific Value, Variable
Expression, Server Variable, and SQL Results. The Variable Expression, Server
Variable, and SQL Results options are described in detail later in this chapter in the
“Advanced Filter Prompts” section.
The All Choices option in the Default To field is only available if the All Choices
check box is selected in the Show section for the column. Setting the default value
to All Choices preselects the “(All Choices)” value for the column. I should point out
that leaving the dashboard filter prompt field blank is equivalent to selecting all
choices as long as the reports on the dashboard are not filtered on any other value
already. If the report column filter is set to “Is Prompted,” then no values are sent to
the filter and all values are included in the column. If a report is already filtered on a
value in that column, then the All Choices option in the dashboard filter prompt will
overwrite that filter and all values in the column will be included.
If you want to default the dashboard filter prompt field to a specific value, select
Specific Value. This exposes a field below the Default To field into which you will type
in the exact value you want to use as the default. To enter your default value, click the
ellipsis button to the right of the field to open up the text box, then select a value from
the Column Choices list or type in the value exactly as you want it to appear in the
dashboard filter prompt field. When the dashboard runs with a default value in the
field, the reports on the dashboard will be filtered automatically using this default
value. The value can then be changed by the user if desired. Clicking Go on the
dashboard filter prompt will then run the reports again using the user-selected value.
You can use the dashboard filter prompt to generate a presentation variable that can
then be referenced in various areas of the reports on the dashboard. The presentation
variable is essentially a virtual field that will contain whatever value the user enters
or selects in the dashboard filter prompt field. Declaring a presentation filter is quite
simple. Ensure that the operator is set to Is Equal To Or Is In and change the value in
the Set Variable field to Presentation Variable. This opens up a new text entry field for
the presentation variable name. Enter a name for your variable, and you are done
with the dashboard filter prompt portion of setting up a presentation variable.
Please purchase PDF Split-Merge on www.verypdf.com to remove this watermark.
/ Oracle CRM On Demand Dashboards / Michael D. Lairson / 174 534-3
Oracle CRM On Demand Dashboards
/ Oracle CRM On Demand Dashboards / Michael D. Lairson / 174 534-3
Chapter 7: Dashboard Filter Prompts
The value your user enters in the dashboard prompt can then be displayed in
report results in the dashboard, or referenced in filters, by calling the presentation
variable. Referencing a presentation variable in a report filter allows you to filter any
column using the value from the presentation variable. The column formulas in this
instance do not need to match because you are not using the Is Prompted setting on
the filter. To add a filter referencing a presentation variable to your report, open the
Edit Filter window for the column you want to filter. On this window, set your
Operator and then click the Add button. On the Add menu, select Variable and then
Presentation. The Value field is replaced with two fields: the Variable Expr field and
below that a field labeled “(Default).” Enter the name of the presentation variable
declared in the dashboard filter prompt. You can set a default value by entering the
value of your choice in the “(Default)” field. The default value is helpful when the
report is accessed outside of the dashboard, where the presentation variable does
not exist.
When you save the filter, you will notice that your filter shows the presentation
variable in the filter description prefixed by @ and inside of curly brackets as shown
in Figure 7-6. This syntax is exactly the syntax you would use when referencing the
presentation variable in other areas of the report. In the example @{myFavoriteColor}
{Green} the presentation variable name is myFavoriteColor and the default value is
Green. If I want to display the value of this presentation value in my report, I can
reference the presentation variable and display its value by replacing a column
formula with '@{myFavoriteColor}{Green}' which inserts the value of the presentation
variable between single quotes, resulting in the value displaying in the report column.
Similarly, I can reference the presentation variable in an equation. For example,
if I have two presentation variables, one named InterestRate and the other named
DownPayment, I can reference them in a column formula as shown:
("Opportunity Metrics"."Opportunity Revenue" - @{DownPayment}{0}) *
@{InterestRate}{.10}
Presentation variables can be inserted into many other places within your
dashboard reports, including title views, narrative views, static text views,
conditional format conditions, and others.
Filter referencing a presentation variable
Please purchase PDF Split-Merge on www.verypdf.com to remove this watermark.
/ Oracle CRM On Demand Dashboards / Michael D. Lairson / 174 534-3
Oracle CRM On Demand Dashboards
/ Oracle CRM On Demand Dashboards / Michael D. Lairson / 174 534-3
Chapter 7: Dashboard Filter Prompts
The final field on the dashboard filter prompt column configuration is the Label
field. This field allows you to replace the column name with a label of your choice
on the dashboard filter prompt.
To change the order in which the columns appear on the dashboard filter prompt,
click the up and down arrows at the far right of each row. The column at the top
of the list will be the first column in the dashboard filter prompt, positioned at the
top left.
The default format on your dashboard filter prompt includes a light gray background
and thin black border. This results in what looks like a small dialog box sitting on
your dashboard with form fields. That appearance is not necessarily undesirable, but
it is not the appearance you are stuck with. At the very top left of the Dashboard
Prompt Edit screen you will find a Format View button that opens up your typical
Edit Format window, allowing you to modify the field label font, the dashboard filter
prompt background, and the border around the prompt.
Most dashboard filter prompts that you will build are simple, straightforward
collections of column filter prompts that display at the top of your dashboards.
Creating those is uncomplicated and does not require any knowledge of SQL. In this
section, however, I describe some more complex dashboard filter techniques that do
require the use of SQL and a little bit of creative thinking to develop advanced
dashboard filter prompts. We will start by selecting the values that appear in the
dashboard prompt and setting the default value using SQL queries. Next we will
look at referencing presentation variables from other columns in these fields.
Let me begin by stating that this book is not intended to be a book on Structured
Query Language (SQL). Most expressions you write when working with reports in
Oracle CRM On Demand are not SQL statements—or I should say you do not write
them in the form of SQL statements. Everything in the report request (columns,
filters, equations) is compiled and translated into one or more SQL statements that
are sent to the database behind the scenes. There are very few places where we can
get behind the interface enough to craft our own SQL queries against the database,
but the dashboard filter prompt is one such place.
Please purchase PDF Split-Merge on www.verypdf.com to remove this watermark.
/ Oracle CRM On Demand Dashboards / Michael D. Lairson / 174 534-3
Oracle CRM On Demand Dashboards
/ Oracle CRM On Demand Dashboards / Michael D. Lairson / 174 534-3
Chapter 7: Dashboard Filter Prompts
Account Addresses “Account Addresses Analysis”
Account and Competitor History “Account - Competitor Accounts Analysis”
Account and Partner History “Account - Partner Accounts Analysis”
Account and Related Account History “Account - Related Accounts Analysis”
Account Contact History “Account Contacts Analysis”
Account History “Account Analysis”
Account Team History “Account Teams Analysis”
Activity History “Activity Analysis”
Asset History “Asset Analysis”
Call Activity History “Call Activity Analysis”
Campaign History “Campaign Analysis”
Campaign Response History “Campaign Response Analysis”
Contact Addresses “Contact Addresses Analysis”
Contact History “Contact Analysis”
Contact Interests History “Contact Interests Analysis”
Contact Revenue History “Contact Revenue Analysis”
Contact Team History “Contact Teams Analysis”
Deal Registration History “Deal Registration Analysis”
Dealer History “Dealer Analysis”
Household History “Household Analysis”
Lead History “Lead Analysis”
MDF Request History “MDF Request Analysis”
MedEd Event History “MedEd Analysis”
Opportunity and Competitor History “Competitor - Opportunity Analysis”
Analytics Subject Areas Table Names
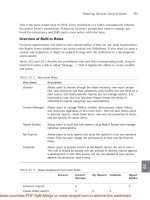
The basic SQL SELECT statement has syntax of SELECT column FROM table.
When we are writing SQL statements in our dashboard filter prompts, the column is
the analytics field reference, and the table references the subject area. Each subject
area has a table name that is different from its display name. These table names are
provided for your reference in Tables 7-2 and 7-3.
Please purchase PDF Split-Merge on www.verypdf.com to remove this watermark.
/ Oracle CRM On Demand Dashboards / Michael D. Lairson / 174 534-3
Oracle CRM On Demand Dashboards
/ Oracle CRM On Demand Dashboards / Michael D. Lairson / 174 534-3
Chapter 7: Dashboard Filter Prompts
Opportunity and Partner History “Partner - Opportunity Analysis”
Opportunity History “Opportunity Analysis”
Opportunity Product Revenue History “Opportunity - Product Analysis”
Partner History “Partner Analysis”
Pipeline History “Historical Pipeline Analysis”
Portfolio History “Portfolio Analysis”
Product History “Product Analysis”
Sales Stage History “Sales Stage History”
Service Request History “Service Request Analysis”
Analytics Subject Areas Table Names (continued )
Reporting Subject Areas Table Names
Accounts “Account Lists”
Accounts and Competitors “Account - Competitor Accounts Lists”
Accounts and Partners “Account - Partner Accounts Lists”
Accounts and Related Accounts “Account - Related Accounts Lists”
Activities “Activity Lists (RT05)”
Advanced Custom Objects “Advanced Custom Objects Lists”
Assets “Asset Lists”
Campaigns “Campaign Lists”
Contact Relationships “Contact Relationships Lists”
Contacts “Contact Lists”
Custom Object 1 and Accounts “Custom Object 1 and Account Lists”
Custom Object 1 and Contacts “Custom Object 1 and Contact Lists”
Custom Object 1 and Opportunities “Custom Object 1 and Opportunity Lists”
Custom Object 1 and Service Requests “Custom Object 1 and Service Request Lists”
Custom Object 1s “Custom Object 1 Lists”
Please purchase PDF Split-Merge on www.verypdf.com to remove this watermark.
/ Oracle CRM On Demand Dashboards / Michael D. Lairson / 174 534-3
Oracle CRM On Demand Dashboards
/ Oracle CRM On Demand Dashboards / Michael D. Lairson / 174 534-3
Chapter 7: Dashboard Filter Prompts
Reporting Subject Areas Table Names (continued )
Custom Object 2 and Accounts “Custom Object 2 and Account Lists”
Custom Object 2 and Contacts “Custom Object 2 and Contact Lists”
Custom Object 2 and Opportunities “Custom Object 2 and Opportunity Lists”
Custom Object 2 and Service Requests “Custom Object 2 and Service Request Lists”
Custom Object 2s “Custom Object 2 Lists”
Custom Object 3 and Accounts “Custom Object 3 and Account Lists”
Custom Object 3 and Contacts “Custom Object 3 and Contact Lists”
Custom Object 3 and Opportunities “Custom Object 3 and Opportunity Lists”
Custom Object 3 and Service Requests “Custom Object 3 and Service Request Lists”
Custom Object 3s “Custom Object 3 Lists”
Forecasts “Forecast Lists”
Households “Household Lists”
Leads “Lead Lists”
Opportunities “Opportunity Lists”
Opportunities and Competitors “Competitor - Opportunity Lists”
Opportunities and Partners “Partner - Opportunity Lists”
Opportunity Product Revenues “Opty - Product Lists (RT05)”
Partners “Partner Lists”
Personalized Content Delivery “PCD Lists”
Service Requests “Service Request Lists”
Shared Activities “Shared Activity Lists”
To provide a list of values in your dashboard filter prompt based on a SQL query,
select the SQL Results option in the Show field for your column. When you select
this option, another field opens up that contains the default SQL query. The default
query, as you might suspect, is a simple SELECT query that selects all values for the
column. You can edit or replace this query to get a custom set of values.
Something that might surprise you here is that you can actually reference other
subject areas in your SQL query! This is in complete contrast to the rule that holds
true in every other place throughout Answers On Demand. So what does this mean
to you, the dashboard developer?
Please purchase PDF Split-Merge on www.verypdf.com to remove this watermark.
/ Oracle CRM On Demand Dashboards / Michael D. Lairson / 174 534-3
Oracle CRM On Demand Dashboards
/ Oracle CRM On Demand Dashboards / Michael D. Lairson / 174 534-3
Chapter 7: Dashboard Filter Prompts
Suppose you are building a dashboard filter prompt based on the Accounts
subject area. You want to provide a filter prompt so the user can select a particular
account name, but you have hundreds of accounts and really only want to show
those accounts in the selector that have more than $1 million in opportunity
revenue. One simple solution is to filter the Account Name column in the prompt to
only show these special accounts, but the accounts’ opportunity revenue data is not
in the Accounts subject area. To overcome this challenge, change the Show option
on Account Name to SQL Results and enter the following SQL query:
SELECT Account."Account Name" FROM "Opportunity Lists" WHERE
"Opportunity Metrics"."Opportunity Revenue" > 1000000
If you want to apply a sort order, simply add the ORDER BY keyword to the
query:
SELECT Account."Account Name" FROM "Opportunity Lists" WHERE
"Opportunity Metrics"."Opportunity Revenue" > 1000000 ORDER BY
Account."Account Name" ASC
Remember that we are working in the Accounts subject area. What this SQL
query is actually doing is pulling the Account Name values from the Opportunities
subject area. Account.“Account Name” is in both subject areas. Opportunity
Lists is the table name for the Opportunities subject area, and “Opportunity
Metrics”.“Opportunity Revenue” is a column from the Opportunities subject area
that is not available in the Accounts subject area where we are building our
dashboard filter prompt.
Of course, it is not required to cross the subject area boundary with your SQL
query in the Show field. Following this simple syntax example, you can filter your
dashboard filter prompt fields any way you need so long as the data is available in
the database.
The Default field on the dashboard filter prompt also allows for some advanced
configuration. Using variables or SQL, you can set the default value in the
dashboard filter prompt. Variables allow you to default field values based on session
variables, server variables, and even presentation variables from other prompts. With
SQL, you can select a default value based on a SQL query statement.
The Variable Expression option allows you to default the field value to the result of
one of several built-in variables or a presentation variable from a previous
dashboard filter prompt. If you find yourself needing to reference the content of
another presentation variable, this is possible by declaring a presentation variable in
Please purchase PDF Split-Merge on www.verypdf.com to remove this watermark.
/ Oracle CRM On Demand Dashboards / Michael D. Lairson / 174 534-3
Oracle CRM On Demand Dashboards
/ Oracle CRM On Demand Dashboards / Michael D. Lairson / 174 534-3
Chapter 7: Dashboard Filter Prompts
one dashboard filter prompt, and then setting the default to Variable Expression in
another dashboard filter prompt and entering the presentation variable as the default
value in @{variable} format.
I have not discovered a very good reason for doing this, especially since it
requires that your dashboard contain two dashboard filter prompts, which feels a bit
awkward to me.
You may find some of the other built-in variable expressions quite useful,
however. Table 7-4 describes some of the variables that I have discovered. They are
shown in the format that they should be entered into the Default field along with a
sample result.
The Server Variable option allows you to default the field value to the result of one
of several built-in session variables. Several of these are duplicates of the variables
described earlier. Table 7-5 describes the available variables that I believe you will
find useful. This list may not be inclusive of every available variable, as Oracle may
release additional variables from time to time. They are shown in the format that
they should be entered into the Default field along with a sample result.
To provide a default value in your dashboard filter prompt based on a SQL query,
select the SQL Results option in the Default To field for your column. When you
Variable Expressions
@{system.currentTime} 3/31/2010 12:02:36 AM
@{system.productVersion} 10.1.3.3.3 (Build 091023.1345)
@{session.locale} en-us
@{session.language} en
@{session.loginTime} 3/30/2010 10:12:43 PM
@{session.lastAccessTime} 3/31/2010 12:02:36 AM
@{session.currentUser.id} INTELENEX#MLAIRSON
@{user.homeDirectory} /users/intelenex#mlairson
@{user.id} INTELENEX#MLAIRSON
@{user.displayName} Lairson, Michael
Please purchase PDF Split-Merge on www.verypdf.com to remove this watermark.
/ Oracle CRM On Demand Dashboards / Michael D. Lairson / 174 534-3
Oracle CRM On Demand Dashboards
/ Oracle CRM On Demand Dashboards / Michael D. Lairson / 174 534-3
Chapter 7: Dashboard Filter Prompts
NQ_SESSION.USER INTELENEX#MLAIRSON
NQ_SESSION.REPLUSER INTELENEX/MLAIRSON
NQ_SESSION.CURRENT_DT 3/30/2011 12:00:00 AM
NQ_SESSION.CURRENT_YEAR 2011
NQ_SESSION.CURRENT_QTR 1
NQ_SESSION.CURRENT_MONTH 3
NQ_SESSION.LAST_QTR 4
NQ_SESSION.NEXT_QTR 2
NQ_SESSION.LAST_YEAR 2010
NQ_SESSION.NEXT_YEAR 2012
NQ_SESSION.YEAR_MINUS_TWO 2009
NQ_SESSION.QTR_BEFORE_LAST 3
NQ_SESSION.LAST_QTR_YEAR 2010
NQ_SESSION.QTR_BEFORE_LAST_YEAR 2009
NQ_SESSION.YEAR_MINUS_THREE 2008
NQ_SESSION.YEAR_PLUS_TWO 2013
NQ_SESSION.NEXT_QTR_YEAR 2011
NQ_SESSION.DISPLAYNAME Lairson, Michael
NQ_SESSION.USER_ALIAS Michael Lairson
NQ_SESSION.USER_FISCAL_CALENDAR 01
NQ_SESSION.USER_COMPANY_CURCY USD
NQ_SESSION.COMPANY_LANG ENU
NQ_SESSION.COMPANY_TMPLT_
COUNTRY
USA
NQ_SESSION.COMPANY_TIMEZONE (GMT-05:00) Eastern Time (US & Canada)
NQ_SESSION.USER-DEFAULT_CURCY USD
NQ_SESSION.USER_LANG ENU
NQ_SESSION.LAST_REFRESH_DT TIMESTAMP '2010-03-29 21:38:40'
LAST_WEEK_BEGIN_DT TIMESTAMP '2010-03-21 00:00:00'
Server Variables
Please purchase PDF Split-Merge on www.verypdf.com to remove this watermark.