Tài liệu RELIABILITY IN MECHANICAL DESIGN pptx
Bạn đang xem bản rút gọn của tài liệu. Xem và tải ngay bản đầy đủ của tài liệu tại đây (1.05 MB, 20 trang )
20.1 INTRODUCTION
The
history
of the
application
of
probability concepts
to
electric power systems goes back
to the
1930s.
1
"
6
However,
the
beginning
of the
reliability
field is
generally regarded
as
World
War II,
when
Germans applied basic reliability concept
to
improve reliability
of
their
Vl
and V2
rockets.
During
the
period
from
1945-1950
the
U.S. Army, Navy,
and Air
Force
conducted various studies
that revealed
a
definite
need
to
improve equipment reliability.
As a
result
of
this
effort,
the
Department
of
Defense,
in
1950, established
an ad hoc
committee
on
reliability.
In
1952, this committee
was
transformed
to a
group called
the
Advisory Group
on the
Reliability
of
Electronic Equipment
(AGREE).
In
1957, this group's report, known
as the
AGREE Report,
was
published,
and it
subse-
quently
led to a
specification
on the
reliability
of
military electronic equipment.
The first
issue
of a
journal
on
reliability appeared
in
1952, published
by the
Institute
of
Electrical
and
Electronic Engineers (IEEE).
The first
symposium
on
reliability
and
quality control
was
held
in
1954. Since those days,
the field of
reliability
has
developed into many specialized areas: mechanical
reliability,
software
reliability, power system reliability,
and so on.
Most
of the
published literature
on
the field is
listed
in
Refs.
7, 8.
The
history
of
mechanical reliability
in
particular goes back
to
1951,
when
W.
Weibull
9
developed
a
statistical distribution,
now
known
as the
Weibull distribution,
for
material strength
and
life
length.
The
work
of A. M.
Freudenthal
10
'
11
in the
1950s
is
also regarded
as an
important milestone
in the
history
of
mechanical reliability.
The
efforts
of the
National Aeronautics
and
Space Administration (NASA)
in the
early 1960s
also played
a
pivotal role
in the
development
of the
mechanical reliability
field,
12
due
primarily
to
two
factors:
the
loss
of
Syncom
I in
space
in
1963,
due to a
bursting high-pressure
gas
tank,
and the
loss
of
Mariner
III in
1964,
due to
mechanical failure. Many projects concerning mechanical
relia-
Mechanical
Engineers' Handbook,
2nd
ed., Edited
by
Myer
Kutz.
ISBN
0-471-13007-9
©
1998 John Wiley
&
Sons, Inc.
CHAPTER
20
RELIABILITY
IN
MECHANICAL DESIGN
B.
S.
Dhillon
Department
of
Mechanical
Engineering
University
of
Ottawa
Ottawa, Ontario,
Canada
20.1 INTRODUCTION
487
20.2
BASICRELIABILITY
NETWORKS
488
20.2.1 Series Network
488
20.2.2
Parallel
Network
488
20.2.3
k-out-of-n
Unit Network
489
20.2.4
Standby System
490
20.3
MECHANICALFAILURE
MODES
AND
CAUSES
491
20.4 RELIABILITY-BASED DESIGN
491
20.5
DESIGN-RELIABILITYTOOLS
492
20.5.1
Failure Modes
and
Effects
Analysis
(FMEA)
492
20.5.2
Fault Tree
494
20.5.3
Failure Rate Modeling
and
Parts Count Method
496
20.5.4
Stress-Strength Interference
Theory Approach
497
20.5.5
Network Reduction Method
498
20.5.6
Markov Modeling
498
20.5.7
Safety
Factors
500
20.6
DESIGNLIFE-CYCLE
COSTING
501
20.7
RISKASSESSMENT
501
20.7.1
Risk-Analysis
Process
and Its
Application
Benefits
502
20.7.2
Risk Analysis Techniques
502
20.8
FAILUREDATA
504
bility
were initiated
and
completed
by
NASA.
A
comprehensive list
of
publications
on
mechanical
reliability
is
given
in
Ref.
13.
20.2 BASIC RELIABILITY NETWORKS
A
system component
may
form various different configurations:
series,
parallel,
fc-out-of-n,
standby,
and
so on. In the
published reliability literature, these configurations
are
known
as the
standard
configurations.
During
the
mechanical design
process,
it
might
be
desirable
to
evaluate
the
reliability
or the
values
of
other related parameters
of
systems forming such configurations. These networks
are
described
in the
following pages.
20.2.1 Series Network
The
block diagram
of an "n"
unit series network
is
shown
in
Fig. 20.1. Each block represents
a
system
unit
or
component.
If any one of the
components fails,
the
system fails; thus,
all of the
series
units
must work successfully
for the
system
to
succeed.
For
independent units,
the
reliability
of the
network shown
in
Fig.
20.1
is
R
s
=
R
1
R
2
R
3
R
n
(20.1)
where
R
s
= the
series system reliability
n = the
number
of
units
Ri
= the
reliability
of
unit
i;
for i =
1,
2, 3, • • • , n
For
units' constant failure rates,
Eq.
(20.1)
becomes
14
R,(t)
=
e~^
.
e~^
.
e~^
- -
-
e~^
(20.2)
_
g-jS
A,/
where
R
s
(t)
=
the
series system reliability
at
time
t
A
1
= the
unit
i
constant failure rate,
for
/
=
1,
2, 3, • • • , n
The
system hazard rate
or the
total failure rate
is
given
by
14
**>-<jr3M*
where
A
5
(O
= the
series system total failure rate
or the
hazard rate
Note
that
the
series
system failure rate
is the sum of the
unit failure rates.
In
mechanical
or in
other
design
analysis, when
the
failure rates
are
added,
it is
automatically assumed that
the
units
are
acting
in
series. This
is the
worst-case design
assumption—if
any one
unit fails,
the
system fails.
In
engi-
neering
design specifications,
the
adding
up of all
system component failure rates
is
often
specified.
The
system mean time
to
failure
is
expressed
by
13
MTTF
3
=
lim
R
s
(s)
=
-^-
(20.4)
E
A,
1=1
where
MTTF
5
= the
series system mean time
to
failure
s
(in
brackets)
= the
Laplace transform variable
R
s
(s)
= the
Laplace transform
of the
series system reliability
20.2.2 Parallel Network
The
block diagram
of an "n"
unit parallel network
is
shown
in
Fig. 20.2.
As in the
case
of the
series
network,
each block represents
a
system unit
or
component.
All of the
system units
are
assumed
to
Fig.
20.1
Block diagram representing
a
series system.
Fig.
20.2
Parallel
network
block
diagram.
be
active
and at
least
one
unit must function normally
for the
system
to
succeed, meaning that this
type
of
configuration
may be
used
to
improve
a
mechanical system's reliability during
the
design
phase.
For
independent units,
the
reliability
of the
parallel network shown
in
Fig. 20.2
is
given
by
13
R
p
=l-(l-
R
1
)(I
-
R
2
)
-
-
• (1 -
R
n
)
(20.5)
where
R
p
= the
parallel network reliability
For
constant failure rates
of the
units,
Eq.
(20.5) becomes
R
p
(t)
= 1 - (1 -
<T
A
")(1
-
e~^}
•••(!-
<T
A
«0
(20.6)
where
R
p
(i)
= the
parallel network reliability
at
time
t
Obviously, Eqs. (20.5)
and
(20.6) indicate that system reliability increases with
the
increasing values
of
n.
For
identical units,
the
system mean time
to
failure
is
given
by
14
MTTF^
-
lim
R
p
(s)
= 7 S T
(20.7)
5-0
A
/=i
i
where
MTTF
p
= the
parallel network mean time
to
failure
R
p
(s)
= the
Laplace transform
of the
parallel network reliability
A
= the
constant failure rate
of a
unit
20.2.3
fr-out-of-n
Unit
Network
This arrangement
is
basically
a
parallel network with
a
condition that
at
least
k
units
out of the
total
of
n
units must
function
normally
for the
system
to
succeed. This network
is
sometimes referred
to
as
partially redundant network.
An
example might
be a
Jumbo 747.
If a
condition
is
imposed that
at
least three
out of
four
of its
engines must operate normally
for the
aircraft
to fly
successfully, then
this
system becomes
a
special case
of the
k-out-of-n
unit network. Thus,
in
this case,
k = 3 and
n
= 4.
For
independent
and
identical units,
the
k-out-of-n
unit network reliability
is
14
R**
= 2
m
#(i
-
Rr-
1
(20.8)
i=*
w
where
M
=
_o!_
\ij
i!(/i-i)!
R
= the
unit reliability
R
Un
= the
k-out-of-n
unit network reliability
Note that
at k — 1, the
k-out-of-n
unit network reduces
to a
parallel network
and at k =
n,
it
becomes
a
series system.
For
constant unit failure rates,
Eq.
(20.8)
is
rewritten
to the
following
form:
13
RvM
=
S
(
n
}
e~
ixt
(1 -
e-*T-'
(20.9)
«•=*
Vv
where
R^M
= is the
k-out-of-n
unit network reliability
at
time
t
The
system mean time
to
failure
is
given
by
13
MTTF^
=
Hm
R^(S)
= 7
Z
T
(20.10)
5-»o
A
i=k
I
where
MTTF^
n
= the
mean time
to
failure
of the
k-out-of-n
unit network
Rk/
n
(
s
)
=
me
Laplace transform
of the
k-out-of-n
unit network reliability.
20.2.4
Standby
System
The
block diagram
of an
(n
+ 1)
unit standby system
is
shown
in
Fig. 20.3.
Each block represents
a
unit
or a
component
of the
system.
In the
standby system case,
as
shown
in
Fig. 20.3,
one
unit
operates
and n
units
are
kept
on
standby.
During
the
mechanical design process, this type
of
redundancy
is
sometimes adopted
to
improve
system reliability.
If
we
assume independent
and
identical units, perfect switching,
and
standby units
as
good
as
new,
then
the
standby system reliability
is
given
by
14
*
(ct
V /
RM
=
E
1
A(f)<fry
e-&*o*/n
(20.11)
^o
|>
J /
where
R
ss
(t)
= the
standby system reliability
at
time
t
n = the
number
of
standbys
A(O
= the
unit hazard rate
or
time-dependent failure rate
For two
non-identical units
(i.e.,
one
operating,
the
other
on
standby),
the
system reliability
is
expressed
by
15
RJt)
= RM +
\*
fodiWJit
-
t,)
Jt
1
(20.12)
Jo
where
R
0
(t)
= the
operating unit reliability
at
time
t
R
5
M
= the
standby unit reliability
at
time
t
/
0
(*i)
=
me
operating unit failure density
function
For
known reliability
of the
switching mechanism,
Eq.
(20.12)
is
modified
to
R
u
(t)
= RM +
R^
P/
0
('i)*»(f
-
*i)
^i
(20.13)
Jo
where
R
sw
= the
reliability
of the
switching mechanism
Fig.
20.3
An (n + 1)
unit
standby
system
block
diagram.
For
identical units
and
constant unit failure rates,
Eq.
(20.13)
simplifies
to
R
ss
(t)
=
e~
xt
(l
+
R
sw
Xt)
(20.14)
where
A = the
unit constant failure rate
20.3 MECHANICAL FAILURE MODES
AND
CAUSES
There
are
certain failure modes
and
causes associated with mechanical products.
The
proper identi-
fication
of
relevant failure modes
and
their causes during
the
design
process
would certainly help
to
improve
the
reliability
of
design under consideration.
Mechanical
and
structural parts
function
adequately within
specific
useful
lives. Beyond those
lives, they cannot
be
used
for
effective
mission,
safe
mission,
and so on. A
mechanical failure
may
be
defined
as any
change
in the
shape, size,
or
material properties
of a
structure, piece
of
equipment,
or
equipment part that renders
it
unfit
to
perform
its
specified mission
satisfactorily.
13
One of the
factors
for the
failure
of a
mechanical part
is the
specified magnitude
and
type
of
load.
The
basic
types
of
loads
are
dynamic, cyclic,
and
static. There
are
many types
of
failures that result
from
different
types
of
loads: tearing, spalling, buckling, abrading, wear, crushing,
fracture,
and
creep.
16
In
fact,
there
are
many
different
modes
of
mechanical
failures.
17
•
Brinelling
•
Thermal shock
•
Ductile rupture
•
Fatigue
•
Creep
•
Corrosion
•
Fretting
•
Stress rupture
•
Brittle
fracture
•
Radiation damage
•
Galling
and
seizure
•
Thermal relaxation
•
Temperature-induced elastic deformation
•
Force-induced elastic deformation
•
Impact
Field experience
has
shown that there
are
various causes
of
mechanical failures,
including
18
de-
fective
design, wear-out, manufacturing defects, incorrect installation, gradual deterioration
in
per-
formance,
and
failure
of
other parts.
Some
of the
important failure modes
and
their associated characteristics
are
presented
below.
19
•
Creep.
This
may be
described
as the
steady
flow of
metal under
a
sustained load.
The
cause
of
a
failure
is the
continuing creep deformation
in
situations when either
a
rupture occurs
or
a
limiting acceptable level
of
distortion
is
exceeded.
•
Corrosion. This
may be
described
as the
degradation
of
metal surfaces under service
or
storage
conditions because
of
direct chemical
or
electrochemical reaction with
its
environment. Usu-
ally,
stress accelerates
the
corrosion damage.
In
hydrogen embrittlement,
the
metal ductility
increases
due to
hydrogen absorption, leading either
to
fracture
or to
brittle failure under
impact loads
at
high-strain rates
or
under static loads
at
low-strain rates, respectively.
•
Static failure. Many
of the
materials
fail
by
fracture
due to the
application
of
static loads
beyond
the
ultimate strength.
•
Wear.
This occurs
in
contacts such
as
sliding, rolling,
or
impact,
due to
gradual destruction
of
a
metal surface through contact with another metal
or
non-metal surface.
•
Fatigue
failure.
In the
presence
of
cyclic loads, materials
can
fail
by
fracture even when
the
maximum cyclic stress magnitude
is
well below
the
yield strength.
20.4 RELIABILITY-BASED DESIGN
It
would
be
unwise
to
expect
a
system
to
perform
to a
desired
level
of
reliability unless
it is
specif-
ically designed
for
that reliability.
The
specification
of
desired
system/equipment/part
reliability
in
the
design specification
due to
factors such
as
well-publicized failures (e.g.,
the
space shuttle
Chal-
lenger
disaster
and the
Chernobyl nuclear accident)
has
increased
the
importance
of
reliability-based
design.
The
starting point
for the
reliability-based design
is
during
the
writing
of the
design
specification.
In
this phase,
all
reliability needs
and
specifications
are
entrenched into
the
design
specification.
Examples
of
these requirements might include item mean time
to
failure
(MTBF), mean
time
to
repair (MTTR), test
or
demonstration procedures
to be
used,
and
applicable document.
The
U.S. Department
of
Defense, over
the
years,
has
developed various reliability documents
for
use
during
the
design
and
development
of an
engineering item. Many times, such documents
are
entrenched into
the
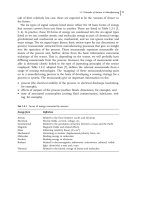
item design specification document. Table
20.1
presents some
of
these documents.
Many
professional bodies
and
other organizations have also developed documents
on
various aspects
of
reliability.
7
'
8
'
14
"
16
References
15 and 20
provide descriptions
of
documents developed
by the
U.S.
Department
of
Defense.
Reliability
is an
important consideration during
the
design phase. According
to
Ref.
21, as
many
as
60% of
failures
can be
eliminated through design changes. There
are
many strategies
the
designer
could
follow
to
improve design:
1.
Eliminate failure modes.
2.
Focus design
for
fault
tolerance.
3.
Focus design
for
fail
safe.
4.
Focus design
to
include mechanism
for
early warnings
of
failure
through
fault
diagnosis.
During
the
design phase
of a
product, various types
of
reliability
and
maintainability analyses
can
be
performed, including reliability evaluation
and
modeling, reliability allocation, maintainability
evaluation,
human
factors/reliability
evaluation, reliability testing, reliability growth modeling,
and
life-cycle
costing.
In
addition, some
of the
design improvement strategies
are
zero-failure design,
fault-tolerant
design, built-in testing, derating, design
for
damage detection, modular design, design
for
fault
isolation,
and
maintenance-free design. During design reviews, reliability
and
maintainabil-
ity-related actions
recommended/taken
are to be
thoroughly reviewed
from
desirable aspects.
20.5 DESIGN-RELIABILITY TOOLS
There
are
many reliability analysis techniques
and
methods available
to
design professionals during
the
design phase. These include
failure
modes
and
effects
analysis (FMEA), stress-strength modeling,
fault
tree analysis, network reduction, Markov modeling,
and
safety
factors.
All of
these techniques
are
applicable
in
evaluating mechanical designs.
20.5.1
Failure Modes
and
Effects Analysis (FMEA)
FMEA
is a
vital tool
for
evaluating system design
from
the
point
of
view
of
reliability.
It was
developed
in the
early 1950s
to
evaluate
the
design
of
various
flight
control
systems.
22
The
difference
between
the
FMEA
and
failure modes,
effects,
and
criticality analysis (FMECA)
is
that FMEA
is a
qualitative technique used
to
evaluate
a
design, whereas FMECA
is
composed
of
Table
20.1
Selected Reliability Documents Developed
by the
U.S.
Department
of
Defense
20
No.
Document
No.
Document Title
1
M1L-HDBK-217
Reliability prediction
of
electronic equipment
2
M1L-STD-781 Reliability design
qualification
and
production-
acceptance
tests:
exponential distribution
3
MlL-HDBK-472
Maintainability prediction
4
RADC-TR-83-72 Evolution
and
practical application
of
failure
modes
and
effects
analysis (FMEA)
5
NPRD-2 Nonelectronic parts reliability data
6
RADC-TR-75-22 Nonelectronic reliability notebook
7
MIL-STD-1629
Procedures
for
performing
a
failure
mode,
effect,
and
criticality analysis (FMECA)
8
M1L-STD-1635 (EC) Reliability growth testing
9
M1L-STD-721
Definition
of
terms
for
reliability
and
maintainability
10
M1L-STD-785 Reliability program
for
systems
and
equipment
development
and
production
11
M1L-STD-965 Parts control program
12
M1L-STD-756 Reliability modeling
and
prediction
13
M1L-STD-2084
General requirements
for
maintainability
14
M1L-STD-882 System
safety
program requirements
15
M1L-STD-2155
Failure-reporting analysis
and
corrective action system
FMEA
and
criticality analysis (CA). Criticality analysis
is a
quantitative method used
to
rank critical
failure
mode
effects
by
talcing
into consideration their occurrence probabilities.
As
FMEA
is a
widely used method
in
industry, there
are
many
standards/documents
written
on
it. In
fact,
Ref.
23
collected
and
evaluated
45 of
such publications prepared
by
organizations such
as
the
U.S. Department
of
Defense (DOD), National Aeronautics
and
Space Administration (NASA),
Institute
of
Electrical
and
Electronic Engineers (IEEE),
and so on.
These documents
include:
24
•
DOD: M1L-STD-785A (1969), M1L-STD-1629
(draft)
(1980), M1L-STD-2070(AS) (1977),
M1L-STD-1543 (1974),
AMCP-706-196
(1976)
•
ATASA:
NHB
5300.4
(IA)
(1970), ARAC Proj. 79-7 (1976)
•
IEEE:
ANSI
N
41.4 (1976)
Details
of the
above documents
as
well
as a
list
of
publications
on
FMEA
are
given
in
Ref.
24.
There
can be
many reasons
for
conducting FMEA,
including:
25
• To
identify
design weaknesses
• To
help
in
choosing design alternatives during
the
initial design stages
• To
help
in
recommending design changes
• To
help
in
understanding
all
conceivable failure modes
and
their associated
effects
• To
help
in
establishing corrective action priorities
• To
help
in
recommending test programs
In
performing FMEA,
the
analyst seeks answers
to
various questions
for
each component
of the
concerned system, such
as, How can the
component
fail
and
what
are the
possible failure modes?
What
are all the
possible
effects
associated with each failure mode?
How can the
failure
be
detected?
What
is the
criticality
of the
failure
effects?
Are
there
any
safeguards against
the
possible failure?
Procedure
for
Performing FMEA
This procedure
is
composed
of
four
steps:
1.
Establishing analysis scope
2.
Collecting data
3.
Preparing
the
component list
4.
Preparing FMEA sheets
Establishing
Analysis
Scope.
This
is
concerned with establishing system boundaries
and the
extent
of the
analysis.
The
analysis
may
encompass information
on
various areas concerning each
potential component failure: failure
frequency,
underlying causes
of the
failure,
safeguards, possible
failure
effects,
detection
of
failure,
and
failure
effect
criticality. Furthermore,
the
extent
of
FMEA
depends
on the
timing
of
performance
of
FMEA;
for
example, conceptual design stage
and
detailed
design stage.
In
this case,
the
extent
of
FMEA
may be
broader
for the
detailed design analysis stage
than
for the
conceptual design stage.
In any
case,
the
extent
of the
analysis should
be
decided
on
the
merits
of
each case.
Collecting
Data. Because performing FMEA requires various kinds
of
data, professionals con-
ducting
FMEA should have access
to
documents concerning specifications, operating procedures,
system
configurations,
and so on. In
addition,
the
FMEA team,
as
applicable, should collect desired
information
by
interviewing design professionals,
operation/maintenance
engineers, component sup-
pliers,
and
external experts
for
collecting desirable information.
Preparing
the
Component List.
The
preparation
of the
component list
is
absolutely necessary
prior
to
embarking
on
performing FMEA.
In the
past,
it has
proven
useful
to
include operating
conditions, environmental conditions,
and
functions
in the
component list.
Preparing
FMEA
Sheet. FMEA
is
conducted using FMEA sheets. These sheets include areas
on
which information
is
desirable, such
as
part,
function,
failure mode, cause
of
failure, failure
effect,
failure
detection,
safety
feature,
frequency
of
failure,
effect
criticality,
and
remarks.
•
Part
is
concerned with
the
identification
and
description
of the
part/component
in
question.
•
Function
is
concerned with describing
the
function
of the
part
in
various
different
operational
modes.
•
Failure
mode
is
concerned with
the
determination
of all
possible failure
modes
associated
with
a
part, e.g., open, short, close, premature,
and
degraded.
•
Cause
of
failure
is
concerned with
the
identification
of all
possible causes
of a
failure.
•
Failure
effect
is
concerned with
the
identification
of all
possible failure
effects.
•
Failure
detection
is
concerned with
the
identification
of all
possible ways
and
means
of de-
tecting
a
failure.
•
Safety
feature
is
concerned with
the
identification
of
built-in
safety
provisions associated with
a
failure.
•
Frequency
of
failure
is
concerned with determination
of
failure occurrence frequency.
•
Effect
criticality
is
concerned with ranking
the
failure according
to its
criticality,
e.g., critical
(i.e.,
potentially hazardous), major (i.e.,
reliability
and
availability will
be
affected
significantly
but
it is not a
safety
hazard), minor (i.e., reliability
and
availability will
be
affected
somewhat
but
it is not a
safety
hazard),
insignificant
(i.e., little
effect
on
reliability
and
availability
and
it
will
not be a
safety
hazard).
•
Remarks
is
concerned with listing
any
remark concerning
the
failure
in
question,
as
well
as
possible recommendations.
One of the
major
advantages
of
FMEA
is
that
it
helps
to
identify
system weaknesses
at the
early
design
stage. Thus, remedial measures
may be
taken immediately during
the
design phase.
The
major
drawback
of
FMEA
is
that
it is a
"single
failure
analysis."
In
other words, FMEA
is
not
well suited
for
determining
the
combined
effects
of
multiple failures.
20.5.2
Fault Tree
This method,
so
called because
it
arranges
fault
events
in a
tree-shaped diagram,
is one of the
most
widely
used techniques
for
performing system reliability analysis.
In
particular,
it is
probably
the
most widely used method
in the
nuclear power industry.
The
technique
is
well suited
for
determining
the
combined
effects
of
multiple failures.
The
fault
tree technique
is
more costly
to use
than
the
FMEA approach.
It was
developed
in the
early 1960s
in
Bell Telephone Laboratories
to
evaluate
the
reliability
of the
Minuteman Launch
Control System. Since that time, hundreds
of
publications
on the
method have appeared. References
26-27
describe
it in
detail.
The
fault
tree analysis begins
by
identifying
an
undesirable event, called
the
"top
event,"
asso-
ciated with
a
system.
The
fault
events that could cause
the
occurrence
of the top
event
are
generated
and
connected
by
logic gates known
as
AM),
OR,
and so on. The
construction
of a
fault
tree proceeds
by
generation
of
fault
events
(by
asking
the
question "How could this event
occur?")
in a
successive
manner
until
the
fault
events need
not be
developed
further.
These events
are
known
as
primary
or
elementary
events.
In
simple terms,
the
fault
tree
may be
described
as the
logic
structure relating
the
top
event
to the
primary events.
Fig. 20.4 presents
four
basic symbols associated with
the
fault
tree method.
•
Circle
is
used
to
represent
a
basic
fault
event, i.e.,
the
failure
of an
elementary component.
The
component failure parameters, such
as
probability, failure,
and
repair rates,
are
obtained
from
field
data
or
other sources.
•
Rectangle
is
used
to
represent
an
event resulting
from
the
combination
of
fault
events through
the
input
of a
logic gate.
Fig.
20.4
Basic fault tree symbols
(a)
basic fault event,
(b)
resultant event,
(c)
AND
gate,
(d)
OR
gate.
• AND
gate
is
used
to
denote
a
situation that
an
output event occurs
if all the
input
fault
events
occur.
• OR
gate
is
used
to
denote
a
situation that
an
output event occurs
if any one or
more
of the
input
fault
events occur.
The
construction
of
fault
trees using
the
symbols shown
in
Fig. 20.4
is
demonstrated through
the
following
example.
Example 20.1
Construct
a
fault
tree
of a
simple system concerning
hot
water supply
to the
kitchen
of a
house.
Assume that
the hot
water faucet only
fails
to
open
and the top
event
is
kitchen without
hot
water.
In
addition,
gas is
used
to
heat water.
A
simplified
fault
tree
of a
kitchen without
hot
water
is
shown
in
Fig. 20.5. This
fault
tree indicates
that
if any one of the
E
1
,
for
i
= 1, 2, 3, 4, 5,
fault
event (i.e.,
fault
events denoted
by
circles) occurs,
there will
be no hot
water
in
kitchen.
The
probability
of
occurrence
of the top
event
Z
0
(i.e.,
no hot
water
in
kitchen)
can be
estimated,
if
the
occurrence probabilities
of the
fault
events
E
1
,
E
2
,
E
3
,
E
4
,
and
E
5
are
known, using
the
formula
given below.
The
probability
of
occurrence
of the OR
gate output
fault
event,
say x, is
given
by
P
01
Jx)
=
1 -
fl
I 1 -
P(Ei)I
(20.15)
Fig.
20.5
Fault tree
for
kitchen
without
hot
water.
where
n = the
number
of
independent input
fault
events
P(E
1
)
= the
probability
of
occurrence
of the
input
fault
event
E
1
,
for i =
1,
2, 3, 4, and 5
Similarly,
the
probability
of
occurrence
of the AND
gate output
fault
event,
say
y,
is
given
by
/Wy)
= ft
P(E
1
)
(20.16)
J=I
Example
20.2
Assume
that
the
probability
of
occurrence
of
fault
events
E
1
,
E
2
,
E
3
,
E
4
,
and
E
5
shown
in
Fig. 20.5
are
0.01, 0.02, 0.03, 0.04,
and
0.05, respectively. Calculate
the
probability
of
occurrence
of top
event
Z
0
.
Substituting
the
specified data into
Eq.
(20.15),
we get the
probabilities
of
occurrence
of
events
Z
2
,
Z
1
,
Z
0
,
respectively
P(Z
2
)
=
P(E
4
)
+
P(E
5
)
-
P(E
4
)
P(E
5
)
=
(0.04)
+
(0.05)
-
(0.04)
(0.05)
=
0.088
P(Z
1
)
=
P(Z
2
)
+
P(E
3
)
-
P(Z
2
)
•
P(E
3
)
=
(0.088)
+
(0.03)
-
(0.088) (0.03)
-
0.11536
P(Z
0
)
= 1 - [1 -
P(E
1
)]
[1 -
P(EJ]
[1 -
P(Z
1
)]
-
1 - (1 -
0.01)
(1
-
0.02)
(1
-
0.11536)
-
0.14172
Thus,
the
probability
of
occurrence
of the top
event
Z
0
,
that
is, no hot
water
in
kitchen,
is
0.14172.
20.5.3
Failure
Rate Modeling
and
Parts
Count Method
During
the
design phase
to
predict
the
failure rate
of a
large number
of
electronic parts,
the
equation
of
the
following
form
is
used:
28
A
=
AJJ
2
• • •
(failures/10
6
hr)
(20.17)
where
A = the
part failure rate
f
l
= the
factor that takes into consideration
the
part quality level
/
2
= the
factor
that takes into consideration
the
influence
of
environment
on the
part
A
6
= the
part base failure rate related
to
temperature
and
electrical stresses
On
similar lines, Ref.
29 has
proposed
to
estimate
the
failure rates
of
various mechanical parts,
devices,
and so on. For
example,
to
estimate
the
failure rate
of
pumps,
the
following equation
is
proposed:
\
p
=
A
1
+
A
2
+
A
3
+
A
4
+
A
5
,
failures/10
6
cycles (20.18)
where
\
p
= the
pump failure rate
A
1
= the
pump
shaft
failure rate
A
2
= the
pump seal failure rate
A
3
= the
pump bearing
failure
rate
A
4
= the
pump
fluid
driver failure rate
A
5
= the
pump casing failure rate
In
turn,
the
pump
shaft
failure rate
is
obtained using
the
following relationship:
A,
= V
I!
O,
(20.19)
z=l
where
\
psb
= the
pump
shaft
base failure rate
d
f
= the
ith
modifying
factor;
i = 1
(casing thrust load),
i = 2
(shaft
surface
finish),
/
= 3
(Contamination),
i = 4
(material temperature),
/
= 5 (
pump displacement),
i = 6
(material endurance limit)
The
values
of the
above factors
are
tabulated under
the
varying conditions
in
Ref.
29.
Reference
29
also provides similar formulas
for
obtaining failure rates
of
pump bearings, seals,
fluid
driver,
and
casing.
The
parts count method
is
used
to
estimate
system/equipment
failure rate during early design
stages
as
well
as
during
bid
proposal.
The
following expression
is
used
to
estimate
system/equipment
failure
rate:
A,
=
S
N
t
(X
c
Q
c
\
failures/10
6
hour (20.20)
1=1
where
A
5
= the
system/equipment
failure rate
N
1
= the
number
of
ith
generic component
A
c
= the
ith
generic component failure rate expressed
in
failures/10
6
hour
Q
0
= the
quality
factor
associated with
ith
generic component
n = the
number
of
different
generic component categories
The
values
of
A
c
and
Q
0
are
given
in
Ref.
28. It is to be
noted that
Eq.
(20.20)
is
based
on the
assumption that
the
operational environment
of the
entire
equipment/system
is the
same.
20.5.4 Stress-Strength Interference Theory Approach
This
is a
useful
approach
to
determine reliability
of a
mechanical item when
its
associated stress
and
strength probability density functions
are
known.
In
this case,
the
item reliability
may be
defined
as
the
probability that
the
failure-governing stress will
not
exceed
the
failure-governing strength. Thus,
mathematically,
the
item reliability
is
expressed
by
R(x
< y) =
P(y
>
x}
(20.21)
where
x - the
stress variable
y
= the
strength variable
P
=
the
probability
R
=
item reliability
Equation (20.21)
is
rewritten
in the
following
form:
13
'
26
R(x
<y)
=
J
^
/Cv)
M^
/(*)
dx\
dy
(20.22)
where f(x)
= the
probability density
function
of the
stress
/(y)
= the
probability density
function
of the
strength
Several alternative forms
of Eq.
(20.22)
are
given
in
Ref.
13.
In
order
to
demonstrate
the
appli-
cability
of Eq.
(20.22),
we
assume that
the
item stress
and
strength
are
defined
by the
following
probability density
functions:
13
/W =
CH?-«
x > O
(20.23)
/(v)
=
\=
exp
I
~
(^)
1
-oo
<
y
<
oo
(20.24)
(T
V
2
TT
L
2
V
0-
XJ
where
a = the
reciprocal
of the
mean stress
IJL
- the
mean strength
a = the
strength standard deviation
Substituting Eqs. (20.23)
and
(20.24) into
Eq.
(20.22)
yields
13
'
30
R=
r
i
expf-ifayur^-^L
J-VfIr
P
I
2 V
o-
/
J
L
J
-»
J
(20.25)
=
1
-exp
^-|
(2
K
«
-
o-
2
"
2
)J
Reliability expressions
for
various other combinations
of
stress
and
strength probability density
functions
are
given
in
Ref.
13.
This reference also provides
a
graphical approach based
on
Mellin
transforms
to
estimate mechanical item reliability.
20.5.5 Network Reduction Method
This
is
probably
the
simplest
and the
most
straightforward
approach
to
determine
the
reliability
of
systems
composed
of
configurations such
as
series, parallel,
and so on. The
approach
is
concerned
with
sequentially reducing
the
series
and
parallel configurations
to
equivalent hypothetical compo-
nents
until
the
whole system becomes
a
single hypothetical component
or
unit.
The
approach
is
demonstrated
through
the
following example.
Example 20.3
Evaluate
the
reliability
of
Fig. 20.6 block diagram given each unit's reliability between zero
and
one.
Using
Eq.
(20.1),
the
reliability
of
Fig. 20.6 subsystem
A is
RA
=
R
i^2
R
3
=
(0.9) (0.8) (0.85)
-
0.612
The
above result allows
us to
reduce subsystem
A to
a
single hypothetical
component/unit
with
reliability
R
A
=
0.612,
as
shown
in
Fig. 20.7.
Using
Eq.
(20.5),
the
reliability
of
Fig. 20.7 subsystem
B is
given
by
R
B
= 1 - (1 -
R
4
)
(1 -
R
A
}
=
1 -
(0.3) (0.388)
-
0.8836
Using
the
above result,
we
have reduced
the
Fig. 20.7 subsystem
B to a
single hypothetical
component/unit
with reliability
R
B
=
0.8836,
as
shown
in
Fig. 20.8.
With
the aid of Eq.
(20.1),
the
Fig. 20.8 reliability
is
R
s
=
R
B^
5
=
(0.8836) (0.95)
-
0.8394
Thus,
the
Fig. 20.8 network
is
reduced
to a
single hypothetical unit with reliability
R
s
=
0.8394.
20.5.6 Markov Modeling
This method
is
probably used more widely than
any
other reliability prediction method.
It is
extremely
useful
in
performing reliability
and
availability analysis
of
systems with dependent failure
and
repair
Fig.
20.6
Block diagram
of
a
system.
Fig.
20.7
Reduced
Fig.
20.6 network.
modes
as
well
as
constant failure
and
repair rates. However,
the
method breaks down
for a
system
with
non-constant failure
and
repair rates.
The
following assumptions
are
made
to
formulate Markov
state
equations:
31
• All
occurrences
are
independent
of
each
other.
• The
probability
of
more than
one
transition occurrence
from
one
state
to the
next state
in
finite
time interval,
Ar, is
negligible.
• The
probability
of
occurrence
from
one
state
to
another
in the finite
time interval
Ar is
given
by
«Ar,
where
the a is the
constant transition rate
from
one
state
to
another.
This method
is
demonstrated through
the
following example.
Example
20.4
Develop state probability expressions
for a
two-state system whose
state-space
diagram
is
shown
in
Fig. 20.9.
The
Markov equations associated with Fig. 20.9
are as
follows:
P
0
(t + A r) =
P
0
(O
(1 -
A
5
Ar)
+
P
1
(O
/A
5
Ar
(20.26)
P
1
(r + A O =
P
1
(O
(1 -
M
5
Ar)
+
P
0
(O
A
5
Ar
(20.27)
where
P
0
(r)
=
the
probability that
the
system
is in
state
O at
time
r
P
1
(O
= the
probability that
the
system
is in
state
1 at
time
r
A
5
Ar
= the
transition probability that
the
system
has
failed
in
time
Ar
/x
s
Ar
= the
transition probability that
the
system
is
repaired
in
time
Ar
(1
-
A
5
Ar)
=
the
probability
of no
failure
transition
from
state
O to
state
1 in
time
Ar
(1
-
/A
5
Ar)
= the
probability
of no
repair transition
from
state
1 to
state
O in
time
Ar
Rearranging
Eqs. (20.26)
and
(20.27),
we get the
following
differential
equations:
Fig.
20.8
Reduced
Fig.
20.7
network.
Fig.
20.9
Transition diagram
for a
two-state system.
^jP
-
-P
0
(OA
5
+
P
1
V)U,
(20.28)
^P
=
-P
1
(OM,
+
^
0
(OA
5
(20.29)
At
time
t =
O,
P
0
(O)
-
1 and
P
1
(O)
-
O
Solving
Eqs.
(20.28)
and
(20.29) using Laplace transforms,
we get
P
»W
=
2
A
+
^
.
(20
'
30)
s
2
+
(A
5
4-
IUi
5
)
s
P
1
(S)
=
2
^
*
.
.
(20.31)
S
2
+ (A +
JLt)
5
The
inverse Laplace transforms
of
Eqs.
(20.30)
and
(20.31)
are as
follows:
P
0
(O
=
-^-
+
^
s
C-^
+
"*
(20.32)
A
5
+
IJL
S
X
s
+
IJL
S
P
1
(O
-
— —
e-^+"*
(20.33)
\
s
+
IJL
S
X
s
+
JU
5
For the
given values
of
X
s
and
/i
s
,
we can
obtain
the
availability
and
unavailability
of the
system
at
any
time
t
using
Eqs.
(20.32)
and
(20.33),
respectively.
20.5.7
Safety Factors
Safety
factors
are
often
used
to
design reliable mechanical systems, equipment,
and
devices.
The
factor
used
to
determine
the
safeness
of a
member
is
known
as the
factor
of
safety. This approach
can
provide satisfactory design
in
situations where
the
safety
factors
are
established
from
the
previous
experience. Otherwise, design solely based
on
such factors could
be
misleading. There
are
various
definitions
used
to
define
a
safety
factor.
13
Two
examples
of
such definitions
are
presented below.
Definition
I
According
to
Refs.
31 and 32, the
safety factor
is
expressed
as
follows:
S
f
=
^-
(20.34)
^w
where
S
f
= the
safety
factor
S
u
= the
ultimate strength expressed
in
pounds
per
square inch
(psi)
S
w
=
the
working stress expressed
in psi
Definition
II
The
safety
factor
is
defined
by
33
S
f
=
=
(20.35)
»3
where
S
f
= the
safety
factor
S
m
= the
mean strength
S
= the
mean stress
20.6
DESIGN
LIFE-CYCLE
COSTING
The
life-cycle costing concept plays
an
important role during
the
design phase
of an
engineering
product,
as
design decisions
may
directly
or
indirectly relate
to the
product cost.
For
example,
the
design simplification
may
reduce
the
operational cost
of the
product.
One
important application
of
the
life-cycle costing concept during
the
design phase
is in
making decisions concerning alternative
designs.
The
term
life-cycle
costing
was first
coined
in
1965.
34
Life-cycle cost (LCC)
is
defined
as the
sum
of all
costs incurred during
the
life
time
of an
item; that
is, the sum of
procurement
and
ownership costs. This concept
is
applicable
not
only
to
engineering products,
but
also
to
buildings,
other civil engineering structures,
and so on.
Most
of the
published literature
on LCC is
listed
in
Ref.
35.
Over
the
years, many
different
mathematical models have been developed
to
estimate product
life-cycle
cost. Some
of
these models
are
presented below.
Life-Cycle
Cost
Model
I
The
life-cycle cost
of a
product
is
expressed
by
35
LCC = RK
+
NRK
(20.36)
where
RK = the
recurring cost, composed
of
such elements
as
maintenance cost, labour cost, oper-
ating
cost, inventory cost,
and
support cost
NRK
= the
non-recurring cost, with elements such
as
training
cost,
research
and
development
cost, procurement cost, reliability
and
maintainability improvement cost, support cost,
qualification
approval cost, installation cost, transportation cost, test equipment cost,
and
the
cost
of
life-cycle cost management
Life-Cycle
Cost Model
II
The
life-cycle cost
is
composed
of
three components:
LCC = PK + ILK + RK
(20.37)
where
PK = the
procurement cost representing
the
total
of the
unit prices
ILK
= the
initial logistic cost, made
up of the
one-time costs, such
as
acquisition
of new
support
equipment,
not
accounted
for in the
life-cycle costing
of
solicitation
and
train-
ing,
and
existing support equipment modifications
and
initial technical data-management
cost
RK = the
recurring cost, composed
of
elements such
as
maintenance cost, operating cost,
and
management cost.
Life-Cycle
Cost Model
III
This model
is
specifically concerned with estimating life-cycle cost
of
switching power
supplies,
36
which
is
expressed
by
LCC
=
IK+
FK
(20.38)
where
IK = the
initial cost
and FK the
failure cost, expressed
by
FK
=
X(EL)
(RK + SK)
(20.39)
where
A = the
switching power supply failure rate
EL
= the
expected
life
of the
switching power supply
RK
= the
repair
cost
SK
= the
cost
of the
spares
20.7
RISKASSESSMENT
Risk
is
present
in all
human activity.
It can be
health
and
safety-related
or it can be
economic (e.g.,
loss
of
equipment
and
production
due to
accidents involving
fires,
explosions,
etc.).
Risk
may be
described
as a
measure
of the
probability
and
security
of a
negative
effect
to
health, equipment/
property,
or the
environment.
37
Two
important terms related
to risk are
described separately below.
Risk
assessment
is the
process
of risk
analysis
and risk
evaluation. Risk analysis uses available
data
to
determine
risk to
humans, environment,
or
equipment/property
from
hazards.
It is
usually
composed
of
three steps: scope
definition,
hazard identification,
and
risk determination. Risk evalu-
ation
is the
stage
at
which values
and
judgments enter
the
decision process.
Risk
management
is the
total process
of
risk assessment
and
risk control.
In
turn, risk control
is
the
decision-making process concerned with managing risk,
and the
implementations, enforcement,
and
reevaluation
of its
effectiveness
from
time
to
time, using risk assessment
final
results
or
conclu-
sions
as one of the
inputs.
20.7.1
Risk-Analysis Process
and Its
Application Benefits
The
risk-analysis
process
is
made
up of six
steps:
1.
Scope
definition
2.
Hazard identification
3.
Risk estimation
4.
Documentation
5.
Verification
6.
Analysis update
In
establishing overall plan
of risk
analysis involves describing problems
and
formulating
the
objective,
defining
the
system under study, highlighting assumptions
and
constraints associated with
the
analysis,
identifying
the
decisions
to be
made,
and
documenting
the risk-analysis
plan.
Hazard
identification
involves
identifying
the
hazards that generate
risk in the
system. Risk esti-
mation
is
accomplished
in the
following steps:
•
Hazard source investigation
•
Performance
of
pathway analysis
to
trace
the
hazard
from
its
source
to its
potential receptors
•
Selection
of
methods/models
to
estimate
the risk
•
Evaluation
of
data needs
•
Outlining
the
rationales
and
assumptions associated with methods, models,
and
data
•
Estimation
of
risk
for
determining
the
impact
on the
concerned receptor
•
Risk-estimation documentation
Documentation involves
the
documentation
of the risk-analysis
plan, preliminary evaluation,
and
risk
estimation,
in
order
to
verify
the
integrity
and
correctiveness
of the
analysis process.
It
includes
reviewing scope appropriateness,
critical
assumptions, appropriateness
of
methods, models
and
data
used, analysis performed,
and
analysis insensitiveness.
Analysis update
calls
for
revision
of the
analysis
as new
information becomes available.
Some
of the
advantages
of risk-analysis
applications
are
potential hazards
and
failure modes
identification,
better understanding
of the
system,
risk
comparisons
to
similar
system/equipment/
devices, better decisions regarding safety-improvement expenditures,
and
quantitative
risk
statements.
20.7.2
Risk-Analysis Techniques
There
are
various methods used
to
perform
risk
analysis.
37
~
40
However,
the
relevance
and
suitability
of
these methods prior
to
their applications must
be
carefully
considered. Factors
to be
considered
include
a
given method's appropriateness
to the
system,
its
scientific
defensibility, whether
it
generates
results
in a
form
that enhances understanding
of the risk
occurrence,
and how
simple
it is to
use.
After
the
objectives
and
scope
of the risk
analysis have been
defined,
the
methods should
be
selected, based
on
such factors
as the
objectives
of the
study,
the
phase
of
development, system
and
hazard
types under
study,
the
level
of risk, the
required levels
of
manpower,
and
resources,
infor-
mation
and
data needs,
and
capability
for
updating analysis.
Methods
for
performing
risk
analysis
of
engineering systems
may be
divided into
two
categories:
•
Hazard
identification.
This requires that
the
system under consideration
be
systematically
reviewed
to
identify
inherent hazards
and
their type.
The
hazard-identification process makes
use
of
experiences gained
from
previous
risk-analysis
studies
and
historical data.
The
methods
under
the
hazard identification category
are
failure modes
and
effects
analysis (FMEA), hazard
and
operability studies (HAZOP),
fault
tree analysis,
and
event
tree
analysis (ETA).
•
Risk estimation. This
is
concerned with
the risk
quantitative analysis.
It
requires estimates
of
the
frequency
and
consequences
of
hazardous events, system failure,
and
human error.
Two
methods
under
the risk-estimation
category
are
frequency
analysis
and
consequence analysis.
All
of the
above-mentioned methods
are
described
below.
Hazard
and
Operability
Study (HAZOP)
This
is a
form
of
FMEA originally developed
for
applications
in
process industries. HAZOP
is a
systematic approach
for
identifying hazards
and
operational problems throughout
a
facility.
It has
three objectives:
to
develop
full
facility description;
to
review systematically each
facility
or
process
element
to
identify
how
deviations
from
the
design intentions
can
happen;
and to
judge whether such
deviations
can
result
in
hazards
or
operating problems.
HAZOP
can be
applied during various stages
of
design
or to
process plants
in
operation.
Its
application during
the
early phase
of
design
can
often
lead
to
safer detailed design. HAZOP involves
the
following steps:
•
Establishing study objectives
and
scope
•
Forming
the
HAZOP team, composed
of
suitable members
from
design
and
operation areas
•
Obtaining necessary drawings, process description,
and
other relevant documentation (e.g.,
process
flow
sheets, equipment specification, layout drawings,
and
operating
and
maintenance
procedures)
•
Performing analysis
of all
major
pieces
of
equipment, system, etc.
•
Documenting consequences concerning deviation
from
the
normal state
and
highlighting those
deviations
considered
hazardous
and
credible
Failure Modes
and
Effects Analysis (FMEA)
This method
is
widely used
in
system reliability
and
safety
analyses,
and is
equally applicable
in
risk-analysis
studies.
The
technique
is
described
above.
Fault
Tree Analysis (FTA)
This technique
is
widely used
in
safety
and
reliability analyses
of
engineering
systems—in
particular,
nuclear power-generation systems.
Its
applications
in risk
analysis
are
equally
effective.
The
approach
is
discussed above.
Event Tree Analysis (ETA)
This
is a
"bottom-up"
technique used
to
identify
the
possible outcomes where
the
occurrence
of an
initiating event
is
known.
ETA is
often
used
to
analyze more complex systems than
the
ones handled
by
FMEA.
37
'
38
'
41
'
42
ETA is
useful
in
analyzing facilities having engineered accident-mitigating factors
to
identify
the
event sequence that follows
the
initiating event
and to
generate given consequences.
Generally,
it is
assumed that each sequence event
is
either
a
success
or a
failure.
Because
of the
inductive nature
of
ETA,
the
fundamental question asked
is,
"What
happens
if
?"
ETA
studies highlight
the
relationship between
the
success
or
failure
of
various mitigating
systems
as
well
as the
hazardous events that follow
the
single initiating event. Some
of the
additional
points
associated with
ETA
follow:
• It is a
good idea
to
identify
events that require
further
investigation using FTA.
• It is
absolutely necessary
to
identify
all
possible initiating events
in
order
to
carry
out a
comprehensive
risk
assessment.
• ETA
application always leaves
the
possibility
of
overlooking some important initiating events.
• It is
difficult
for ETA to
incorporate delayed success
or
recovery events,
as
event trees cover
only
the
success
and
failure states
of a
system.
Consequence Analysis
This
is
concerned with determining
the
impact
of the
undesired event
on
adjacent people, property,
or the
environment. Generally,
for risk
calculations concerning
safety,
it
consists
of
determining
the
probability that people
at
different
distances
and
environments
from
the
event source will
suffer
illness
or
injury.
Some examples
of the
undesired event
are fires,
explosions, release
of
toxic materials,
and
projection
of
debris. More specifically,
the
consequence analysis
or
models
are
required
to
predict
probability
of
casualties. Consequence analysis should also consider
the
following:
Basing analysis
on
selected undesirable events
Corrective measures
to
eradicate consequences
Describing series
of
consequences
from
undesirable events
Conditions
or
situations having
effects
on the
series
of
consequences
Existence
of the
criteria used
for
accomplishing
the
identification
of
consequences
Immediate
and
aftermath
consequences
Table 20.2 Failure Rates
for
Selected
Mechanical
Parts
No.
Part Failure Rate
per
10
6
hr
1
Hair spring
1.0
2
Seal,
O-ring
0.2
3
Bearing, roller
0.139-7.31
4
Mechanical joint
0.2
5
Compressor
0.84-198.0
7 Nut or
bolt 0.02
8
Pipe
0.2
9
Piston
1.0
K)
Gasket
0.5
Frequency Analysis
This
is
concerned
with
estimating
the
occurrence
frequency
of
undesired events
or
accident scenarios
(identified
at the
hazard-identification stage).
Two
commonly used approaches
in
performing fre-
quency analysis
are as
follows:
•
Making
use of the
past
frequency
data concerning
the
events under consideration
to
predict
the
frequency
of
their
future
occurrence
•
Employing methods such
as ETA and FTA to
estimate event-occurrence frequencies
The
approaches
are
complementary. Each
has
strengths where
the
other
has
weaknesses.
All in
all,
whenever
it is
feasible, each approach should
be
employed
to
serve
as a
check
on the
other one.
20.8
FAILUREDATA
Failure data provide invaluable information
to
reliability engineers, design engineers, management,
and
so on
concerning
the
product performance. These data
are the final
proof
of the
success
or
failure
of
the
effort
expended during
the
design
and
manufacture
of a
product used under designed condi-
tions. During
the
design phase
of a
product, past information concerning
its
failures plays
a
critical
role
in
reliability analysis
of
that product. Some
of the
uses
of the
failure data
are
estimating item
failure
rate, performing
effective
design reviews, predicting reliability
and
maintainability
of
redun-
dant systems, conducting
tradeoff
and
life cycle cost studies,
and
performing preventive maintenance
and
replacement studies.
There
are
various ways
and
means
of
collecting failure data.
For
example, during
the
equipment
life
cycle, there
are
eight identifiable data
sources:
43
•
Repair
facility
reports
•
Previous experience
with
similar
or
identical items
•
Warranty claims
•
Tests conducted during
field
demonstration, environmental qualification approval,
and field
installation
•
Customer's failure-reporting systems
•
Factory acceptance testing
•
Developmental testing
of the
item
•
Inspection records generated
by
quality control
and
manufacturing groups
See
Refs.
28,
44-48
for
some sources
of
obtaining failure data
on
mechanical parts. Reference
43
lists over
350
sources
for
obtaining various types
of
failure data. Table 20.2 presents failure rates
for
selected mechanical parts.
REFERENCES
1. W. J.
Lyman, "Fundamental Considerations
in
Preparing
a
Master System
Plan,"
Electrical
World
101,
778-792
(1933).
2. P. E.
Benner, "The
Use of the
Theory
of
Probability
to
Determine Spare Capacity," General
Electric
Review
37,
345-348.
3. S. A.
Smith,
"Service
Reliability Measured
by
Probabilities
of
Outage,"
Electrical
World,
103,
222-225
(1934).
4. S. M.
Dean,
"Considerations
Involved
in
Making System Investments
for
Improved Service
Reliability," Edison Electric
Inst.
Bull
6,
491-496
(1938).
5. S. A.
Smith,
"Probability
Theory
and
Spare Equipment," Edison Electric
Inst.
Bull. (March
1934).
6. S. A.
Smith,
"Spare
Capacity Fixed
by
Probabilities
of
Outage," Electrical
World
103,
222-225
(1934).
7. B. S.
Dhillon, Reliability
and
Quality Control: Bibliography
on
General
and
Specialized
Areas,
Beta, 1992.
8. B. S.
Dhillon, Reliability Engineering Applications: Bibliography
on
Important Application
Ar-
eas,
Beta, 1992.
9. W.
Weibull,
"A
Statistical Distribution Function
of
Wide Applicability," Journal
of
Applied
Mechanics
18,
293-297
(1951).
10. A. M.
Freudenthal
and E. J.
Gumbel,
"Failure
and
Survival
in
Fatigue,"
Journal
of
Applied
Physics
25,
110-120(1954).
11. A. M.
Freudenthal, "Safety
and the
Probability
of
Structural
Failure,"
Trans.
Am.
Society
of
Civil Engineers
121,
1337-1397
(1956).
12. W. M.
Redler, "Mechanical Reliability Research
in the
National Aeronautics
and
Space Admin-
istration,"
in
Proceedings
of
the
Reliability
and
Maintainability
Conference,
1966,
pp.
763-768.
13. B. S.
Dhillon, Mechanical Reliability:
Theory,
Models,
and
Applications, American Institute
of
Aeronautics
and
Astronautics, Washington,
DC,
1988.
14. B. S.
Dhillon, Reliability Engineering
in
Systems Design
and
Operation,
Van
Nostrand Reinhold,
New
York, 1983.
15. W.
Grant-Ireson
and C. F.
Coombs (eds.), Handbook
of
Reliability
Engineering
and
Management,
McGraw-Hill,
New
York, 1988.
16. S. S.
Rao, Reliability-Based Design, McGraw-Hill,
New
York, 1992.
17. J. A.
Coolins, Failure
of
Materials
in
Mechanical Design, Wiley,
New
York, 1981.
18. C.
Lipson, Analysis
and
Prevention
of
Mechanical Failures, Course Notes
No.
8007, University
of
Michigan,
Ann
Arbor, June
1980.
19. N. A.
Tiner, Failure Analysis with
the
Electron Microscope, Fox-Mathis,
Los
Angeles, 1973.
20. J. W.
Wilbur
and N. B.
Fuqua,
A
Primer
for DOD
Reliability, Maintainability
and
Safety Stan-
dards Document
No.
PRIM
1,
1988, Rome
Air
Development Center,
Griffiss
Air
Force Base,
Rome,
NY,
1988.
21. D. G.
Raheja,
Assurance Technologies, McGraw-Hill,
New
York,
1991.
22. J. S.
Countinho,
"Failure
Effect
Analysis,"
Trans.
N.Y. Academy
of
Sciences
26,
564-584
(1964).
23.
Procedures
for
Performing
a
Failure Modes
and
Effects
and
Criticality
Analysis,
MIL-STD-1629,
Department
of
Defense, Washington,
DC,
1980.
24. B. S.
Dhillon,
"Failure
Modes
and
Effects
Analysis—Bibliography,"
Microelectronics
and Re-
liability
32,
719-732
(1992).
25. C.
Sundararajan,
Guide
to
Reliability Engineering,
Van
Nostrand Reinhold,
New
York, 1991.
26. B. S.
Dhillon
and C.
Singh, Engineering Reliability:
New
Techniques
and
Applications, Wiley,
New
York, 1981.
27. B. S.
Dhillon,
"Fault
Tree Analysis,"
in
Mechanical Engineers Handbook,
1st
ed.,
M.
Kutz (ed.),
Wiley,
New
York, 1986,
pp.
354-369.
28.
Reliability Prediction
of
Electronic Equipment,
MIL-HDBK-217,
U.S. Department
of
Defense,
Washington,
DC,
1992. (Available
from
Rome
Air
Development Center,
Griffiss
Air
Force Base,
Rome,
NY,
13441.
This document also includes electromechanical devices.)
29. J. D.
Raze
et
al.,
"Reliability
Models
for
Mechanical Equipment," Proceedings
of the
Annual
Reliability
and
Maintainability Symposium, 1987,
pp.
130-134.
30. D.
Kececioglu
and D. Li,
"Exact
Solutions
for the
Prediction
of the
Reliability
of
Mechanical
Components
and
Structural
Members,"
in
Proceedings
of the
Failure
Prevention
and
Reliability
Conference,
American Society
of
Mechanical Engineers,
New
York, 1985,
pp.
115-122.
31. V. M.
Faires, Design
of
Machine Elements, Macmillan,
New
York, 1955.
32. G. M.
Howell,
"Factors
of
Safety," Machine Design,
76-81,
(July 1956).
33. R. B.
McCalley,
"Nomogram
for
Selection
of
Safety
Factors,"
Design News,
138-141,
(Sept.
1957).
34.
Life
Cycle
Costing
in
Equipment Procurement, Report
No. LMI
Task 4C-5, Logistics Manage-
ment
Institute (LMI), Washington,
DC,
April 1965.
35. B. S.
Dhillon,
Life
Cycle
Costing: Techniques, Models,
and
Applications, Gordon
and
Breach
Science Publishers,
New
York, 1989.
36. D.
Monteith
and B.
Shaw, "Improved
R, M, and LCC for
Switching Power
Supplies,"
in
Pro-
ceedings
of the
Annual Reliability
and
Maintainability
Symposium,
1979,
pp.
262—265.
37.
Risk Analysis Requirements
and
Guidelines,
CAN/CSA-Q634-91,
Canadian Standards Associ-
ation, 1991. (Available
from
the
Canadian Standards Association,
178
Rexdale Boulevard,
Rexdale,
Ont,
Canada,
M9W
1R3.)
38. W. E.
Wesley, "Engineering Risk Analysis,"
in
Technological Risk Assessment,
P. F.
Rice,
L. A.
Sagan,
and C. G.
Whipple,
(eds.),
Martinus
Nijhoff,
The
Hague, 1984,
pp.
49-84.
39. V.
Covello
and M.
Merkhofer,
Risk Assessment
and
Risk Assessment Methods:
The
State
of
the
Art,
NSF
Report, National Science Foundation (NSF), Washington,
DC,
1984.
40. B. S.
Dhillon
and S. N.
Rayapati,
"Chemical
Systems Reliability:
A
Survey,"
IEEE
Trans,
on
Reliability,
37,
199-208
(1988).
41. S. J. Cox and N. R. S.
Tait, Reliability,
Safety
and
Risk Management,
Butterworth-Heinemann,
Oxford,
1991.
42. R.
Ramakumar,
Engineering Reliability: Fundamentals
and
Applications, Prentice-Hall,
Engle-
wood
Cliffs,
New
Jersey, 1993.
43. B. S.
Dhillon
and H. C.
Viswanath, "Bibliography
of
Literature
on
Failure
Data,"
Microelec-
tronics
and
Reliability
30,
723-750
(1990).
44. R. E.
Schafer
et
al.,
RADC Non-Electronic Reliability Notebook, Rept.
RADC-TR-85-194,
Re-
liability Analysis Center, Rome
Air
Development Center (RADC),
Griffiss
Air
Force Base, Rome,
NY,
1985.
45.
IEEE Nuclear Reliability Data Manual, IEEE Std. 500, Wiley,
New
York, 1977.
46. H. P.
Bloch
and F. K.
Geitner, Practical Machinery Management
for
Process Plants: Machinery
Failure
Analysis
and
Troubleshooting, Gulf, Houston, 1983,
pp.
628-630.
47. T.
Anderson
and M.
Misund,
"Pipe
Reliability:
An
Investigation
of
Pipeline Failure Character-
istics
and
Analysis
of
Pipeline Failure Rates
for
Submarine
and
Cross-Country
Pipelines,"
Jour-
nal
of
Petroleum Technology,
709-717
(April
1983).
48. S. O.
Nilsson, "Reliability Data
on
Automotive Components,"
in
Proceedings
of the
Annual
Reliability
and
Maintainability Symposium, 1975,
pp.
276-279.
BIBLIOGRAPHY*
Bompas-Smith,
J.
H.,
Mechanical Survival, McGraw-Hill, London, 1973.
Carter,
A. D.
S.,
Mechanical Reliability,
Macmillan
Education, London, 1986.
Dhillon,
B.
S.,
Robot Reliability
and
Safety,
Springer-Verlag,
New
York, 1991.
Frankel,
E.
G.,
Systems Reliability
and
Risk Analysis, Martinus
Nijhoff,
The
Hague, 1984.
Haugen,
E.
B.,
Probabilistic Mechanical Design, Wiley,
New
York, 1980.
Kapur,
K.
C.,
and L. R.
Lamberson, Reliability
in
Engineering Design, Wiley,
New
York, 1977.
Kivenson,
G.,
Durability
and
Reliability
in
Engineering Design, Hayden,
New
York,
1971.
Little,
A.,
Reliability
of
Shell Buckling Predictions,
MIT
Press, Cambridge,
MA,
1964.
Mechanical
Reliability Concepts, ASME,
New
York, 1965.
Middendorf,
W.
H.,
Design
of
Devices
and
Systems, Marcel
Dekker,
New
York, 1990.
Milestone,
W. D.
(ed.), Reliability, Stress Analysis
and
Failure Prevention Methods
in
Mechanical
Design, ASME,
New
York, 1980.
Shooman,
M.
L.,
Probabilistic Reliability:
An
Engineering Approach,
R. E.
Krieger,
Melbourne,
FL,
1990.
Siddell,
J.
N.,
Probabilistic Engineering Design, Marcel Dekker,
New
York, 1983.
*
Additional publications
on
mechanical design reliability
may be
found
in
Refs.
7 and 13.