Tài liệu America’s Health Starts With Healthy Children: How Do States Compare? pptx
Bạn đang xem bản rút gọn của tài liệu. Xem và tải ngay bản đầy đủ của tài liệu tại đây (1.32 MB, 32 trang )
October 2008
America’s Health Starts With
Healthy Children:
How Do States Compare?
Executive Summary Page 2
Introduction Page 5
A National Overview Page 13
How Do States Compare? Page 18
A State Snapshot: North Carolina Page 24
All State Profiles: www.commissiononhealth.org/statedata
1 America’s Health Starts With Healthy Children
A
ll parents want their children to grow up to live long, healthy lives, yet—unfortunately—not
all children have the same opportunity to be healthy. Factors such as where children live, how
much education their parents have and their race and ethnicity can make a real difference in their
health—as children and as adults.
America’s children are this nation’s greatest resource, yet tremendous health differences exist among them—
gaps that contradict the premise of equal opportunity for all Americans, undermine our economic productivity
and affect our ability to compete globally.
The Robert Wood Johnson Foundation Commission to Build a Healthier America is examining how we live our
lives and how the surrounding social, economic and physical environment can affect our health. Based on this
inquiry, the Commission will identify specific, feasible steps to improve all Americans’ health.
This chartbook, America’s Health Starts With Healthy Children: How Do States Compare?, examines the health
of children from different socioeconomic backgrounds in every state to document how healthy our nation’s
children are now and how healthy they could be if we as a nation were realizing our full health potential.
Why a chartbook on children’s health? Research has consistently shown that brain, cognitive and behavioral
development early in life are strongly linked to health outcomes later in life, including cardiovascular disease
and stroke, high blood pressure, diabetes, obesity, smoking, drug use and depression. The right opportunities
in early childhood can put a child on the path to good health.
For most of us—children and adults alike—there are big gaps between how healthy we are and how healthy
we could be. Americans at every income and educational level could be significantly healthier. That’s what
this Commission is about—seeking the best, practical strategies to help all Americans reach their full health
potential. And this chartbook helps make clear areas in which we can work together to make a difference.
Mark McClellan, M.D., Ph.D. Alice M. Rivlin, Ph.D.
Co-Chair Co-Chair
Reaching America’s Health Potential
Starts With Healthy Children:
How Do States Compare?
2 RWJF Commission to Build a Healthier America
National health benchmark:
The level of good health that
should be attainable for all infants
or children in every state. For infant
mortality, the national benchmark
used here—3.2 deaths per 1,000
live births—was the lowest infant
mortality rate experienced among
babies born to the most-educated
mothers in any state. For children’s
general health status, the national
benchmark—3.5 percent of
children with less than excellent
or very good health—was the
lowest rate in any state of less than
optimal health among children living
in higher-income families where
adults practiced healthy behaviors
(i.e., non-smokers and at least one
person who exercised regularly).
Executive Summary
Children’s health is the foundation for health throughout life, and
measures of child health are important indicators of the overall
health of our nation. This chartbook provides state and national
data on two important and widely-used measures of children’s
health: infant mortality and children’s general health status as
reported by their parents. This report also compares the current
state of children’s health in the United States to achievable
national benchmarks. For infant mortality, this national benchmark
is set at the current lowest rate of infant mortality seen in any
state among mothers with 16 or more years of schooling. For
children’s general health status, the national benchmark is set
at the lowest rate in any state of less than optimal health among
children in families that both were higher income and practiced
healthy behaviors. The gap between where we could be as a
nation and the current status of children’s health represents
unrealized health potential.
The data illustrate a consistent and striking pattern of incremental
improvements in health with increasing levels of family income
and educational attainment: As family income and levels of
education rise, health improves. In almost every state, shortfalls
in health are greatest among children in the poorest or least-
educated households, but even middle-class children are less
healthy than children with greater advantages. The differences
in health between children growing up in the most-advantaged
social and economic conditions and all others contribute to
unrealized health potential in every state. And there is room for
improvement even in the most-advantaged groups, as indicated
by comparison with national health benchmarks reflecting a
level of good health that should be attainable for all children in
every state.
3 America’s Health Starts With Healthy Children
Key Findings
The data reveal substantial shortfalls in America’s health potential at the national level and in every
state. The findings presented here provide new state-by-state evidence of the extent of unrealized
health potential among children in the United States.
Infant Mortality
• In the United States overall during 2000-2002, more than six of every 1,000 babies born alive
each year died before reaching their first birthdays. Overall infant mortality rates in states varied
considerably, from 4.6 deaths per 1,000 live births in Massachusetts to 11.0 deaths per 1,000 live
births in Washington, D.C.
• Nationally, and in nearly every state, infant mortality rates increased with decreasing levels of
mothers’ education. Compared with babies born to the most-educated mothers (those with at least
16 years of schooling), infant mortality rates were higher—by as much as 12 deaths per 1,000 live
births—for babies born to the least-educated mothers (those with less than 12 years of completed
schooling). With few exceptions, infant mortality rates also were higher—by up to five deaths per
1,000 live births—among babies born to mothers in the second highest education group (those with
13-15 years of completed schooling).
• While gaps in infant mortality by mothers’ education were evident in every state, the difference
between the overall infant mortality rate and the rate for babies born to the most-educated mothers
varied from less than one (in Maine) to over seven (in Washington, D.C.) deaths per 1,000 live births.
• Even among babies born to the most-educated mothers, infant mortality rates in nearly every
state exceeded the national benchmark—3.2 infant deaths per 1,000 live births—which should
be attainable.
Children’s General Health Status
• In the United States during 2003, 15.9 percent of children ages 17 years or younger had less than
optimal (neither very good nor excellent) health. The percent of children with less than optimal
health varied across states from 6.9 percent in Vermont to 22.8 percent in Texas.
• Nationally, and in every state, the percent of children with less than optimal health varied with family
income. Compared with higher-income children (in families with incomes at or above 400% of the
Federal Poverty Level), children in poor families (below 100% of the Federal Poverty Level) were
more likely—over six times as likely, in some states—to be in less than optimal health. Differences
were not confined to comparisons between the top and bottom groups. With few exceptions,
children in middle-income families (200-399% of the Federal Poverty Level) also appear more
likely—over twice as likely, in some states—than children in higher-income families to be in less
than optimal health.
• While the gap in children’s general health status by income was evident in every state, the size of
the difference between the overall percent of children in less than optimal health and the percent
among children in higher-income families varied across states—from a difference of 2 percent in
New Hampshire to 16 percent in Texas.
• Even among children in higher-income families, the percent of children with less than optimal health
in almost every state exceeded the national benchmark—3.5 percent—which should be attainable.
Unrealized health potential is the difference between
‘what is’ (the current level of children’s health) and
‘what is attainable’ (the level of health that would occur
if all children were as healthy as children in the most
socially-advantaged group).
Introduction
Children’s health is the foundation for health throughout life, and measures of child health are
important indicators of our nation’s overall state of health. This chartbook focuses on the health of
children to explore whether we are reaching our full health potential as a nation and in every state.
Considering the differences between ‘what is’ (current overall levels of child health) and ‘what is
attainable’ (the levels of health that would be achieved if all children were as healthy as children in
the most favorable social and economic conditions), the new state-by-state evidence presented
here reveals substantial unrealized health potential among America’s children.
Purpose
This chartbook is intended to inform, raise awareness and stimulate discussion. Its purpose is
to provide information that will be helpful to policy-makers, advocates and other leaders in their
efforts to: (1) assess how far they are from reaching the full health potential of children in their state;
(2) raise awareness about the need to address social factors in order to close the current gaps
in children’s health; and (3) stimulate discussion and debate within states and nationally about
promising directions for closing those gaps.
While analyzing the causes of the health gaps was not within the scope of this Commission’s work,
a large body of research shows that the causes are complex, and that medical care interventions
are important but not sufficient. The information presented should be used as a point of departure
for a process of inquiry—stimulating an exploration of the most promising national and state
policies to realize America’s full health potential by shaping healthier conditions in which children
and their families live, work, learn and play.
This report was produced by research staff of the Robert Wood Johnson Foundation Commission
to Build a Healthier America to aid Commissioners as they explore actions outside the medical
care system that could improve the health of all Americans. Additional information about the
Commission is available at www.commissiononhealth.org.
Content
Findings from America’s Health Starts with Healthy Children: How Do States Compare? are
presented in two forms: a print overview and a Web version that contains a wealth of state-by-state
data. The print version includes three sets of charts. The first set describes how two key indicators
of children’s health vary markedly at the national level by social and economic factors. The second
set of tables and maps describes differences in these indicators by social and economic factors
at the state level, and states are ranked according to the size of the unrealized health potential in
children’s health. The final set of charts provides an example of the information that is available on
the Commission Web site for every state.
Readers can download individual files for each state at www.commissiononhealth.org/statedata.
The files provide data on infant mortality and children’s general health status, as well as information
on how social factors such as a family’s income, parents’ education levels and racial or ethnic
group are linked with infant mortality and children’s general health status in the state.
6 RWJF Commission to Build a Healthier America
Children’s Health Is an Indicator
of Our Nation’s Health
Children’s Health Shapes Health roughout Life
Good health and a nurturing and stimulating environment during childhood determine our potential
for health and well-being throughout life. Getting a healthy start in life improves a child’s chances
of becoming a healthy adult and avoiding chronic conditions that can be limiting or disabling.
Childhood obesity, for example, is a strong predictor of adult obesity, with the accompanying risks
of chronic disease, disability and shortened life expectancy. In addition to children’s health, child
development also shapes adult health in powerful ways. A large body of research has consistently
shown that cognitive and behavioral development early in life are strongly linked to an array of
important health outcomes later in life. Adult health outcomes that have been linked to early child
development (often through effects of educational attainment and/or health-related behaviors, and
also through more direct physiologic effects) include heart disease and stroke, high blood pressure,
diabetes, obesity, smoking, drug use and depression. These conditions account for a major portion
of preventable illness and premature death in the United States.
What Shapes Children’s Health?
A child’s health is powerfully shaped by the environment in which he or she lives, learns and plays.
Both family and community matter and private and public policies at the local, state and national
level influence a child’s opportunity to be healthy. This chartbook highlights three of many social
factors that are known to be strongly related to children’s health: levels of household income,
educational attainment in the family, and racial or ethnic group. Many—although not all—modifiable
factors known to influence children’s health are shaped in significant ways by family income and/
or education. For example, educated parents may have a better understanding of health-related
behaviors, along with resources to make healthier choices. They may be better able to obtain well-
paying jobs, which in turn can determine income and access to health insurance. Income is often
linked with housing quality and neighborhood of residence, as well as being able to afford a healthy
diet. In addition to family characteristics, community influences such as safety, school quality,
presence of favorable role models and availability of healthful foods and recreational opportunities
also affect children’s health. Racial or ethnic group matters in part because it continues to influence
educational and employment opportunities; in addition, discrimination and its legacy in residential
segregation mean that black and Hispanic families more often live in substandard housing
and unsafe or deteriorating neighborhood conditions compared with whites with similar incomes
and education.
Medical care is important for children’s health. For example, timely immunizations and regular
treatment for conditions like asthma can make a big difference in overall well-being. Genetic
predisposition to certain diseases also influences children’s health. But many experts have
concluded that medical care and genes actually play a relatively minor role compared with the
influence of the physical and social conditions in which children grow up. Children continue to
develop not only physically but also cognitively and behaviorally through adolescence, but the first
five years of life are particularly crucial.
7 America’s Health Starts With Healthy Children
Healthier behaviors
by parents
Positive effects on
neuroendocrine
systems that can
lead to lesser risks
for developing
chronic diseases
such as heart disease
and diabetes
Resources to cope
with stressors
(e.g., child care,
transportation,
health insurance)
Decreased levels
of chronic stress
experienced
by children
Increased family
income
Better jobs and
increased family
income
Affordability of
good housing,
a safe neighborhood
with access
to recreational
opportunities and
nutritious diet
Higher levels
of parents’
education
Good role models for
children and lower
exposure to unhealthy
conditions such as
secondhand smoke
Higher levels
of parents’
education
How Social Environments in Childhood
Can Shape Health Later in Life
8 RWJF Commission to Build a Healthier America
What Do We Know About Ways to Improve Children’s Health?
Although there is much more to learn about how to improve children’s health, significant new
knowledge developed over the past 15 years points us in promising directions. We now know that
several modifiable factors can make a dramatic difference in children’s health and well-being. Not
surprisingly, the greatest improvement can generally be seen among those who start off farthest
behind as a result of living in disadvantaged circumstances. We have learned, however, that
potential improvements in health are not limited to children in poor and less-educated families; even
children in families considered to be “middle class”—in other words, the majority of children in this
country—can achieve improved health with timely interventions in the following areas:
• Adequate stimulation and interaction with supportive caregivers, including family, teachers and
child-care workers.
• A nutritious diet and sufficient physical activity.
• Safe and health-promoting neighborhood conditions, with access to grocery stores, sidewalks and
parks and recreational areas.
Improving children’s social and physical environments—which are clearly linked with household
income and education—enhances their health and cognitive, behavioral and physical
development.
Improving children’s health and cognitive, behavioral and physical development gives them the
foundation needed to be healthy as adults.
For more information see Issue Brief 1: Early Childhood Experiences: Laying the Foundation for
Health Across a Lifetime at www.commissiononhealth.org.
A child’s health is powerfully
shaped by the environment
in which he or she lives,
learns and plays. Both family
and community matter.
9 America’s Health Starts With Healthy Children
Measures of Child Health
• Infant mortality. Deaths during the first year of life were considered a key indicator of population
health. Infant mortality rates—the number of infant deaths per 1,000 live births—were examined at
the national and state levels for babies born to women ages 20 years or older; this age restriction
permitted us to more completely examine differences in infant mortality by mother’s education.
Infant mortality rates were considered to be statistically reliable for groups with at least 20
infant deaths.
• Children’s general health status. A parent’s or guardian’s overall assessment of a child’s health (as
excellent, very good, good, fair or poor), which studies show corresponds closely with objective
clinical assessments by health professionals. The focus at the national and state levels was on the
percentage of children ages 17 years or younger whose general health status was considered to be
less than optimal—that is, assessed by their parents or guardians to be other than excellent or very
good. Rates of less than optimal health were considered to be statistically reliable when the relative
standard errors were 30 percent or less.
Social Factors
• Income. Taking family size into account, family income was categorized in 100-200 percent
increments of the Federal Poverty Level (FPL), which has been defined as the amount of income
providing a bare minimum of food, clothing, transportation, shelter and other necessities. In 2006,
the U.S. FPL was $16,079 for a family of three and $20,614 for a family of four. Children were
considered to be poor (with household incomes below 100% of FPL), near poor (100-199% of
FPL), middle income (200-399% of FPL), or higher income (400% of FPL or higher).
• Education. Slightly different measures were used to describe education, depending on the indicator
of children’s health and data source. To examine infant mortality in relation to social factors, the
educational attainment of the mother was measured in years of schooling and categorized to
correspond to level of education (0–11 years, 12 years, 13–15 years, and 16 or more years). To
describe social factors at the national and state levels and to examine children’s general health
status by those factors, education was categorized according to the highest level attained by any
person in the household. Social factors were examined using four categories (less than high-school
graduate, high-school graduate, some college and college graduate); children’s general health
status was examined using three categories (less than high-school graduate, high-school graduate
and at least some college).
• Racial or ethnic group. Mother’s (when examining infant mortality) and child’s (when examining
children’s general health status) racial or ethnic group were considered using slightly different
categories depending on the data source and size of the groups. At the national level, we
considered: (a) all categories for which information was collected by the U.S. Census Bureau, to
describe the racial or ethnic composition of all children; and (b) three categories—non-Hispanic
whites, non-Hispanic blacks and Hispanics, to describe differences in the children’s health
indicators by racial or ethnic group. At the state level, we considered: (a) all categories for which
information in the state was collected by the National Survey of Children’s Health, to describe
the racial or ethnic composition of all children; and (b) categories in the relevant data source that
included at least 3 percent of children in the state (smaller groups and individuals reporting more
than one racial or ethnic group were included with “other”), to describe differences in the children’s
health indicators.
10 RWJF Commission to Build a Healthier America
Data Sources
Four sources of data were used to produce this chartbook:
• The 2006 American Community Survey (ACS), conducted by the U.S. Census Bureau, was
analyzed to obtain information, nationally and in each state, on household income and racial or
ethnic group.
• The 2005-2007 Current Population Survey (CPS), conducted by the U.S. Census Bureau, was
analyzed to obtain information, nationally and in each state, on household education levels.
• The 2000-2002 Period Linked Birth/Infant Death Data Set from the Centers for Disease Control
and Prevention, National Center for Health Statistics, was used to obtain information on infant
mortality, nationally and in each state, by mother’s educational attainment and mother’s racial
or ethnic group.
• The 2003 National Survey of Children’s Health (NSCH), conducted by the Centers for Disease
Control and Prevention, National Center for Health Statistics, was analyzed to obtain information
on: children’s general health status, nationally and in each state, by household income and
education and by child’s racial or ethnic group; children’s general health status by income within
racial or ethnic groups nationally; and children’s general health status according to health-related
behaviors of persons in their families, within each household income group nationally.
A full list of data sources, including complete descriptions and limitations of sources, can be found
in the Technical Notes available at www.commissiononhealth.org/PDF/ChartbookTechNotes.pdf.
Analyses
We examined differences in each of the two measures of children’s health by social groups at both
the national and state levels. Infant mortality was examined, by mother’s education and by mother’s
racial or ethnic group, at the national level and within each state; information on income was not
included in the data source. Children’s general health status was examined, by household income
and level of education and by child’s racial or ethnic group, at the national level and within each
state; in addition, we examined differences at the national level in this health measure by income
within racial or ethnic groups and by household health-related behaviors within income groups.
We estimated the size of the “health gaps” for each state and Washington, D.C., using a standard
measure known as the Population Attributable Risk, or PAR. In this report, the PAR was calculated
at the state level to quantify the improvement in overall infant mortality or children’s general health
status that would occur if all infants or children in the state had the level of health experienced by
those in the state’s most socially-advantaged group. States were ranked according to the size of
this health gap; states with the same size gap (to one decimal point) were given the same ranking.
For mapping purposes, states were grouped based on the size of the gaps into three approximately
equal groups (i.e., as having small, medium or large gaps).
11 America’s Health Starts With Healthy Children
It is important to note that the highest education and income groups used here to reflect the
most socially-advantaged groups were relatively large: Nationally, 35 percent of children lived in
households with at least one adult who had graduated from college and 28 percent lived in families
with incomes at or above four times the FPL. If the data sources had permitted comparisons with
children in the top 5 or 10 percent of family education and income levels, the health differences
could have been even larger. The health gaps reported here thus are likely to understate the true
magnitude and extent of unrealized health potential in each state and in the nation overall.
A “national benchmark” was also calculated for each measure of children’s health. This additional
reference point—intended to represent a level of good health that should be attainable for all
children in every state—is featured to emphasize two additional points:
(1) Levels of health among children are better in some states than in others, even when only
children in the highest income or education groups are considered.
(2) Differences in health occur among children even within the most socially-advantaged groups.
At every level of family income or education, children’s opportunities for good health are also
shaped by other factors, including whether the adults they live with practice good health-related
habits like exercising regularly.
For infant mortality, the national benchmark used here—3.2 deaths per 1,000 live births, found
in New Jersey and Washington state—was the lowest statistically-reliable infant mortality rate in
any state for babies born to the most-educated mothers. (Information on health-related behaviors
was not available in the infant mortality data source.) For children’s general health status, the
national benchmark—3.5 percent of children in less than very good health, found in Colorado—was
selected as the lowest statistically-reliable rate in any state of less than optimal health among
children in higher-income households where adults practiced healthy behaviors (i.e., non-smokers
and at least one person who exercised regularly).
For further information on analytic methods, see the Technical Notes for this document at
www.commissiononhealth.org/PDF/ChartbookTechNotes.pdf.
Charts and Data
13 America’s Health Starts With Healthy Children
100
80
60
40
20
0
PERCENT OF CHILDREN, AGES
<
–
17 YEARS
:
Social Factors Affecting Children’s Health
Source: 2006 American Community Survey (for data on income and racial or ethnic group); 2005-2007 Current Population Survey (for education data).
† Guidelines set by the U.S. government for the amount of income providing a bare minimum of food, clothing, transportation, shelter and other necessities. In 2006, the U.S. FPL
was $16,079 for a family of three and $20,614 for a family of four.
‡ “Other” includes children in any other racial or ethnic group or in more than one group.
Prepared for the RWJF Commission to Build a Healthier America by the Center on Social Disparities in Health at the University of California, San Francisco.
18%
21%
32%
28%
9%
24%
32%
35%
15%
20%
1%
4%
3%
57%
tOne third of children live in households where no one has
schooling beyond high school, one third live with at least
one person who has attended but not completed college
and one third live with at least one college graduate.
tQFSDFOUPGDIJMESFOOBUJPOXJEFBSFOPO)JTQBOJD
XIJUFQFSDFOUBSF)JTQBOJDQFSDFOUBSFOPO
Hispanic black, 4 percent are Asian or Pacific Islander,
1 percent are American Indian or Alaska Native and
3 percent are in another or more than one racial or
ethnic group.
Health during childhood is powerfully linked with
social factors such as the income and education levels
of a child’s family and his or her racial or ethnic
group. is national snapshot of children ages
ZFBSTPSZPVOHFSTIPXTUIBU
t5XPmGUITPGDIJMESFOOBUJPOXJEFMJWFJOQPPSPS
OFBSQPPSIPVTFIPMETPOFUIJSEMJWFJONJEEMF
income households and more than one fourth live
JOIJHIFSJODPNFIPVTFIPMET
Poor (<100% FPL)
Near poor (100–199% FPL)
Middle income (200–399% FPL)
Higher income
(
>
–
400% FPL)
Household Income
(Percent of Federal Poverty Level)
†
Less than high-school graduate
High-school graduate
Some college
College graduate
Household Education
(Highest level attained by any person)
Black, Non-Hispanic
Hispanic
American Indian or Alaska Native
Asian or Pacific Islander
Other
‡
White, Non-Hispanic
Child’s Racial or Ethnic Group
14 RWJF Commission to Build a Healthier America
18
15
12
9
6
3
00
INFANT MORTALITY RATE (PER 1,000 LIVE BIRTHS)
AMONG MOTHERS, AGES >_20 YEARS
:
Gaps in Infant Mortality
Source: 2000-2002 Period Linked Birth/Infant Death Data Set.
1 The number of deaths in the first year of life per 1,000 live births.
2 The national benchmark for infant mortality represents the level of mortality that should be attainable for all infants in every state. The benchmark used here—3.2 deaths per
1,000 live births, seen in New Jersey and Washington state—is the lowest statistically-reliable rate among babies born to the most-educated mothers in any state.
Rates for groups including at least 20 infant deaths were considered to be statistically reliable.
Prepared for the RWJF Commission to Build a Healthier America by the Center on Social Disparities in Health at the University of California, San Francisco.
40 percent higher than that for babies born to mothers
with 16 or more years of schooling.
te infant mortality rate among babies born to non-
Hispanic black mothers is 2.5 times the rates seen among
babies of non-Hispanic white or Hispanic mothers.
Comparing these rates against the national benchmark
2
for infant mortality reveals unrealized health potential
among babies across maternal education and racial or
ethnic groups. Infants in every group could do better.
Infant mortality rates
1
—a key indicator of overall
health—vary by mother’s education and racial or
ethnic group nationally.
tCompared with babies born to the most-educated
mothers, babies born to mothers with less education
are more likely to die before reaching their first
birthdays. While infant mortality rates are highest
among babies born to mothers with 12 or fewer years
of education, the rate for babies born to mothers
with 13–15 years of schooling is approximately
0–11 years
12 years
13–15 years
16 or more years
Years of School Completed by Mother
Black, Non-Hispanic
Hispanic
White, Non-Hispanic
Mother’s Racial or Ethnic Group
7.8
7.4
4.2
13.5
5.2
5.4
National
benchmark
2
3.2
U.S. overall
6.5
6.0
15 America’s Health Starts With Healthy Children
54
45
36
27
18
9
0
PERCENT OF CHILDREN, AGES
<
–
17 YEARS,
IN LESS THAN VERY GOOD HEALTH
:
Gaps in Children’s General Health Status
Source: 2003 National Survey of Children’s Health.
1 Based on parental assessment and measured as poor, fair, good, very good or excellent. Health reported as less than very good was considered to be less than optimal.
2 The national benchmark for children’s general health status represents the level of health that should be attainable for all children in every state. The benchmark used here—
3.5 percent of children with health that was less than optimal, seen in Colorado—is the lowest statistically-reliable rate observed in any state among children whose families
were not only higher income but also practiced healthy behaviors (i.e., non-smokers and at least one person who exercised regularly). Rates with relative standard errors of
30 percent or less were considered to be statistically reliable.
Prepared for the RWJF Commission to Build a Healthier America by the Center on Social Disparities in Health at the University of California, San Francisco.
tCompared with children living with someone who has
completed some college, children in households without
a high-school graduate were more than four times as
likely—and those in households with a high-school
graduate twice as likely—to be in less than optimal health.
t/PO)JTQBOJDXIJUFDIJMESFOGBSFCFUUFSUIBOUIPTF
who are non-Hispanic black or Hispanic.
Comparing these rates against the national benchmark
2
for children’s general health status reveals unrealized
health potential among children across income,
education and racial or ethnic groups.
In the United States overall, children’s general health
status
1
varies by family income and education and
by racial or ethnic group. Children in the least-
advantaged groups typically experience the worst
health, but even children in middle-class families are
less healthy than those with greater advantages.
t$PNQBSFEXJUIDIJMESFOJOIJHIFSJODPNFGBNJMJFT
children in poor, near-poor or middle-income
families were 4.7, 2.8 and 1.5 times as likely to be
in less than optimal health.
Less than high-school graduate
High-school graduate
At least some college
Household Education
(Highest level attained by any person)
Black, Non-Hispanic
Hispanic
White, Non-Hispanic
Child’s Racial or Ethnic Group
43.3
21.7
10.1
Household Income
(Percent of Federal Poverty Level)
33.3
19.8
10.8
7.1
21.1
35.6
9.3
National
benchmark
2
3.5
U.S. overall
15.9
Poor (<100% FPL)
Near poor (100–199% FPL)
Middle income (200–399% FPL)
Higher income (>
–
400% FPL)
16 RWJF Commission to Build a Healthier America
54
45
36
27
18
9
0
PERCENT OF CHILDREN, AGES
<
–
17 YEARS,
IN LESS THAN VERY GOOD HEALTH
Income Is Linked With Health
Regardless of Racial or Ethnic Group
Source: 2003 National Survey of Children’s Health.
1 Based on parental assessment and measured as poor, fair, good, very good or excellent. Health reported as less than very good was considered to be less than optimal.
2 The national benchmark for children’s general health status represents the level of health that should be attainable for all children in every state. The benchmark used here—
3.5 percent of children with health that was less than optimal, seen in Colorado—is the lowest statistically-reliable rate observed in any state among children whose families
were not only higher income but also practiced healthy behaviors (i.e., non-smokers and at least one person who exercised regularly). Rates with relative standard errors of
30 percent or less were considered to be statistically reliable.
Prepared for the RWJF Commission to Build a Healthier America by the Center on Social Disparities in Health at the University of California, San Francisco.
t"UFBDIMFWFMPGJODPNFOPO)JTQBOJDCMBDLBOE
)JTQBOJDDIJMESFOGBSFEXPSTFUIBOOPO)JTQBOJD
whites.
ɨFFYUFOUPGVOSFBMJ[FEIFBMUIQPUFOUJBMJTFWFOHSFBUFS
XIFODPOTJEFSJOHUIFMFWFMPGDIJMESFOTIFBMUIUIBU
TIPVMECFBUUBJOBCMF"UFWFSZJODPNFMFWFMJOFWFSZ
SBDJBMPSFUIOJDHSPVQUIFQFSDFOUBHFPGDIJMESFOJO
less than optimal health was higher than the national
CFODINBSL
2
GPSDIJMESFOTHFOFSBMIFBMUITUBUVT
(BQTJODIJMESFOTIFBMUICZJODPNFEPOPUTJNQMZ
SFnFDUEJĊFSFODFTCZSBDFPSFUIOJDJUZOPSEPUIFZ
TJNQMZSFnFDUEJĊFSFODFTCFUXFFOUIFSJDIBOEUIF
poor. Both income and racial or ethnic group matter.
t8JUIJOFBDISBDJBMPSFUIOJDHSPVQBTUFFQJODPNF
HSBEJFOUJTFWJEFOU$IJMESFOTHFOFSBMIFBMUITUBUVT
1
JNQSPWFTBTGBNJMZJODPNFJODSFBTFT"NPOHOPO
)JTQBOJDXIJUFTGPSFYBNQMFDIJMESFOJOQPPS
OFBSQPPSPSNJEEMFJODPNFIPVTFIPMETXFSF
BOEUJNFTBTMJLFMZUPCFJOMFTTUIBOWFSZHPPE
IFBMUIBTDIJMESFOJOIJHIFSJODPNFIPVTFIPMET
Household Income (Percent of Federal Poverty Level)
HISPANIC WHITE, NON-HISPANICBLACK, NON-HISPANIC
29.1
24.0
13.2
10.8
47.6
33.5
24.4
15.5
20.7
12.6
8.0
5.9
National
benchmark
2
3.5
U.S.
overall
15.9
Poor (<100% FPL)
Near poor (100–199% FPL)
Middle income (200–399% FPL)
Higher income (
>
–
400% FPL)
17 America’s Health Starts With Healthy Children
54
45
36
27
18
9
0
PERCENT OF CHILDREN, AGES
<
–
17 YEARS,
IN LESS THAN VERY GOOD HEALTH
Health-Related Behaviors and Income
Matter for Children’s Health
Source: 2003 National Survey of Children’s Health.
1 Based on parental assessment and measured as poor, fair, good, very good or excellent. Health reported as less than very good was considered to be less than optimal.
2 The national benchmark for children’s general health status represents the level of health that should be attainable for all children in every state. The benchmark used here—
3.5 percent of children with health that was less than optimal, seen in Colorado—is the lowest statistically-reliable rate observed in any state among children whose families
were not only higher income but also practiced healthy behaviors (i.e., non-smokers and at least one person who exercised regularly). Rates with relative standard errors of
30 percent or less were considered to be statistically reliable.
Prepared for the RWJF Commission to Build a Healthier America by the Center on Social Disparities in Health at the University of California, San Francisco.
e national benchmark for children’s general health
status reflects the best (in this case, lowest) statistically-
reliable rate of less than optimal health observed in
any state among children whose families were both
higher income and practiced healthy behaviors. is
benchmark—3.5 percent of children with less than
optimal health, seen in Colorado—reflects a level of
good health that should be attainable for all children
nationally and in every state.
Differences in children’s general health status
1
occur
not only across social groups but also depending on
health-related behaviors in families. At every income
level, children living in families where no one
exercises regularly or someone smokes are more likely
to be in less than optimal health than children in
families with healthier behaviors.
HOUSEHOLD INCOME (PERCENT OF FEDERAL POVERTY LEVEL)
POOR
(<100% FPL)
35.4
33.1
NEAR POOR
(100–199% FPL)
22.2
17.5
MIDDLE INCOME
(200–399% FPL)
13.2
9.0
HIGHER INCOME
(
>
–
400% FPL)
10.0
5.8
National
benchmark
2
3.5
U.S.
overall
15.9
Unhealthy behavior household
Healthy behavior household
18 RWJF Commission to Build a Healthier America
Number of Babies
Born Alive³
Overall Infant Mortality Rate¹
0–11 Years
12 Years
13–15 Years
16 or More Years = Overall
Rate if Gap Were Eliminate
d
Percentage of Population That
Would be Affected if
Gap Were Eliminated
4
Size of Infant Mortality Gap²
Ranking on Size of Infant
Mortality Gap
5
Infant Mortality Rate (per 1,000 Live Births) by Years
of Schooling Completed by Mother
Alabama
Alaska
Arizona
Arkansas
California
Colorado
Connecticut
Delaware
District of Columbia
Florida
Georgia
Hawaii
Idaho
Illinois
Indiana
Iowa
Kansas
Kentucky
Louisiana
Maine
51,730
8,862
74,349
31,287
475,993
59,523
39,413
9,669
6,575
180,492
115,607
15,681
18,446
163,328
76,101
34,193
34,764
47,599
55,230
12,425
8.8
6.4
6.5
7.8
5.2
5.5
5.9
9.2
11.0
6.7
8.1
6.7
6.5
7.4
7.4
5.5
6.5
6.2
9.3
4.8
11.1
11.1
6.9
10.0
5.5
7.1
8.1
11.6
14.3
8.7
9.0
8.8
9.6
8.3
9.7
9.6
8.6
9.8
14.1
5.0
†
9.7
7.6
7.5
8.6
5.5
6.3
7.6
12.2
11.7
7.3
9.6
6.6
6.6
8.4
8.1
5.9
8.8
6.6
9.7
6.7
7.9
3.4
5.7
7.2
5.1
5.8
5.7
7.7
8.8
5.8
7.2
7.1
5.3
7.6
6.4
4.8
5.2
5.7
8.0
3.3
6.4
3.0
†
4.6
5.2
3.7
3.3
3.9
5.9
3.7
4.1
4.9
5.4
5.0
5.1
5.2
4.2
4.5
3.9
6.3
4.0
75.6
79.9
77.0
79.1
74.0
65.4
56.8
69.0
62.0
74.2
71.0
74.0
75.5
67.5
73.9
68.9
68.1
76.0
77.0
68.0
2.4
3.4
‡
1.8
2.6
1.5
2.2
2.0
3.3
7.3
2.6
3.2
1.4
1.4
2.2
2.2
1.3
2.0
2.4
3.0
0.8
30
49
14
34
9
23
18
48
51
34
46
6
6
23
23
5
18
30
43
1
Prepared for the RWJF Commission to Build a Healthier America by the Center on Social Disparities in Health at the University of California, San Francisco.
Source: 2000-2002 Period Linked Birth/Infant Death Data Set.
1 The number of deaths during the first year of life per 1,000 live births.
2 Defined as the size of improvement in the state’s overall rate if all infants experienced the infant mortality rate of infants whose mothers had completed 16 or more years of schooling.
3 Number of babies born alive to mothers ages 20 years or older; this number represents a yearly average for 2000-2002.
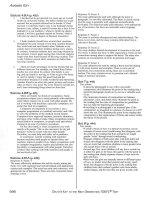
Gaps in Infant Mortality Rates by Mother’s Education:
How Do States Compare?
with 12 years or 13–15 years of schooling are also
typically higher than rates among babies whose
mothers had 16 or more years of schooling. Comparing
states based on the size of the gaps
2
between the infant
mortality rate for the state as a whole and that among
babies born to the most-educated mothers tells us that
there is unrealized health potential among babies not
just at the national level but in every state as well.
Differences in infant mortality rates
1
by mother’s
education are similar at the state level to those seen
nationwide. In almost every state, differences in infant
mortality are seen between babies born to the most-
educated mothers (who are least likely to die in the first
year of life) and babies born to mothers with less
education. Rates of infant mortality are highest among
babies born to mothers with less than 12 years of
schooling, but rates among babies born to mothers
19 America’s Health Starts With Healthy Children
Maryland
Massachusetts
Michigan
Minnesota
Mississippi
Missouri
Montana
Nebraska
Nevada
New Hampshire
New Jersey
New Mexico
New York
North Carolina
North Dakota
Ohio
Oklahoma
Oregon
Pennsylvania
Rhode Island
South Carolina
South Dakota
Tennessee
Texas
Utah
Vermont
Virginia
Washington
West Virginia
Wisconsin
Wyoming
United States
66,626
76,054
119,692
62,382
34,973
66,265
9,719
22,501
27,802
13,635
107,543
22,722
234,672
103,827
7,005
134,592
42,447
40,603
130,384
11,454
47,431
9,347
67,404
312,957
44,263
5,889
89,630
72,219
17,924
62,161
5,491
3,580,884
7.4
4.6
7.6
5.1
9.9
7.1
6.6
6.5
5.8
4.7
5.8
6.1
5.8
8.0
7.5
7.3
7.6
5.2
6.8
6.3
8.5
6.3
8.6
5.5
5.1
5.2
6.9
5.2
7.4
6.4
5.8
6.5
9.3
5.9
11.0
7.4
12.4
10.7
8.4
7.8
6.2
4.6
†
7.8
5.3
6.8
9.7
17.2
11.0
9.2
6.2
10.4
7.3
11.6
9.2
11.7
5.6
7.8
8.4
†
10.3
6.8
11.3
10.2
8.5
†
7.8
8.8
5.9
8.2
6.5
10.9
8.2
6.9
8.4
6.1
6.1
6.8
6.9
6.8
9.3
9.0
8.3
8.8
6.0
7.4
6.8
9.2
7.1
9.8
6.0
5.5
7.1
8.3
5.4
7.2
7.6
7.3
7.4
6.7
4.7
7.1
4.3
8.9
6.8
6.6
6.1
5.3
4.6
5.4
5.9
5.3
7.8
6.5
6.4
6.6
4.5
5.5
5.4
7.8
6.7
8.0
5.1
4.6
3.6
†
6.7
4.3
6.7
5.6
4.8
6.0
5.3
3.4
4.7
3.7
6.8
4.2
5.1
5.0
3.5
3.5
3.2
3.8
3.7
5.6
5.4
4.4
4.7
3.8
4.0
4.4
5.3
4.0
4.9
3.9
4.0
3.4
4.2
3.2
4.4
3.9
4.0
†
4.2
58.1
55.8
69.9
60.5
78.5
70.3
71.7
66.7
80.2
60.9
59.6
79.1
68.9
71.8
64.9
70.4
77.6
72.3
65.5
58.7
74.5
69.5
75.1
76.3
73.0
64.0
63.9
65.8
79.3
67.5
76.7
70.6
2.1
1.2
2.8
1.4
3.1
2.9
1.5
1.6
2.3
1.2
2.6
2.3
2.1
2.5
2.2
2.8
2.9
1.5
2.9
1.9
3.2
2.3
3.7
1.7
1.2
1.8
2.7
2.1
3.0
2.5
1.9
‡
2.2
20
2
38
6
45
40
9
12
27
2
34
27
20
32
23
38
40
9
40
16
46
27
50
13
2
14
37
20
43
32
16
—
4 The percent of babies whose mothers had completed fewer than 16 years of schooling.
5 Ranked by size of gap, from smallest to largest; states with the same size gap were assigned the same ranking.
† This estimate of infant mortality is based on fewer than 20 deaths and hence may be statistically unreliable.
‡ Fewer than 20 infant deaths occurred among babies born to mothers with 16 years or more of education in this state; thus, the estimate of the size of the infant mortality gap
by mother’s education is considered statistically unreliable.
Number of Babies
Born Alive³
Overall Infant Mortality Rate¹
0–11 Years
12 Years
13–15 Years
16 or More Years = Overall
Rate if Gap Were Eliminate
d
Percentage of Population That
Would be Affected if
Gap Were Eliminated
4
Size of Infant Mortality Gap²
Ranking on Size of Infant
Mortality Gap
5
Infant Mortality Rate (per 1,000 Live Births) by Years
of Schooling Completed by Mother
Alabama
Alaska
Arizona
Arkansas
California
Colorado
Connecticut
Delaware
District of Columbia
Florida
Georgia
Hawaii
Idaho
Illinois
Indiana
Iowa
Kansas
Kentucky
Louisiana
Maine
51,730
8,862
74,349
31,287
475,993
59,523
39,413
9,669
6,575
180,492
115,607
15,681
18,446
163,328
76,101
34,193
34,764
47,599
55,230
12,425
8.8
6.4
6.5
7.8
5.2
5.5
5.9
9.2
11.0
6.7
8.1
6.7
6.5
7.4
7.4
5.5
6.5
6.2
9.3
4.8
11.1
11.1
6.9
10.0
5.5
7.1
8.1
11.6
14.3
8.7
9.0
8.8
9.6
8.3
9.7
9.6
8.6
9.8
14.1
5.0
†
9.7
7.6
7.5
8.6
5.5
6.3
7.6
12.2
11.7
7.3
9.6
6.6
6.6
8.4
8.1
5.9
8.8
6.6
9.7
6.7
7.9
3.4
5.7
7.2
5.1
5.8
5.7
7.7
8.8
5.8
7.2
7.1
5.3
7.6
6.4
4.8
5.2
5.7
8.0
3.3
6.4
3.0
†
4.6
5.2
3.7
3.3
3.9
5.9
3.7
4.1
4.9
5.4
5.0
5.1
5.2
4.2
4.5
3.9
6.3
4.0
75.6
79.9
77.0
79.1
74.0
65.4
56.8
69.0
62.0
74.2
71.0
74.0
75.5
67.5
73.9
68.9
68.1
76.0
77.0
68.0
2.4
3.4
‡
1.8
2.6
1.5
2.2
2.0
3.3
7.3
2.6
3.2
1.4
1.4
2.2
2.2
1.3
2.0
2.4
3.0
0.8
30
49
14
34
9
23
18
48
51
34
46
6
6
23
23
5
18
30
43
1
Prepared for the RWJF Commission to Build a Healthier America by the Center on Social Disparities in Health at the University of California, San Francisco.
Source: 2000-2002 Period Linked Birth/Infant Death Data Set.
1 The number of deaths during the first year of life per 1,000 live births.
2 Defined as the size of improvement in the state’s overall rate if all infants experienced the infant mortality rate of infants whose mothers had completed 16 or more years of schooling.
3 Number of babies born alive to mothers ages 20 years or older; this number represents a yearly average for 2000-2002.
Gaps in Infant Mortality Rates by Mother’s Education:
How Do States Compare?
with 12 years or 13–15 years of schooling are also
typically higher than rates among babies whose
mothers had 16 or more years of schooling. Comparing
states based on the size of the gaps
2
between the infant
mortality rate for the state as a whole and that among
babies born to the most-educated mothers tells us that
there is unrealized health potential among babies not
just at the national level but in every state as well.
Differences in infant mortality rates
1
by mother’s
education are similar at the state level to those seen
nationwide. In almost every state, differences in infant
mortality are seen between babies born to the most-
educated mothers (who are least likely to die in the first
year of life) and babies born to mothers with less
education. Rates of infant mortality are highest among
babies born to mothers with less than 12 years of
schooling, but rates among babies born to mothers
20 RWJF Commission to Build a Healthier America
Source: 2000–2002 Period Linked Birth/Infant Death Data Set.
1 Defined as the size of improvement in the state’s overall rate if all infants experienced the infant mortality rates of infants whose mothers had completed 16 or more years of schooling.
2 States were grouped into three approximately equal groups based on the size of the gaps in infant mortality rates by mother’s education.
Note: Because fewer than 20 infant deaths occurred among babies born to mothers with 16 years or more of education in Alaska and Wyoming, estimates of the infant mortality
gap by mother’s education in these states are considered statistically unreliable.
Prepared for the RWJF Commission to Build a Healthier America by the Center on Social Disparities in Health at the University of California, San Francisco.
Size
2
of Infant Mortality Gap
(Deaths in first year of life per 1,000 live births)
Small Gap (0.8–1.9)
Medium Gap (2.0–2.5)
Large Gap (2.6–7.3)
N
0 125 250 500 750 1,000KM
Washington, D.C.
Gaps in Infant Mortality Rates by Mother’s Education:
How Do States Compare?
state-level gap
1
in infant mortality by mother’s
education varies markedly across the United States,
there is unrealized health potential among babies in
every state.
In almost every state, rates of infant mortality among
babies born to mothers ages 20 years or older were
lowest for those whose mothers had the most
education and increased as the level of maternal
education decreased. Although the size of the
21 America’s Health Starts With Healthy Children
Source: 2003 National Survey of Children’s Health.
1 Assessed by their parents to be in less than very good or excellent health.
2 Defined as the size of the improvement in the state’s overall rate if all children had the level of health experienced by children in higher-income families.
3 States were grouped into three approximately equal groups based on the size of the gaps in children’s general health status by family income.
Prepared for the RWJF Commission to Build a Healthier America by the Center on Social Disparities in Health at the University of California, San Francisco.
Size
3
of Health Gap
(Percent of children in less than optimal health)
Small Gap (2.0–5.7)
Medium Gap (5.8–8.3)
Large Gap (8.4–16.1)
N
0 125 250 500 750 1,000KM
Gaps in Children’s General Health Status by Family Income:
How Do States Compare?
Although the size of the state-level gap
2
in children’s
general health status by family income varies markedly,
there is unrealized health potential among children in
every state.
In almost every state, the percent of children ages
17 years or younger in less than optimal health
1
was
lowest among children in higher-income families and
increased as family income decreased.
Washington, D.C.
22 RWJF Commission to Build a Healthier America
Alabama
Alaska
Arizona
Arkansas
California
Colorado
Connecticut
Delaware
District of Columbia
Florida
Georgia
Hawaii
Idaho
Illinois
Indiana
Iowa
Kansas
Kentucky
Louisiana
Maine
1,102,924
188,133
1,512,175
678,604
9,378,237
1,147,831
832,105
198,401
107,436
3,907,632
2,287,060
295,749
370,187
3,219,265
1,596,856
689,306
692,666
989,559
1,172,477
285,070
16.9
11.9
19.3
17.9
22.5
13.4
12.7
14.8
17.4
13.9
14.6
13.3
12.9
16.7
12.5
11.8
13.7
13.1
17.8
9.1
33.2
23.7
38.8
31.9
41.0
38.0
29.7
30.7
27.8
28.3
26.0
26.5
25.1
34.6
26.9
25.1
35.3
26.8
30.4
18.5
18.4
9.5
23.2
19.2
27.9
17.6
20.4
20.5
20.4
17.0
22.1
16.0
17.1
21.9
15.9
15.2
15.4
12.9
18.5
11.5
11.3
9.4
11.2
9.1
16.5
9.6
11.7
11.0
13.0
9.3
8.9
8.6
8.6
11.7
8.9
8.9
8.5
9.7
12.0
7.1
5.4
6.7
6.3
9.5
9.1
5.1
6.9
7.5
6.4
5.0
5.7
6.8
4.5
8.3
6.7
7.1
7.6
5.3
6.7
4.8
80.9
83.4
78.7
83.3
71.2
67.1
57.0
69.1
75.9
75.5
73.8
79.4
82.2
70.5
76.1
77.1
77.4
79.2
80.9
77.9
11.6
5.2
13.0
8.4
13.4
8.3
5.8
7.3
11.0
8.8
8.9
6.5
8.4
8.4
5.7
4.8
6.1
7.8
11.1
4.3
48
12
49
34
50
33
18
26
45
39
41
22
34
34
17
10
20
29
46
7
Prepared for the RWJF Commission to Build a Healthier America by the Center on Social Disparities in Health at the University of California, San Francisco.
Source: 2003 National Survey of Children’s Health.
1 Based on parental assessment and measured as poor, fair, good, very good or excellent.
2 Defined as the size of the improvement in the state’s overall rate if all children had the level of health experienced by children in higher-income families.
Gaps in Children’s General Health Status by Family Income:
How Do States Compare?
particularly marked shortfalls, but with few exceptions
even those in middle-income families appear less
healthy than those at the top. Comparing states based
on the size of the gaps
2
in children’s general health
status by income tells us that there is unrealized health
potential among children not just at the national level
but in every state as well.
Differences in children’s general health status
1
by
family income are similar at the state level to those
seen among children nationally. In almost every state,
children in higher-income families experience better
health than all other children in families with lower
incomes. Compared with children in higher-income
families, children in poor families experience
Number of Children,
Ages
<
–
17 years
Overall Rate of Less Than
Optimal Health
1
(%)
Poor
(<100% FPL)
Near Poor
(100% to 199% FPL)
Middle Income
(200% to 399% FPL)
Higher Income (
>
–
400% FPL) =
Overall Rate if Gap Were Eliminated
Percentage of Population That
Would be Affected if
Gap Were Eliminated
3
Size of Health Gap²
Ranking on Size
of
Health Gap
4
Percent of Children in Less Than Optimal Health by
Household Income (Percent of Federal Poverty Level)
23 America’s Health Starts With Healthy Children
Maryland
Massachusetts
Michigan
Minnesota
Mississippi
Missouri
Montana
Nebraska
Nevada
New Hampshire
New Jersey
New Mexico
New York
North Carolina
North Dakota
Ohio
Oklahoma
Oregon
Pennsylvania
Rhode Island
South Carolina
South Dakota
Tennessee
Texas
Utah
Vermont
Virginia
Washington
West Virginia
Wisconsin
Wyoming
United States
1,373,206
1,480,745
2,527,842
1,244,232
757,175
1,401,584
214,360
438,253
579,030
305,116
2,125,387
499,905
4,498,836
2,080,668
146,143
2,807,666
874,700
845,439
2,815,445
242,626
1,018,081
192,623
1,388,714
6,213,401
738,594
137,011
1,792,362
1,490,659
389,291
1,327,839
120,356
72,718,963
12.2
11.3
15.0
9.6
19.3
12.1
9.9
13.6
20.4
8.3
15.6
18.1
16.8
14.6
9.2
11.1
13.7
13.3
12.6
13.2
17.4
11.0
14.6
22.8
10.7
6.9
9.9
12.6
15.8
11.7
10.9
15.9
27.3
28.4
34.1
16.7
29.5
21.2
17.3
29.0
43.5
13.3
37.9
30.7
37.7
26.9
15.5
24.1
25.7
28.8
30.4
34.5
30.4
17.7
25.6
44.1
22.3
15.6
14.6
30.4
25.8
30.2
29.1
33.3
17.2
19.7
19.6
15.5
21.1
14.5
10.6
19.6
23.5
11.5
26.1
17.9
19.6
17.0
10.4
14.5
14.3
16.9
18.0
16.1
21.3
14.5
16.3
26.3
13.3
10.2
17.4
11.7
17.5
13.8
13.2
19.8
9.6
8.3
10.8
8.0
11.4
11.1
7.9
8.4
14.0
7.6
12.5
12.7
10.9
11.0
8.7
7.4
9.3
9.7
7.4
9.0
11.7
8.6
11.2
13.7
8.2
5.9
7.7
9.7
10.8
8.2
5.7
10.8
8.5
5.7
7.8
5.8
8.5
5.4
4.8
7.0
9.2
6.4
8.0
9.1
8.3
6.5
5.4
5.0
5.3
5.5
7.1
5.4
8.2
5.6
7.9
6.7
4.8
2.4
6.2
8.1
7.0
6.3
7.0
7.1
59.5
59.7
72.1
67.9
85.6
76.5
84.5
78.6
76.0
64.9
56.6
83.5
71.7
75.8
80.6
75.9
82.8
75.9
74.5
71.0
79.0
82.6
78.1
76.9
80.7
73.8
66.1
70.1
85.4
74.1
79.7
73.4
3.6
5.6
7.3
3.8
10.9
6.8
5.1
6.5
11.2
2.0
7.6
9.0
8.5
8.1
3.8
6.1
8.4
7.8
5.5
7.8
9.2
5.4
6.7
16.1
5.9
4.5
3.7
4.4
8.8
5.4
3.9
8.8
2
16
26
4
44
25
11
22
47
1
28
42
38
32
4
20
34
29
15
29
43
13
24
51
19
9
3
8
39
13
6
—
3 The percent of children who live in families with incomes below 400 percent of the Federal Poverty Level.
4 Ranked by size of gap, from smallest to largest; states with the same size gap were assigned the same ranking.
Number of Children,
Ages
<
–
17 years
Overall Rate of Less Than
Optimal Health
1
(%)
Poor
(<100% FPL)
Near Poor
(100% to 199% FPL)
Middle Income
(200% to 399% FPL)
Higher Income (
>
–
400% FPL) =
Overall Rate if Gap Were Eliminated
Percentage of Population That
Would be Affected if
Gap Were Eliminated
3
Size of Health Gap²
Ranking on Size
of
Health Gap
4
Percent of Children in Less Than Optimal Health by
Household Income (Percent of Federal Poverty Level)
Alabama
Alaska
Arizona
Arkansas
California
Colorado
Connecticut
Delaware
District of Columbia
Florida
Georgia
Hawaii
Idaho
Illinois
Indiana
Iowa
Kansas
Kentucky
Louisiana
Maine
1,102,924
188,133
1,512,175
678,604
9,378,237
1,147,831
832,105
198,401
107,436
3,907,632
2,287,060
295,749
370,187
3,219,265
1,596,856
689,306
692,666
989,559
1,172,477
285,070
16.9
11.9
19.3
17.9
22.5
13.4
12.7
14.8
17.4
13.9
14.6
13.3
12.9
16.7
12.5
11.8
13.7
13.1
17.8
9.1
33.2
23.7
38.8
31.9
41.0
38.0
29.7
30.7
27.8
28.3
26.0
26.5
25.1
34.6
26.9
25.1
35.3
26.8
30.4
18.5
18.4
9.5
23.2
19.2
27.9
17.6
20.4
20.5
20.4
17.0
22.1
16.0
17.1
21.9
15.9
15.2
15.4
12.9
18.5
11.5
11.3
9.4
11.2
9.1
16.5
9.6
11.7
11.0
13.0
9.3
8.9
8.6
8.6
11.7
8.9
8.9
8.5
9.7
12.0
7.1
5.4
6.7
6.3
9.5
9.1
5.1
6.9
7.5
6.4
5.0
5.7
6.8
4.5
8.3
6.7
7.1
7.6
5.3
6.7
4.8
80.9
83.4
78.7
83.3
71.2
67.1
57.0
69.1
75.9
75.5
73.8
79.4
82.2
70.5
76.1
77.1
77.4
79.2
80.9
77.9
11.6
5.2
13.0
8.4
13.4
8.3
5.8
7.3
11.0
8.8
8.9
6.5
8.4
8.4
5.7
4.8
6.1
7.8
11.1
4.3
48
12
49
34
50
33
18
26
45
39
41
22
34
34
17
10
20
29
46
7
Prepared for the RWJF Commission to Build a Healthier America by the Center on Social Disparities in Health at the University of California, San Francisco.
Source: 2003 National Survey of Children’s Health.
1 Based on parental assessment and measured as poor, fair, good, very good or excellent.
2 Defined as the size of the improvement in the state’s overall rate if all children had the level of health experienced by children in higher-income families.
Gaps in Children’s General Health Status by Family Income:
How Do States Compare?
particularly marked shortfalls, but with few exceptions
even those in middle-income families appear less
healthy than those at the top. Comparing states based
on the size of the gaps
2
in children’s general health
status by income tells us that there is unrealized health
potential among children not just at the national level
but in every state as well.
Differences in children’s general health status
1
by
family income are similar at the state level to those
seen among children nationally. In almost every state,
children in higher-income families experience better
health than all other children in families with lower
incomes. Compared with children in higher-income
families, children in poor families experience
Number of Children,
Ages
<
–
17 years
Overall Rate of Less Than
Optimal Health
1
(%)
Poor
(<100% FPL)
Near Poor
(100% to 199% FPL)
Middle Income
(200% to 399% FPL)
Higher Income (
>
–
400% FPL) =
Overall Rate if Gap Were Eliminated
Percentage of Population That
Would be Affected if
Gap Were Eliminated
3
Size of Health Gap²
Ranking on Size
of
Health Gap
4
Percent of Children in Less Than Optimal Health by
Household Income (Percent of Federal Poverty Level)