Tài liệu Báo cáo " Development of system of HydrodynamicEnvironmental models for coastal area (Case study in Quang Ninh - Hai Phong region) " doc
Bạn đang xem bản rút gọn của tài liệu. Xem và tải ngay bản đầy đủ của tài liệu tại đây (307.61 KB, 11 trang )
VNU JOURNAL OF SCIENCE, Earth sciences, T.xxIII, N
0
1, 2007
59
Development of system of Hydrodynamic-
Environmental models for coastal area
(Case study in Quang Ninh - Hai Phong region)
Dinh Van Uu, Ha Thanh Huong, Pham Hoang Lam
Marine Dynamics and Environment Centre (MDEC), VNU
ABSTRACT. The system of three-dimensional hydrodynamic-environmental models could
simulate full advection and dispersion processes of the dissolved and particulate matter as
suspended sediment and all oil phases in the realistic marine conditions. The hydrodynamic
model provides temperature, salinity and current structure and water level. These variables
will be used in the environmental model simulating the advection and diffusion processes for
suspended matter concentration, bottom sediment thickness and all oil spill phases in the
water and bottom sediment. This model includes two-dimensional (2D) sub-model for
surface oil slick, dissolved and particulate oil, the thickness change in the bottom sediment
layer and three-dimensional (3D) sub-model for the suspended matter, dissolved, emulsified
and particulate oil in the water column.
Preliminary results for the EDC, PCB transport in Ha Long Bay region, for surface oil spill in
the Hai Phong area show that the system of models could be used to simulate and predict
the spreading of the contaminant matter in the coastal and estuarine waters and to resolve
the problem of sediment transport and morphological change.
1. Introduction
The computation and forecasting of the displacement of the contaminant matters
and oil in the sea environment are very difficult due to the different phases of these
pollutants: oil slick at the surface, dissolved and suspended in water and bottom
sediment. The previous models for the contaminant matters and oil slick are built on
the basis of applying the semi-empirical formulas, developed in integration with the
marine dynamic models. In practice, the Euler approach is traditional in
hydrodynamics and the Lagrange approach is used in studying the contaminant
spreading trajectories.
In the future, the Euler approach will become more and more popular due to the
need to combine the dynamic equations of polluted substances transportation with the
thermal hydrodynamic model. The use of similar techniques as in thermo-
hydrodynamics allows us to enhance the modeling capability of water quality as well as
the precision of environmental studies in general. The integration of dynamic
principles and experimental data opens up a possibility of application of the model to
several marine environmental problems.
Based on the study of dynamic principles of interactions between oil phases and
environmental compound, we can build the dynamic model of oil compound as well as
the marine environment.
Dinh Van Uu, Ha Thanh Huong, Pham Hoang Lam
60
2. MDEC hydrodynamic model
The MDEC hydrodynamic model is a full three-dimensional thermo-hydrodynamic
model using system of primitive equations for water current
v
, temperature T, salinity
S and turbulent kinetic energy k with Boussinesq approximation and hydrostatic
approximation. The general description of this model is given by Dinh Van Uu (2003).
3. Model for suspended particulate matter transport and
bottom bathymetry evolution
The model for SPM and bottom bathymetry evolution includes 2 sub-models: 3D
SPM Model for water column and 2D model for bottom layer evolution. The description
of this model is given by Dinh Van Uu et al (2005, 2006), where the simulated variables
are SPM concentration (C) and bottom layer thickness (ζ).
4. Model for oil fate and transport
In this model, there is four oil phases in the marine environment: oil slick,
emulsion, particulate and dissolved oil. Among those, the oil slick only exists on the sea
surface and the remaining phases exist in the water column. In the sediment, there are
only two phases: the dissolved oil and particulate oil.
The physical, chemical and biological processes govern the transportation and
degradation of oil in the environment. It also depends on properties of the oil and
hydrodynamic, meteorological, and environmental conditions. These processes include:
advection, turbulent diffusion, spreading, evaporation, dissolution, emulsification,
hydrolysis, oxidation, biodegradation, and sedimentation.
When the oil begins spill over the sea, it spreads to make a thin oil slick. The
transportation of the oil slick depends mainly on the advection and turbulent diffusion
by the wind and currents. In this dispersion process, the oil slick also changes its form.
The lighter oils tend to evaporate, the dissolvable oils blend into water, the under-
water oils will be emulsified and transported as oil droplets. The emulsification or water-
in-oil process depends on turbulences and often appears a couple of days after the oil
spill. They tend to form several thin films and will be very sticky when transferred to the
shoreline. As time goes by these thin films will stick together to form a thick mousse.
The heavier oils can combine with the suspended sediment and go down to the bottom
and is biodegraded by the bacteria. The oil slick and particles have relatively small
contact area compare to their volume, therefore, their degradation process is quite slow.
The dynamics of the oil phases is established based on the principle of matter
transformation as well as the diffusion advection process and matter transformation process.
Development of system of hydrodynamic-environmental models for coastal area
61
In the static condition, the amount of oils on the sea is correlative to the
thickness of the oil slick. The change in the thickness of the oil slick is influenced by
three processes: evaporation, emulsification, dissolution into the under water. All these
processes will lead to the decrease of amount of oil and the thickness of the oil slick,
and there exists no reverse dynamical process.
This leads to a result: for the marine environment under the oil slick, there is an
incoming source of oils which exhibits in the corresponding increase.
At the same time, from the water environment there will be an exchange flux of
oils to the bottom sediment, the direction of this flux depends on the difference between
concentration of dissolved and particulate oils in the water (C
d
, C
p
) and in the bed
sediment (C
db
, C
pb
) respectively. The transformation of the oil phases mainly happens
in the water and in the bottom sediment.
All of the oils, water layer in the emulsion (water-in-oil or oil-in-water) and
dissolved oils have the tendency to transform into particulate due to the present of
suspended matters in water. This process depends on the difference in concentration of
the oil phases and concentration of the suspended matters S
w
, where the suspended
matters can have natural or artificial origin due to the use of oil dispersant substances.
Therefore, this transformation process is the same as a source for making particulate
oils in water.
A similar process can be applied to two main oil phases in the bottom sediment
which are particulate oils and dissolved oils. This means that certain amount of
dissolved oils will be transformed into particulate oils.
The natural condition of sea environment with the existence of dynamic
phenomena such as wave, current, advection, convection and dispersion will play a
crucial role to the transformation rules as well as the distribution displacement of oils
in the oil slick, water column, bottom and shoreline sediment.
Since the transformation, advection and diffusion of oils in each environment are
different, we need to build a system of models for each environment which is related to
each other through the boundary conditions. In this case, we can introduce the system
of models for oil slick, oil-in-water environment and bottom sediment.
Though there are many formulas, we can use the equation of thickness variation
of oil slick (h) based on the generalization of the diffusion advection process and the
exchange process between oil slick and air, and water through the evaporation of
lighter oils and the emulsification, as well as the dissolution of the heavier oils:
( )
( )
QhDvh
t
h
=∇∇−∇+
∂
∂
, (1)
Dinh Van Uu, Ha Thanh Huong, Pham Hoang Lam
62
where:
yx ∂
∂
+
∂
∂
=∇ .
This equation is constructed based on the principle of conservation of mass for
the moving oil slick (Benque et al, 1982; Fingas and Fieldhouse, 2004). Q is the loss
rate due to evaporation, emulsification and dissolution in water.
In Equation (1), the diffusion advection process only happen on the horizontal
direction and are described through operator ∇ . The velocity in the advection factor
consists of two components: general regular current and wind-driven current. The
wind-driven current can be computed according to the wind speed with the coefficient
approximately equal 3%. There are many ways to evaluate the horizontal diffusion
coefficient D, however, we choose the following (Cuesta et al., 1990):
(
)
ρf
ρρ-ρgh
D
oo
2
= ,
where f is the friction coefficient between oil slick and surface water.
Therefore, the model for thickness variation of the oil slick can be solved through
the impact of wind field and current on the sea surface.
This is a 2D model with the initial condition of the oil slick is given by the
thickness h. In addition to the boundary condition for the oil slick at the shoreline and
sea open boundaries, the model required the concentration of oil emulsion C
e
and oil
dissolution C
d
in the water layer which contacts with the oil slick. These are the
conditions associated to the model of oil in water environment.
For the whole water column, the 3D model of the marine environmental
components (Dinh Van Uu et al., 2005, 2006), which apply for three different oil phases
related to each other by the laws of dynamics and diffusion-advection:
( )
(
)
iiiii
i
QCDvC
t
C
=∇∇−∇+
∂
∂
, i = e,d,p (2)
where the velocity (
i
v
) consists of the current velocity (
c
v
) and the setting velocity (
i
w )
of the corresponding oil phases. D
i
is the diffusion coefficient of the oil phases in water
environment.
According to the law of dynamical transformation, the production and destruction
of each phase are specified by the corresponding function:
(
)
pewee
CCSQQ ,,= ,
(
)
pdwdd
CCSQQ ,,= ,
(
)
pdepp
CCCQQ ,,= .
So we obtain a set of equations for the oil models in the system of 3D thermo-
hydrodynamic environmental models MDEC which have been previously developed
and applied. To implement this model, it is important to deal with the boundary
conditions in the water environment.
Development of system of hydrodynamic-environmental models for coastal area
63
As explained above, on the interface between water and oil slick, the flux of
emulsion oil is going into water depends on the amount of present emulsion C
e
. The
flux of dissolved oil depends on the correlation between present concentration and
saturation of the lighter oil phase. For the interface between water and sediment, the
exchange oil flux depends on the difference between concentration of oils in sediment
and in the near-bottom water layer. This is also the relation between model of oils in
water environment and in the bottom sediment.
We assume that the bottom sediment layer that contains the oil phases is not
significant, so their concentration can be taken as the average value of the thickness of
the surface sediment. So we can build the model of oil in the sediment with the laws of
dynamical transformation mainly between dissolved oil and particulate oil. The
horizontal advection and diffusion process will play a key role, so this is a 2D model:
( )
( )
ibibib
b
i
b
i
ib
QCDvC
t
C
=∇∇−∇+
∂
∂
(3)
In this model, the velocity of the bed sediment can be specified through the bed
flux or dynamic velocity v
*b
.
The production and destruction rates get from the transformation and exchange
flux through the water-sediment interface.
So we obtain a system of three models for the oil slick, oil in water column and in
the bottom sediment environments. Since these models are related to each other through
the boundary conditions, we can solve independently when these conditions are given.
The MDEC hydrodynamic and SPM transport models will provide the
hydrodynamic factors, such as current, wave, water density, SPM concentration and
bottom stress for implementation of the oil transport model.
By combining all of these models, we can give an apprehensive solution to the oil
spreading problem in marine environment and create an environmental-ecological
model which can fulfill the forecasting, impact assessment and oil spill recovery task.
5. Preliminary results of application of the models in Quang
Ninh - Hai Phong region
It is well-known that the construction and development of 3D marine
hydrodynamic models allow to describe, in a quite accurate way, the current,
temperature, salinity fields and other environmental components as SPM concentration
for the whole water layer. So the system of models should be based on the 3D thermo-
hydrodynamical models for each particular environment that contains interested matter.
Dinh Van Uu, Ha Thanh Huong, Pham Hoang Lam
64
The marine thermo-hydrodynamical models can provide characteristics for the
2D model of oil slick on sea surface. The concentration of dissolved, particulate oils and
emulsion in water is the result of implementation of the 3D model for oils in the water
environment. The 2D model will be constructed and implemented in order to compute
horizontal distribution of oil in the bottom sediment and bottom layer thickness. The
oil and SPM fluxes exchanged among different environment (oil slick, water column
and bottom sediment) are the boundary conditions for each sub-model.
The system of MDEC models has been applied for simulating hydrodynamic,
suspended matter and environmental components included oil in Ha Long Bay and Hai
Phong estuarine area. For all of these regions, the simulated fields of water circulation
and water level show mostly well for as very complicated coastal and estuarine
condition as combined river- air-sea interaction.
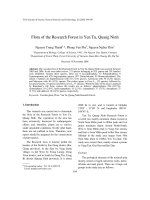
The simulated results of SPM transport sub-model for Ha Long Bay show that
the SPM concentration in water is generally higher in the area near the coast than that
is in the central and north - east region. The deposition of the SPM at the bottom is
more in the area near Ha Long, Bai Chay and Cat Ba coasts than it is in the central
area. The seasonal variation of SPM concentration and the sedimentation rate is
significant for the open sea area between Bai Chay and Cat Ba (Fig. 1a, 1c and 1b, 1d).
(a) (b)
0
.
0
2
5
0
0
.
0
2
5
0
0
.
0
1
0
0
0
.
0
0
5
0
0
.
0
0
0
5
0
.
0
1
0
0
0
.
0
0
5
0
B
a
i
c
h
a
y
C
a
t
b
a
H
a
l
o
n
g
0
.
0
0
0
5
0
0
.
0
0
0
2
5
0
.
0
0
0
1
0
0
.
0
0
0
0
1
0
.
0
0
0
0
5
0
.
0
0
0
0
1
0
.
0
0
0
2
5
0.00025
Baichay
Catba
Halong
(c) (d)
0
.
0
5
0
0
0
.
0
2
5
0
0
.
0
1
0
0
0
.
0
0
5
0
0
.
0
0
0
5
0.0750
Baichay
Catba
Halong
0
.
0
0
0
1
0
0
.
0
0
0
5
0
0
.
0
0
0
0
5
0
.
0
0
0
2
5
0
.
0
0
0
1
0
0
.
0
0
0
0
5
0
.
0
0
0
0
1
0
.
0
0
0
0
1
0
.
0
0
0
5
0
0
.
0
0
0
2
5
Baichay
Catba
Halong
Figure 1. Simulated SPM concentration (a, c) and bottom layer thickness (b, d)
after 12 days in Ha Long Bay area: a, b - SE wind, c, d - NE wind
Development of system of hydrodynamic-environmental models for coastal area
65
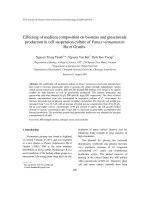
The field sampling results in September 2005 show that the distribution of EDC
(Phenol and 4-NP) concentration in the water (Fig. 2a) and in the sediment has the
same features as resulting from model simulation (Fig. 1a and 1b).
(a) (b)
0
50
100
150
200
250
300
1 2 3 4
Water
Sediment
0
50
100
150
200
250
1 2 3 4
Water
Sediment
Figure 2. Distribution of total Phenol (a) and 4-NP (b) concentration in water and sediment
for Bai Chay (1), Cat Ba North (2), Cat Ba East (3) and Hon Gai (4) coastal area during September 2005
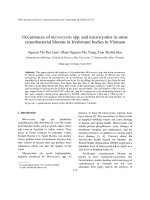
The recent sampling results in 2006 for Polyclobisphenyls (PCBs) in Ha Long Bay
area show significant seasonal variation of PCBs concentration in water and in
sediment (Figure 3a). Figure 3b shows that there is repartition of average PCBs
concentration in different regions.
(a) (b)
0
0.5
1
1.5
2
2.5
3
3.5
4
4.5
5
1 2 3 4
W-Win
W-Sum
S-Win
S-Sum
0
0.5
1
1.5
2
2.5
3
3.5
4
1 2 3 4
Water
Sedim ent
Figure 3. Seasonal (a) and average (b) PCB concentration in water (W) and sediment (S)
at Bai Chay (1), Centre (2), Cat Ba (3) and Hon Gai (4) area in 2006 (Win: Winter, Sum: Summer)
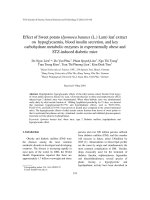
For the oil sub-model, the testing is carried out in Hai Phong estuary by using
parameters which originated in the work of Tkalich et al. (2003). The obtained results
for spreading oil slick show that the model has been successfully simulated in time and
shape of the oil spill as in the classical models as well as in reality (Cuesta et al., 1990).
Figure 4 shows the positions of the oil slick after 6 and 24 hours in the case of SE wind
for the source of oil spill in the area between Do Son and Cat Hai. In this case, the oil
slick is transformed into shape of an ellipse with centre in the oil slick origin.
In the case of NE wind, the oil slick is quickly approached Do Son - Hai Phong
shoreline, where there is strong nearshore current (Figure 5).
Dinh Van Uu, Ha Thanh Huong, Pham Hoang Lam
66
(a) (b)
0
.
0
0
0
0
5
0
.
0
0
0
0
1
0
.
0
0
0
5
0
Doson
Dinhvu
Cathai
Catba
Oil Slick S ource
0
.
0
0
0
5
0
0
.
0
0
0
1
0
0
.
0
0
0
0
5
0
.
0
0
0
0
5
Doson
Dinhvu
Cathai
Catba
Oil Slick Source
Figure 4. Distribution of the thickness of oil slick on sea surface after 6 (a) and 24 (b) hours in the SE wind
(a) (b)
0
.
0
0
0
0
5
0
.
0
0
0
0
1
0
.
0
0
0
5
0
Doson
Dinhvu
Cathai
Catba
Oil Slick Source
0
.
0
0
0
0
1
0
.
0
0
0
0
5
Doson
Dinhvu
Cathai
Catba
Oil Slick Source
Figure 5. Distribution of the thickness of oil slick on sea surface after 6 (a) and 24 (b) hours in the NE wind
For oil phases in the water environment, though concentrations of each component
are different, the distribution regions of them have similar shape and the result is the
gathering of oils in Cat Hai area and Bach Dang estuary. Figure 6 shows diagrams of
distribution of particulate concentration in water at depth of 0.5m and similarly for oil
slick in the SE wind field after 6 and 24 hours.
(a) (b)
0
.
0
0050
0
.
0
0
0
0
5
0
.
0
0
0
0
1
Doson
Dinhvu
Cathai
Catba
Oil Slick Source
0
.
0
0
0
0
1
0
.
0
0
0
5
0
0
.
0
0
0
0
5
0
.
0
0
0
0
5
Doson
Dinhvu
Cathai
Catba
Oil Slick Source
Figure 6. Distribution of particulate concentration in water (depth 0.5m)
after 6 (a) and 24 (b) hours in the SE direction wind
Development of system of hydrodynamic-environmental models for coastal area
67
In the case of NE wind, the oils also had tendency to approach Hai Phong - Do
Son shoreline and to extend the affected area in East-West direction (Figure 7).
(a) (b)
0
.
0
0
0
0
1
Doson
Dinhvu
Cathai
Catba
Oil Slick Source
0
.
0
0
0
0
1
0
.
0
0
0
1
0
0
.
0
0
0
1
5
0
.
0
0
0
2
0
Doson
Dinhvu
Cathai
Catba
Oil Slick Source
Figure 7. Distribution of particulate oil concentration in water (0.5m layer)
after 6 (a) and 24 (b) hours in the NE wind
The amount of particulate oil in the bottom sediment increases as time goes by
and the position has relatively small variation compare to oils in water and oil slick
(Figure 8).
(a) (b)
0
.
0
1
0
0
0
0
.
0
0
1
0
0
0
.
0
0
0
1
0
0
.
0
0
0
1
0
Doson
Dinhvu
Cathai
Catba
Oil S lick Source
0
.
0
0
0
1
0
0
.
0
0
1
0
0
0
.
0
1
0
0
0
0
.
1
0
0
0
0
0
.
0
0
0
1
0
0
.
0
0
1
0
0
0
.
0
1
0
0
0
Doson
Dinhvu
Cathai
Catba
Oil S lick Source
Figure 8. Distribution of particulate oil concentration in sediment
after 6 (a) and 24 (b) hours in the NE wind
6. Conclusion
The preliminary results for the combined system of 2D, 3D hydrodynamic-
environmental models for SPM and bottom layer change show the ability to forecast
the fate and transport of contaminants and sediment, and the impact to the sea and
nearshore environment. By making more comprehensive tests for several oil spill cases,
this system of models can be developed and applied, together with the recovery
strategies, for the case of oil pollution sources in water or seabed. This system of models
also allow to integrate with models of ecological components and water quality, therefore
open up the application in monitoring and forecasting coastal and marine environment.
Dinh Van Uu, Ha Thanh Huong, Pham Hoang Lam
68
Acknowledgment: This research is a part of Fundamental Research Program,
Project code 706106, which is carried out at the Marine Dynamics and Environment Center.
References
[1] Benque, J-P., Hanguel, A., Viollet, P. (1982), Engineering application of computational
hydraulics, II, Pitman Advanced Publishing Program, London, pp. 57-66.
[2] Cuesta, F.X., Grau and Francesc Giralt (1990), Numerical simulation of oil spills in a
generalized domain, Oil and Chemical Pollution, No 7, pp. 143-159.
[3] Fingas, M., Fieldhouse, B. (2004), Formation of water-in-oil emulsions and application
to oil spill modeling, Journal of Hazardous Materials, No 107, pp. 37-50.
[4] Tkalich P., Huda, MD.K., Gin, K.Y.H. (2003), A multiphase oil spill model, Journal of
Hydraulic Research, Vol. 41, No 2, pp. 115-125.
[5] US EPA, (1999), Understanding oil spills and oil spill response, PB 2000-963401.
[6] Dinh Van Uu (2003), Preliminary results of development and application of the three-
dimensional (3D) thermo-hydrodynamic model for coastal and shallow water seas, VNU
Journal of Science, Natural Sciences and Technology, T. XIX, No 1/2003, pp. 108-113 (in
Vietnamese).
[7] Dinh Van Uu et al. (2005), Application of the 3D water circulation model for studying
SPM transport processes in Quang Ninh coastal area. Proceedings of National Scientific
Conference on Fluid Mechanics, Hanoi, pp. 623-632 (in Vietnamese).
[8] Dinh Van Uu et al. (2006), Development and application of the marine environmental
monitoring an prediction modeling system. VNU Journal of Science, Natural Sciences
and Technology, T. XXII, No 2B AP-2006, pp. 195-206 (in Vietnamese).
VNU JOURNAL OF SCIENCE, Earth sciences, T.xxIII, N
0
1, 2007
59