Tài liệu ITU Study on the Financial Aspects of Network Security: Malware and Spam doc
Bạn đang xem bản rút gọn của tài liệu. Xem và tải ngay bản đầy đủ của tài liệu tại đây (650.4 KB, 42 trang )
ITU Study on the Financial Aspects of
Network Security:
Malware and Spam
ICT Applications and Cybersecurity Division
Policies and Strategies Department
ITU Telecommunication Development Sector
Final Report July 2008
Acknowledgements
This paper has been produced by Johannes M. Bauer, Quello Center for Telecommunication Management and Law Michigan
State University, East Lansing, Michigan, USA, Michel J. G. van Eeten, School of Technology, Policy and Management Delft
University of Technology, Delft, The Netherlands and Tithi Chattopadhyay, Yuehua Wu, Quello Center for Telecommunication
Management and Law Michigan State University, East Lansing, Michigan, USA
The authors wish to thank Jennifer Defore for editorial support. Comments by Robert Shaw, Suresh Ramasubramanian, and
participants at the ITU Cybersecurity Forum in Brisbane are gratefully acknowledged. Their feedback made this a much more
coherent and readable report
This ITU Study on the Financial Aspects of Network Security: Malware and Spam is available online at:
www.itu.int/ITU-D/cyb/cybersecurity/docs/itu-study-financial-aspects-of-malware-and-spam.pdf
This document is formatted for printing recto-verso. This document has been issued without formal editing.
For further information and to make comments on this document, please contact:
ICT Applications and Cybersecurity Division (CYB)
Policies and Strategies Department
Telecommunication Development Bureau
International Telecommunication Union
Place des Nations
1211 Geneva 20, Switzerland
Telephone: +41 22 730 5825/6052
Fax: +41 22 730 5484
E-mail:
Website: www.itu.int/ITU-D/cyb/
Disclaimer
The opinions expressed in this report are those of the author(s) and do not necessarily represent the views of the International
Telecommunication Union (ITU) or its membership. The designations employed and the presentation of material, including
maps, do not imply the expression of any opinion whatsoever on the part of ITU concerning the legal status of any country,
territory, city or area, or concerning the delimitations of its frontiers or boundaries. The mention of specific companies or of
certain products does not imply that they are endorsed or recommended by ITU in preference to others of a similar nature that
are not mentioned.
© ITU 2008
3 Please consider the environment before printing this report.
TABLE OF CONTENT
EXECUTIVESUMMARY I
1. I
NTRODUCTION 1
2. T
HEPROBLEMOFMALWARE 2
2.1. F
UNCTIONINGOFMALWARE 3
2.2. F
RAUDULENTANDCRIMINALUSES 3
2.3. F
ACTORSAGGRAVATINGTHEDISSEMINATIONOFMALWARE 5
3. B
USINESSMODELSRELATEDTOMALWARE 7
3.1. D
IVISIONOFLABOR 8
3.2. T
HEROLEOFBOTNETS 9
3.3. T
HEGEOGRAPHYOFMALWAREANDSPAM 10
4. A
CONCEPTUALFRAMEWORKFORMODELINGFINANCIALASPECTSOFMALWAREANDSPAM 12
5. F
INANCIALANDOPERATIONALEFFECTSOFMALWARE 14
5.1. D
IRECTANDINDIRECTCOSTSOFMALWARE 14
C
OSTSATANAGGREGATELEVEL 14
C
OSTSFORBUSINESSES 15
C
OSTSTOCONSUMERS 17
5.2. I
LLEGALREVENUESASSOCIATEDWITHMALWARE 17
5.3. O
PERATIONALEFFECTSONCYBERINFRASTRUCTURE 18
6. F
INANCIALANDOPERATIONALEFFECTSOFSPAM 20
6.1. D
IRECTANDINDIRECTCOSTSOFSPAM 20
E
FFECTSONBUSINESSES 20
E
FFECTSONINDIVIDUALS 23
6.2. O
PERATIONALASPECTSOFSPAM 26
P
ROVIDINGEMAILSERVICESTOSENDSPAM 26
P
ROVIDINGNETWORKBANDWIDTHTOCARRYSPAMANDMALWARE 28
F
IGHTINGSPAM 29
7. W
ELFAREEFFECTS:APRELIMINARYASSESSMENT 31
7.1. C
ORRECTLYIDENTIFYINGWELFAREEFFECTS 31
7.2. E
XTERNALITIESANDWELFARE 32
7.3. C
ONCLUDINGOBSERVATIONS:APATCHWORKOFNUMBERS 33
Table of figures
FIGURE1.VISIBILITYOFMALWAREVS.MALICIOUSINTENT 7
FIGURE2DIVISIONOFLABORINTHEMALWAREUNDERGROUNDECONOMYVISIBILITYOFMALWAREVS.MALICIOUSINTENT 8
FIGURE3LEGALANDPOTENTIALLYILLEGALFINANCIALFLOWSRELATEDTOMALWARE 12
FIGURE4AVERAGEREPORTEDLOSSESINCSISURVEYS1999‐2007($000) 15
FIGURE5THREATSTOCYBERINFRASTRUCTURE 19
FIGURE6PRIMARYATTACKTARGETS 19
FIGURE7SPAMRATES2005‐2007 21
FIGURE8SPAMANDVIRUSINTERCEPTIONBYBUSINESSSIZE 23
FIGURE9DISTRIBUTIONOFADSFORGOODSINLABELEDDATA43 24
FIGURE10EXTRAPOLATEDNUMBEROFADSFORCOMPROMISEDHOS TS 27
FIGURE11DISTRIBUTIONOFADSFORGOODSINLABELEDDATA43 28
FIGURE12SUSTAINEDATTACKSIZEINGBPS 29
FIGURE13ATTACKDETECTIONTECHNIQUES 30
Tables
TABLE1SUMMARYOFFRAUDCASESFILEDBYCIFAS 25
TABLE2FINANCIALBENEFITSORLOSSESAVOIDEDBEPREVIOUSWARNINGS 25
TABLE3FINANCIALEFFECTSOFMALWAREANDSPAM 35
ITU Study on the Financial Aspects of Network Security:
Malware and Spam
i
EXECUTIVE SUMMARY
Measures to improve information security enhance trust in online activities and contribute directly and
indirectly to the welfare gains associated with the use of information and communication technologies
(ICTs). However, some expenditure on security is only necessary because of relentless attacks by
fraudsters and cybercriminals that undermine and threaten trust in online transactions. Such costs are
not welfare-enhancing but a burden on society. Two vectors through which such attacks are carried
out are malware and spam.
Malware is a summary term for different forms of malevolent software designed to infiltrate and infect
computers, typically without the knowledge of the owner. During the past two decades, the production
and dissemination of malware has grown into a multibillion dollar business. Damages created by
fraudulent and criminal activities using malware and the costs of preventative measures are likely to
exceed that number significantly. Malware puts the private and the public sector at risk because both
increasingly rely on the value net of information services.
Until a few years ago, the most common types of malware were viruses and worms. More recently,
other kinds have appeared and are widely distributed, including trojan horses, backdoors, keystroke
loggers, rootkits, and spyware. Whereas spam and malware were hitherto relatively separable
problems they are presently converging with the emergence of botnets. These networks of remote-
controlled malware-infected computers are the origin of the majority of spam messages but they are
also sustained and extended through spam.
Spam and malware have multifaceted financial implications on the costs and the revenues of
participants in the ICT value chain. Costs of all stakeholders across the value network of information
services, such as software vendors, network operators, Internet Service Providers (ISPs), and users, are
affected directly and indirectly. Cost impacts may include, but are not limited to, the costs of
preventative measures, the costs of remediation, the costs of bandwidth and equipment, and the
opportunity costs of congestion.
Activities associated with spam and malware also generate various revenue streams. Fraudulent and
possibly criminal revenues include the renting out of botnets, bullet proof hosting services,
commissions on spam-induced sales, and stock price manipulation schemes. At the same time, spam
and malware provide legal business opportunities including anti-virus and anti-spam products,
investment to improve the resilience of infrastructure, and bandwidth. Because of this broad range of
financial implications, spam and malware create mixed and sometimes conflicting incentives for
stakeholders. Consequently, coherent responses to the problem are complicated.
During the past few years, the generation, distribution, and use of malware have increasingly become
organized as illegal business activities. Participants in the underground malware economy will pursue
their activities as long as the benefits of semi-legal and illegal activities outweigh the costs of these
activities, including the expected costs of sanctions. Due to the factors discussed in this report, the
economic incentives to expand cybercriminal activity continue to be strong.
Malware and spam are associated with a web of financial flows between the main groups of
stakeholders in the information and communication value net. The development of accurate measures
of these flows is complicated by the large number of legal and illegal players and the elusive nature of
some of the transactions. Most of the financial flows between the legal and illegal players in the
underground cybercrime economy, for example, are not or only partially known.
This report develops a framework within which these financial impacts can be assessed and brings
together the many disparate sources of financial data on malware and spam. The following points
summarize key findings:
Financial aspects of network security:
Malware and Spam
ii
• Estimates of the financial effects of malware differ widely. Figures for overall effects range from
US$ 13.2 billion of direct damages for the global economy (in 2006) to US$ 67.2 billion in direct
and indirect effects on U.S. businesses alone (in 2005).
• In a survey of its members, the Computer Security Institute (CSI) estimated the loss caused by
cybersecurity breaches per responding firm to US$ 345,000 in 2006. This number is most likely
not representative for businesses in general due to the unique membership of CSI. The 2006
number is considerably lower than its peak in 2001 but more than double the 2005 level.
• Consumer Reports estimated the direct costs to U.S. consumers of damages experienced due to
malware and spam to US$ 7.1 billion in 2007.
• One estimate put the global cost of spam in 2007 at US$ 100 billion and the respective cost for the
U.S. at US$ 35 billion. Another study found that the cost of spam management in the U.S. alone
amounted to US$ 71 billion in 2007.
• In 2007, the costs of click fraud in the U.S. were estimated to be nearly US$ 1 billion.
• Numbers documenting the magnitude of the underground Internet economy and transactions
between it and the formal economy also vary widely. One source estimates the worldwide
underground economy at US$ 105 billion.
• No reliable numbers exist as to the potential opportunity costs to society at large due to reduced
trust and the associated slower acceptance of productivity-enhancing IT applications. However, a
considerable share of users expressed concern and indicated that it reduces their willingness to
perform online transactions.
Although the financial aspects of malware and spam are increasingly documented, serious gaps and
inconsistencies exist in the available information. This sketchy information base also complicates
finding meaningful and effective responses. For this reason, more systematic efforts to gather more
reliable information would be highly desirable.
ITU Study on the Financial Aspects of Network Security:
Malware and Spam
www.itu.int/ITU-D/cyb/cybersecurity/docs/itu-study-financial-aspects-of-malware-and-spam.pdf
1
1. INTRODUCTION
Measures to increase information security enhance trust in online activities, contributing
directly and indirectly to the welfare gains associated with the more intense use of
information and communication technologies (ICTs). As trust probably benefits society at
large, efforts to increase information security may generate positive externalities, spill-overs
that not only benefit the investor in security but a sector or even the economy as a whole. An
optimal level of security is reached when the direct and indirect benefits of additional security
approximate the additional costs of security. Because security is costly, it is rational to
tolerate a certain level of insecurity. The cost of security is, however, greatly increased for all
stakeholders because of relentless assault by fraudsters and cybercriminals. Two forms of
attack that are gaining notoriety are malware and spam. Their financial effects are the focus
of this report.
Malware is a summary term for different forms of malevolent software that are designed to
infiltrate and infect computers, typically without the knowledge of the owner. During the past
two decades, the production and dissemination of malware grew into a multibillion dollar
business. As the discussion in sections 5 and 6 below illustrates, the direct and indirect costs
of fraudulent and criminal activities using malware likely exceed that number significantly.
Malware puts both the private and the public sectors at risk because both increasingly rely on
the value net of information services. All stakeholders across the value network of
information services, such as software vendors, network operators, Internet Service Providers
(ISPs), and users, are affected by malware and spam. A response to malware and spam is
complicated by the fact that spam and malware not only cause costs but also generate new
business opportunities and revenue streams. Cost impacts include, but are not limited to, the
costs of preventative measures, direct and indirect damages, the costs of remediation,
infrastructure costs, and the opportunity costs of congestion. Business opportunities
associated with malware and spam include anti-virus and anti-spam products, new and
enhanced security services, and additional infrastructure investment in equipment and
bandwidth.
Malware has also spawned operations in a legally gray zone in which a legal and illegal
economy overlap. Such semi-legal activities include spam-induced sales, bullet-proof
Internet hosting, or pump and dump stock schemes. Moreover, malware is generated in and
fuels a sizeable underground economy. Such illegal activities include the herding and renting
out of botnets, different forms of fraud, and cybercrime. Some of the revenues generated in
this underground economy are laundered and injected in the legal economy. This mesh of
legal, semi-legal and illegal activities creates mixed and even conflicting incentives for
individual stakeholders. Furthermore, it complicates coherent policy responses to the
problem.
Until recently, spam and malware could be considered as two separate problems. However,
due to the emergence and growth of botnets they are increasingly overlapping and
converging. Botnets are networks of malware-infected computers. They are both the origin
of the majority of spam messages but are also sustained and extended through spam.
1
Whereas it is fairly safe to claim that malware and spam have negative effects on the ICT
value net in the aggregate individual stakeholders are not affected equally and not all are
impeded by malware.
1
See and FTC, Spam Summit: The Next
Generation of Threats, Washington, D.C.: Federal Trade Commission, November 2007.
2 ITU Study on the Financial Aspects of Network Security:
Malware and Spam
www.itu.int/ITU-D/cyb/cybersecurity/docs/itu-study-financial-aspects-of-malware-and-spam.pdf
For example, security service providers create business activities from malware. Financial
service providers have to weigh the benefits of enhanced security against the potential
negative effects on online banking and the efficiency gains associated with it. As they
experience costs and benefits differently, stakeholder will adopt a range of responses to the
threats depending on their perceived individual costs and benefits but not necessarily based on
social costs and benefits. As long as these different responses contribute to improvements
overall, they are not problematic. However, if they are at cross purposes, they may aggravate
the problems caused by malware. Recent studies of stakeholder incentives and the economics
of security showed many instances in which the public interest and individual responses were
aligned but also others where they were not.
2
Reliable empirical information on the operational and financial aspects of malware and spam
is difficult to come by. Many of the available estimates of attack trends and damages are
provided by security service providers. While certainly useful, indeed these are often the only
available figures, they need to be considered within this context as security service providers
may have incentives to over- rather than underestimate security problems. Other information
is considered proprietary or only reported if the damage exceeds a certain threshold. The
purpose of this study is to sort through the available data and to document the state of
knowledge on the financial effects of malware and spam. Where financial information is not
available, we attempted to provide operational data if they allowed a provisional glance at the
magnitude of a problem.
Given resource and time constraints, the study could not collect original data but had to focus
on existing sources, pulling together scattered and scarce information resources. This report
also develops an analytical framework, synthesizes, and where possible integrates,
fragmented existing knowledge. We also point to gaps in the data that ideally would be filled
in future efforts to support the design of better counter-measures against spam and malware.
The next section briefly discusses the problem of malware and the subsequent one gives a
short overview of fraudulent and criminal business activities. Section four reviews the
available empirical evidence on the financial effects of malware and section five the
information base regarding spam. The concluding section is a first attempt at an overall
assessment of the welfare effects of spam and malware.
2. THE PROBLEM OF MALWARE
Until a few years ago, the most common types of malware were viruses and worms. More
recently other types appeared and are widely distributed, including trojan horses, backdoors,
keystroke loggers, rootkits, and spyware. These terms correspond to the functionality and
behavior of the malware. For instance, a virus is self-propagating and a worm is self-
replicating. Malware is often categorized into “families” (referring to a particular type of
malware with unique characteristics) and “variants” (usually a different version of code in a
2
See M. J. G. van Eeten, J. M. Bauer with contributions by M. de Bruijne, J. P. Groenewegen, and W.
Lemstra, Economics of Malware: Security Decisions, Incentives, and Externalities, , OECD STI Working
Paper 2008/1 JT03246705, Paris, OECD, 2008, available online at
/>. See also R. Anderson, R. Böhme, R. Clayton, and
T. Moore, Security Economics and the Internal Market, Study for the European Network and Security
Information Agency (ENISA), March 2008, available at
/>.
ITU Study on the Financial Aspects of Network Security:
Malware and Spam
www.itu.int/ITU-D/cyb/cybersecurity/docs/itu-study-financial-aspects-of-malware-and-spam.pdf
3
particular family). Malware is put in an information system
3
to cause harm to that system or
other systems, or to subvert them for use other than that intended by their owners.
2.1. Functioning of Malware
There are two principal ways by which malware can be inserted into information systems to
carry out the malicious player’s goal. One option is an automated installation and the other is
manual installation. Malware compromises the system and may download additional payload
code to expand or update its functionality. Once installed, new features and capabilities are
therefore easily added.
4
Malware can be used to distribute spam and to support criminal activities including those
based on spam. It can be used to infect systems to gain remote access for the purpose of
sending data from that system to a third party without the owner’s permission or knowledge.
Malware can be instructed to hide that the information system has been compromised, to
disable security measures, to damage the information system, or to otherwise affect the data
and system integrity. Sometimes it uses encryption to avoid detection or conceal its means of
operation.
Acquiring malware is relatively easy and affordable, thus making it available to a wide a
variety of attackers. A flourishing underground economy exists for its sale and distribution.
Furthermore, current generations of malware are easier to tailor to specific purposes and
provide attackers with the capability to launch sophisticated attacks beyond their
programming skill level. At the same time, the latest generation of malware is increasingly
difficult to detect and remove. Variants of it are effective at defeating built-in information
security counter-measures. For example, some forms of malware can circumvent strong
forms of multi-factor authentication and others have been able to undermine the effectiveness
of digital certificates.
Malware not only affects personal computers but also servers. In 2007, Google estimated that
one in 10 web pages might serve malware to unsuspecting visitors.
5
Furthermore, experts
predict that malware will increasingly target mobile phones, personal digital assistants
(PDAs) and a wide range of other intelligent devices.
2.2. Fraudulent and criminal uses
Early generations of viruses and malware were written and distributed by hackers who sought
to enhance their “fame and glory.” During the past few years, considerable evidence points to
the fact that the generation, distribution and use of malware is driven predominantly by
economic interests.
6
Actors in the underground malware economy will continue to pursue
3
“Information systems” is a generic term referring to computers, communication facilities, computer and
communication networks, and data and information that may be stored, processed, retrieved or
transmitted by them, including programs, specification and procedures for their operation, use and
maintenance. See OECD, Guidelines for the Security of Information Systems and Networks, Paris
1992.
4
D. Danchev, “Malware–Future Trends,” January 31, 2006, p. 3, online at
/>.
5
See
6
See Symantec Internet Security Threat Report, September 2007 available at
/>; M. Schipka, “The Online Shadow
Economy: A Billon Dollar Market for Malware Authors,” White Paper, MessageLabs, 2007; ITU, Botnet
4 ITU Study on the Financial Aspects of Network Security:
Malware and Spam
www.itu.int/ITU-D/cyb/cybersecurity/docs/itu-study-financial-aspects-of-malware-and-spam.pdf
these activities, as long as benefits from semi-legal and illegal activities outweigh the costs of
these activities, including the expected costs of sanctions. Due to the relatively low cost of
launching fraudulent or criminal activities in cyberspace and the high potential gains, the
economic incentives to expand cyber criminal activity continue to be strong.
Malware, together with other cyber tools and techniques, provides a low cost, reusable
method of conducting cybercrime, much of it launched using unsolicited email messages. The
majority of spam originates from botnets. According to net security firm Marshal 85 percent
of botnet-originated spam comes from only six botnets, with two botnets (Srzibi and Rustock)
accounting for more than 60 percent of all spam launched this way.
7
Malware and spam can
be categorized in various ways, for example, by target (business or private individuals), by
method, and even by degree of legality (not all spam is per se illegal). A range of methods
can be used to reach different objectives. Forms of attacks on businesses include denying
access to critical information systems, conducting espionage, and extorting money (e.g.,
ransom). A main attack vector for individuals is the stealing information (e.g., identity theft)
but forms of extortion are also in use. The tools with which these goals are pursued include
Distributed Denial of Service (DDoS) attacks, click fraud, phishing, and many more.
Not all unsolicited email is necessarily illegal and/or unwanted by the recipient. Different
people have diverging views as to which information constitutes advertising as opposed to
unwanted information. Consequently, a precise definition of “spam” is impossible. Due to its
low cost, e-marketers will use email to advertise their products and services as long as a
sufficiently large share of recipients responds with purchases.
8
Spam has thus been defined as
“information pollution,” the “waste product of senders trying to reach those few recipients
who actually want what they [the e-marketers] are offering.”
9
The glut of information
generated by mass e-mail campaigns could therefore be seen as the result of a lack of
information about senders and recipients.
10
In contrast, “malicious spam” (or just “spam”) is
sent with explicit fraudulent or criminal intent. This differentiation is, for example, reflected
in the U.S. CAN-SPAM Act of 2003, which defines the characteristics of illegal activities but
continues to allow certain forms of electronic marketing.
11
Stealing financial and other personal information has been another prime goal of malware.
Over the past five years, information theft (and in particular online ID theft) has been an
increasing concern to business, governments, and individuals. Keyloggers and trojans are
used to collect personal information directly from infected machines. Botnets are used to host
phishing campaigns often using forms of social engineering to trick users into revealing
personal information.
Malware has also been implicated in click fraud, a technique relying on infected machines to
generate clicks on online advertisements. Online advertisers, such as Google AdSense,
Mitigation Tool Kit, November 2007; and R. Anderson, R. Böhme, R. Clayton and T. Moore,.Security
Economics, supra note 2.
7
See J. Leyden, “ Most Spam Comes from Only Six Botnets”, available at
/>; see also Panda Security, Annual Report
2007, available at
8
M. Mangalindan, "Spam Queen: For Bulk E-mailer, Pestering Millions Offers Path to Profit", Wall Street
Journal, November 13, 2002, p. A1, argued that even response rates of 0.001 percent (that is, 1 in
100,000) could generate profits.
9
M. W. Van Alstyne, “Curing Spam: Rights, Signals & Screens,” The Economists' Voice: Vol. 4: Issue 2,
Article 4. Available at />.
10
Ibid.
11
See U.S. Congress, Controlling the Assault of Non-Solicited Pornography and Marketing Act of 2003
(CAN-SPAM Act of 2003), Public Law 108–187.
ITU Study on the Financial Aspects of Network Security:
Malware and Spam
www.itu.int/ITU-D/cyb/cybersecurity/docs/itu-study-financial-aspects-of-malware-and-spam.pdf
5
sometimes pay the owners of websites that host their ads for every instance someone clicks on
an ad.
12
Attackers can strike a deal with the hosting website to instruct the bots in the botnet to
automatically click on the advertisements, generating false “hits.” This process can be further
enhanced if the botnet hijacks the default web page of compromised end-user machines so
that the “clicks” are executed each time the victim loads the browser.
Extortion, another form of abuse, is often based on the threat of launching a Distributed
Denial of Service (DDoS) attack against a website. Popular targets include online gambling
and e-commerce sites. A variant compromises the victim’s machine and then denies the
victim access to his or her own digital data, resources or other services. To be able to
unscramble his/her encrypted data, the user must pay a ransom. Businesses may run into
substantial financial losses if their revenue-generating opportunities are affected or even come
to a standstill, whether they give in to the extortion or not. Sometimes these attacks are
employed by competing firms with the intent of sabotaging the other firm’s business
operations.
13
Several high profile cases in 2006 brought this kind of extortion to the limelight,
even though it may be less frequently used as others forms of malware.
14
A rising use for malware is espionage in which malicious code is used to intercept crucial
information about a country’s citizens, business or critical infrastructures, threatening the
security of individual organizations or even of a whole nation.
15
The United Kingdom
recently reported an attack on its public and private critical information infrastructure by
trojans.
16
2.3. Factors aggravating the dissemination of malware
The potential versatility and sophistication of malware render it a potent tool. This is further
enhanced by several developments in the information and communication value net.
Particularly important are the growing number of Internet users, the declining costs of storage
and email access, widespread availability of malware tools, and a growing gap between the
sophistication of systems and applications and end user awareness. The increased reliance on
ICT, the advent of broadband, and technology vulnerability all magnify the problem.
As both the public and the private sector adopt increased use of ICT, the opportunities to
attack information systems multiply. The OECD, in 2004, found that 100 percent of the large
scale businesses in member countries were conducting transactions online.
17
Medium sized
firms are also following that strategy.
18
Individuals as well are conducting an increasing range
of activities online. People shop, bank, file taxes, and access information for work, and social
networking online. The growth of online consumers and sellers provides cyber criminals with
a larger victim base and, other things equal, reduces the probability of identification.
12
Online advertisers use a range of compensation models. Clickfraud is only possible if a payment is
dependent on the number of clicks. If the advertising website is only paid if an actual transaction takes
place, clickfraud is less of a problem.
13
See D. Pappalardo and E. Messmer, “Extortion via DDoS on the Rise: Criminals are Using the
Attacks to Extort Money from Victimized Companies”, Network World, May 15, 2005, available at
14
See SOPHOS, 2007 Security Threat Report; page 8; available online at
/>.
15
See D. Goodin, “Pentagon Attackers stole 'Amazing Amount' of Sensitive Data,” March 6, 2008, available at
/>.
16
See “Targeted Trojan Email Attacks”; NISCC Briefing Issued 16 June 2005 (Centre for the Protection
of the National Infrastructure); />.
17
OECD Science, Technology and Industry Scoreboard 2005: Toward a Knowledge-based Economy,
available at />.
18
Ibid.
6 ITU Study on the Financial Aspects of Network Security:
Malware and Spam
www.itu.int/ITU-D/cyb/cybersecurity/docs/itu-study-financial-aspects-of-malware-and-spam.pdf
The availability of increasingly sophisticated applications and a global migration to
broadband connectivity contribute to problems generated by malware. With the expansion of
broadband access, more customers are taking advantage of always-on connectivity, use
wireless hotspots at home or while traveling, and use more and more diverse devices to
connect to the Internet. The multiplicity of devices, network configurations, and applications
offers new attack vectors for malware to reach a target. In 2007, the ITU quantified the global
number of internet users as nearly 1.5 billion. Of this total, nearly 340 million, slightly less
than a quarter, used broadband connections.
19
The large number of users helps attackers carry
out assaults as they can compromise more computers to, for example, send massive amounts
of spam and conduct DDoS attacks. More widespread availability of wireless broadband
access allows attackers to use connectivity in public places, further complicating finding these
criminals.
A last point that deserves mentioning is technological vulnerabilities. Different and newer
types of software and hardware also bring along complexity and associated vulnerabilities that
can be exploited by attackers. These effects are sometimes exacerbated by user ignorance as
well as a lack of incentives to reveal these vulnerabilities and update software. Microsoft, for
example, reported an increase of nearly 2,000 disclosed vulnerabilities from 2005 to 2006.
20
At the same time, the firm reported an increase in the number of disinfected machines from
less than 4 million at the beginning of 2005 to more than 10 million at the end of 2006 (aided
by a malware removal tool introduced by the firm).
21
Similarly, the security service provider
Symantec
22
reported a 12 percent rise in the number of known vulnerabilities from the first
half of 2006 (January–June) to the second half (June–December) which the firms suspects is
primarily caused by the increase in broadband connectivity.
19
See International Telecommunication Union (ITU), ITU ICT EYE,
20
See Microsoft Security Intelligence Report; July–December 2006; pg. 8; available online at
/>e35dc3f26cfe&displaylang=en (last accessed December 3, 2007).
21
Ibid., p. 20-21.
22
Symantec Corporation has over 40,000 sensors monitoring network activity in over 180 countries
around the world. See Symantec Internet Security Threat Report, Volume XI at 38; available at
/>whitepaper_internet_security_threat_report_xi_03_2007.en-us.pdf.
ITU Study on the Financial Aspects of Network Security:
Malware and Spam
www.itu.int/ITU-D/cyb/cybersecurity/docs/itu-study-financial-aspects-of-malware-and-spam.pdf
7
3. BUSINESS MODELS RELATED TO MALWARE
A diverse cast of actors with widely differing motives populate the malware economy. Main
groups are (1) innovators seeking to find security problems to improve the working of
information systems; (2) amateurs seeking fame and notoriety without malicious intent; (3)
copy catters who usually only replicate simple attacks but often with malicious goals, (4)
insiders, usually employees with experience at a particular work place that breach security,
and (5) a range of actors in the realm of organized crime.
23
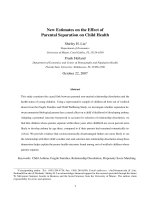
Figure 1 illustrates the evolution
of malware in terms of motives from fame seeking but relatively harmless “techies” to
criminals motivated by financial gain.
Figure 1. Visibility of malware vs. malicious intent
Source: www.govcert.nl
Malware-based crimes are steadily becoming cross-national or even global in nature, making
it very difficult to find the perpetrators. Even if a criminal can be identified, differences in
national laws and weaknesses in cross-border cooperation can make prosecution daunting.
This has obfuscated our understanding of the underlying motives and demographic profiles of
the individuals and groups involved. Consequently, the design of effective countermeasures
is greatly complicated.
The malware market and associated activities have expanded and differentiated beyond
smaller groups so that apparently mechanisms to increase trust among the many actors are
emerging. For example, some malware variants carry a guarantee by the seller to remain
undetectable by anti-malware software. Certain versions may include “service level
agreements” by which a seller promises to provide a newer undetectable version in case of
detection.
24
23
Adapted from McAfee Virtual Criminology Report 2007; page 8; available online at
/>
24
See MessageLabs Intelligence: 2007 Annual Security Report, available at
/>.
8 ITU Study on the Financial Aspects of Network Security:
Malware and Spam
www.itu.int/ITU-D/cyb/cybersecurity/docs/itu-study-financial-aspects-of-malware-and-spam.pdf
3.1. Division of labor
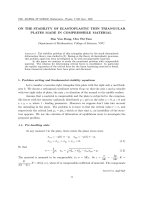
The cyber criminal market is surprisingly specialized. Division of labor and competition
among actors has contributed to a considerable drop in the price of malware. Figure 2
illustrates key players in the malware economy. Given the dynamic nature of this realm,
however, the degrees of specialization, and the differentiation of roles are in continuous flux.
Figure 2. Division of labor in the malware underground economy Visibility of malware vs.
malicious intent
Malware
Writer
Guarantee
Service
Spammers
Credit Card
Abuser
Botnet
Owner
Malware
Distributor
Reseller
Identity
Collector
eShops
Drop Service
Drop Site
Developers
Drop Drop
Drop
Uses Services
Seller Malware
Sells credit
cards with
identities
Buys Goods
Uses
Services
Forward Goods
Ships
Goods
Uses Services
Sells Identities
Uses Services
Sells Malware
Sells Malware
Buys
Drop
Site
Template
Source: Source: MessageLabs, 2007
Certain groups of malicious actors seem to be involved in the entire malware ecosystem from
the development of malware, acquisition of targets and distribution of spam and/or malware,
all the way to laundering the money into a “clean” bank account. Much of the criminal
market, however, is divided into segments that have a certain expertise. This expands the
opportunity to source partners globally, primarily through Internet Relay Chat (IRC)
channels, underground bulletin boards, and online forums.
For example, a malware distributor may buy malware from an author and use services offered
by a botnet owner to spread it (see below section 3.2 for a discussion of botnets). Botnets are
assembled from thousands to millions of infected computers located around the world. The
person running a bot on his or her system is typically completely unaware of it. Performance
degradation is at best noticeable during the short periods during which the botnet is active.
The system of computers constituting the botnet enables the attacker to efficiently target a
large number of individual users and organizations.
Other participants specialize in turning illegally acquired information into money, be it from
stolen credit cards or identity theft. Stolen credit card information, for example, may be used
to make purchases for parties known as “drops.” These drops, in turn, post the acquired
merchandise on eBay or sell it immediately for cash. This way balances in credit card
accounts are extracted to the criminals and the funds eventually laundered.
ITU Study on the Financial Aspects of Network Security:
Malware and Spam
www.itu.int/ITU-D/cyb/cybersecurity/docs/itu-study-financial-aspects-of-malware-and-spam.pdf
9
3.2. The role of botnets
Three principal types of actors are involved in the illegal activities associated with botnets and
their uses: (1) malware authors write and release malicious code; (2) bot-herders assemble
and run the botnets, operating them through “command-and-control” channels; (3) and clients
commission new malware development or botnet activity in order to accomplish fraudulent
and criminal objectives such as spam distribution, identity theft, DDoS attacks, etc.25 There
is plenty of evidence that organized crime gangs are as involved in all stages of the botnet
economy as are individual users. These criminals use a variety of tactics such as “mules” and
“drops,” as well as electronic fund transfer and offshore banking services to orchestrate the
flow of money between different countries.26
High speed Internet connections and increased bandwidth also allow for self-sustaining
attacks through compromised information systems. In this model, malware is initially inserted
into a few vulnerable computers. The compromised Internet-connected bots are in turn used
to scan and compromise more computers by installing malware through spam or from hosted
Trojan sites. Gradually, the number of infected machines recruited into the botnet is
increased. The compromised computers can then be rented to initiate other forms of cyber
fraud or crime. These actions could thus be considered as attacks that are indirectly caused by
malware. The whole system is self-sustaining and perpetuating a vicious circle.
Criminals have advanced technologically to the point where they are able to recognize if their
activities are being detected. This makes it more challenging to identify them as they switch
services or evade detection by shifting their activities to another compromised system.
According to Panda Security, as of March 10, 2008, 30 percent of computers on the Internet
were infected and posed latent threats. About half of these machines were active.27
Despite evidence of co-operation between botnets28 there is also competition within the
botnet economy, sometimes resulting in fierce attacks against one another as each botnet tries
to protect its compromised node.29 The highly illegal and competitive nature of the botnet
underground economy has led to the development of a well-developed system of self-
regulation and policing to identify and launch counter attacks on “bad actors” (a catch-all
term for fraudsters who try to cheat other fraudsters, undercover law enforcement or security
employees, etc.)30.
The year 2007 brought with it new tactics used by cyber criminals. Not only have they come
up with newer ways to distribute spam but they have also found newer methods to spread
malware. Increasingly, rather than attaching the malware to an email, spam contains links that
connect to infected websites. Malware is downloaded just by visiting the webpage (so-called
“drive-by” downloads). The proportion of emails with links to malicious websites increased
from 3 percent in the beginning of the year to 25 percent in December. Postini, a wholly
owned subsidiary of Google, estimated that approximately 10 percent of websites are infected
with malware.31
25
J. Franklin, V. Paxson, A. Perrig, S. Savage, “An Inquiry into the Nature and Cause of the Wealth of
Internet Miscreants”, paper presented at CCS’07, October 29-November 2, 2007.
26
ITU, Botnet Mitigation Toolkit, Geneva, November 2007.
27
See
28
For example, the sending of spam from multiple botnets simultaneously, see Panda Security, Annual
Report 2007, supra, note 9.
29
See J. Leyden, “Malware Removes Rival Rootkits,” February 28, 2008, available at
/>.
30
ITU, Botnet Mitigation Tool Kit, Geneva, November 2007.
31
See
10 ITU Study on the Financial Aspects of Network Security:
Malware and Spam
www.itu.int/ITU-D/cyb/cybersecurity/docs/itu-study-financial-aspects-of-malware-and-spam.pdf
3.3. The geography of malware and spam
The global reach of information and communication networks allows different actors to
pursue their fraudulent and criminal activities in a geographically dispersed and distributed
fashion. Although other motives are often at play, criminal activities predominantly follow an
economic logic. In selecting an optimal location to launch malicious activities or a location to
target with attacks, different trade-offs are taken into account. It may be economically rational
to locate criminal activities in places where law enforcement is weak and/or where it is
comparatively easy to find the required hosting services as this reduces the costs of
committing the crime.
Regarding the location of bots, several tradeoffs will be considered. On the one hand, it may
be more efficient to place bots in countries with good Internet connectivity. However, these
will typically also be nations with better law enforcement, laws attempting to keep malware at
bay, and ISPs that pursue suspicious activity more vigorously. Therefore, for certain types of
activities, it may be advantageous to launch attacks from nations with poorer connectivity but
without relevant cybercrime legislation or weak law enforcement.
While these tradeoffs are relevant, actual attack trends suggest that malicious actors do not
weigh these pros and cons in a static way. Rather than opting for specific regions or counties,
they frequently move their operations from one location to the next in response to changing
opportunities. One reason could be that ISPs in their current location may have become more
proactive in combating spam or botnet activity. Another reason is that the location has
become less attractive as it is increasingly blacklisted. In short, the geographical origin of
malware is highly dynamic and distributed.
MessageLabs reports disaggregated data from the subset of messages intercepted by its
software that originated from new and unknown sources and hence was subjected to more
detailed analysis. This data indicates that in 2007 the top five countries targeted32 with email
viruses were India with a 2.92 percent virus interception, Germany with 1.95 percent,
Switzerland with 1.66 percent, France with 1.59 percent and United Arab Emirates with 1.55
percent. MessageLabs also detected differences by sector. The top 5 industries targeted by
viruses were education with 1.76 percent, chemical/pharmaceutical with 1.33 percent,
wholesale with 1.17 percent, retail with 1.09 percent and accommodation/catering with 1.05
percent.33
Spammers can change apparent source addresses fairly dynamically, for example, using what
is known as fast flux techniques. Nonetheless, data from Spamhaus, which measures the
number of IP addresses from which spam is sent, indicate that the emergent aggregate
geographic pattern of spam origination is fairly stable. The top 10 countries continue to be
the United States, China, Russian Federation, United Kingdom, South Korea, Germany,
Japan, France, Canada, and Taiwan. During the period February through March 2008, the
ranking of the top 10 countries identified as sources of spam remained the same.34 The list of
the 10 worst ISPs was less stable. Nonetheless, eight of 10 ISPs remained in the top, although
32
MessageLabs collects billions of messages processed through the MessageLabs network to provide
real-time data and analysis. Some experts argue that the data collection method is insufficient to
generate a representative picture as MessageLab filters can be bypassed.
33
See MessageLabs, 2007 Annual Security Report, available at
/>.
34
See
ITU Study on the Financial Aspects of Network Security:
Malware and Spam
www.itu.int/ITU-D/cyb/cybersecurity/docs/itu-study-financial-aspects-of-malware-and-spam.pdf
11
marginal changes in ranks occurred.35 Similarly, Spamhaus data suggests that a relatively
small and stable group of spammers is responsible for much of the traffic.36
In terms of volume of spam SOPHOS estimated that during the fourth quarter of 2007 the
U.S. was the leading source of spam, followed by Russia, China, and Brazil.37 Data
collected by Team Cymru also indicates a similar geographic distribution of botnet and
malware activity.38 Symantec expects the U.S. to remain the top country until another nation
will surpass it in the total number of broadband connections.
Another source of data, MessageLabs, uses its spam filtering technology SkepticTM to create
more detailed data on messages that needed further analysis. This way, spam directed to
specific countries in local languages can be identified. The firm found that in 2007 the top
five countries targeted by email spam were Israel with a 68.9 percent of spam interception,
Hong Kong with 64.5 percent, Germany with 55.2 percent, the United States with 54.2
percent, and France with 53.8 percent. Using the same method, the firm found that the top 5
industries targeted by spam were manufacturing with 61.0 percent, agriculture with 60.4
percent, education with 57.8 percent, IT services with 54.3 percent and marketing/ media with
5.7 percent.39
Overall, there seems to be a shift in the origination of spam. In its State of Spam Report in
February 2008, Symantec found that the percentage of spam messages originating from
Europe was greater than the percentage of spam messages originating from North America.
During the preceding three months, approximately 44 percent of all spam email originated
from Europe versus 35.1 percent from North America. This new picture has emerged and
remained constant since the beginning of November 2007. When Symantec first started
recording this data in August of 2007, 30.6 percent of spam originated in Europe while 46
percent originated in North America40
35
See
36
See .
37
See “Russia Emerges as Spam Superpower, as Asia and Europe Overtake North America”, available
at
38
See
39
See MessageLabs, 2007 Annual Security Report, available at
/>.
40
See “The State of Spam, A Monthly Report–February 2008”, available at
/>_-_February_2008.pdf.
12 ITU Study on the Financial Aspects of Network Security:
Malware and Spam
www.itu.int/ITU-D/cyb/cybersecurity/docs/itu-study-financial-aspects-of-malware-and-spam.pdf
4. A CONCEPTUAL FRAMEWORK FOR MODELING FINANCIAL ASPECTS OF MALWARE
AND SPAM
Numerous financial flows take place in the malware and spam ecosystem. This section
develops a conceptual framework for the subsequent discussion of the empirical data.
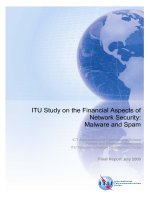
Figure 2 Legal and potentially illegal financial flows related to malware
Legend (solid lines: legal; dotted lines: potentially illegal financial flows)
1
…………
Extortion payments, click fraud, compensated costs of ID theft and phishing
2
…………
Uncompensated costs of ID theft and phishing, click through, pump and
dump schemes, Nigerian 419 scams, and other forms of consumer fraud
3, 4, 5, 6
…
Hardware purchases by criminals, corporate and individual users
7, 8, 9, 10
….
Security service purchases by hardware manufacturers, corporate and
individual users, ISPs
11, 12, 13
….
ISP services purchased by corporate and individual users, criminals
14 Payments to compensate consumers for damages from ID theft (if provided)
Hardware,
Software
Security
service
p
roviders
Fraudsters,
Criminals
ISPs
Individual
users
1
2
13
5
3
8
9
4
10
12
11
6
7
Government
Society at large
Business
users
14
ITU Study on the Financial Aspects of Network Security:
Malware and Spam
www.itu.int/ITU-D/cyb/cybersecurity/docs/itu-study-financial-aspects-of-malware-and-spam.pdf
13
Figure 3 depicts aggregate flows between main groups of actors. Within each category,
complex financial transactions take place. Some of the transactions are legal whereas others
are clearly illegal. Moreover, there are interactions between the legal and illegal realm, as
some legal transactions are caused or at least affected by illegal transactions. For example,
the revenues of security service providers are positively influenced by the extent of criminal
activity. In that sense, a positive externality exists between cyber criminals and security
service providers.
Development of accurate measures of these flows is complicated by the large number of legal
and illegal players and the elusive nature of some of the transactions. Most of the financial
flows between players in the underground cybercrime economy are not or only partially
known. Due to the sensitive nature of some information, many of the financial flows even in
the legal segment of the economy, such as the extent of damages related to malware, are not
systematically tracked. Even if such attempts existed, it would be difficult to estimate the
exact amount of financial losses associated with such activities because of the complicated
nature and effects of attacks. Moreover, in cases where a company, organization or the
government has data regarding financial losses, management may be reluctant to make it
public because it might affect the firm’s reputation. No systematic and aggregate figures exist
as to investment in preventative measures. In as far as the information exists, it is typically
considered proprietary and not released to the public.
To describe Figure 3 in more detail, it depicts aggregate financial flows corresponding to
transactions between main players. Solid lines represent legal forms of business transactions
whereas dotted lines indicate transactions of a potentially illegal nature. All users purchase
security services (lines 7-10). Although the exact magnitude of the flows from each group of
players is not exactly known, the total revenue generated by security service providers can
serve as a proxy for them. Both legitimate and illegitimate users purchase services from
hardware manufacturers and software vendors (lines 3-6). Likewise, both legitimate and
illegitimate users buy from ISPs (lines 11-13). For example, cyber criminals may buy bullet-
proof hosting services at premium prices.
41
Sources of revenues of cyber criminals include extortion payments from companies for click
fraud (line 1) as well as funds appropriated from individual users through identity theft but
also voluntary if fraudulent payments in the context of click through, pump and dump
schemes, or phishing attacks. In addition to these transactions between players, financial
flows may happen within a sector. For instance, as discussed above, considerable division of
labor exists within the criminal segment, contributing to financial flows internal to that
segment.
Whereas Figure 3 represents the financial flows between these aggregates, it does not
necessarily depict the incidence of costs. In many countries, for instance, financial
institutions (part of the corporate user aggregate) hold their customers harmless for losses
incurred in the context of phishing attacks. This practice constitutes, on the one hand, a
financial flow from consumers to criminals. At least initially, however, it is the banks who
bear the financial burden. Only in the medium and long run will financial institutions attempt
to pass the costs of fraud on to consumers.
The whole system represented in Figure 3 is embedded in societal institutions. Some cost of
malware and spam are imposed on government and society at large, be it in the form of law
41
“Bullet-proof hosting” also “bulk-friendly hosting” refers to hosting services that give their customers
great freedom as to the type of content they may upload. Some of these services are not in compliance
with national laws and have been used by spammers. Many but not all of the bullet-proof hosting
services are outside of the country of the content provider.
14 ITU Study on the Financial Aspects of Network Security:
Malware and Spam
www.itu.int/ITU-D/cyb/cybersecurity/docs/itu-study-financial-aspects-of-malware-and-spam.pdf
enforcement costs or in the form of opportunity costs due to the malware-induced slower
adoption of productivity-enhancing applications of ICT.
As mentioned, malware and spam are intricately related phenomena. For the sake of
expositional clarity, we will, in the following two sections, discuss empirical evidence as to
their operational and financial effects separately. Operational impacts are identified even if
no reliable cost figure can be associated with that effect. In addition, we review the evidence
as to the known financial effects of malware and spam.
5. FINANCIAL AND OPERATIONAL EFFECTS OF MALWARE
Estimates of the costs of malware vary widely and the empirical knowledge base is sketchy
and incomplete. Each empirical data source and method of measurement typically has its
own advantages and disadvantages. Many statistics are provided by stakeholders who might
have an incentive to underreport or overreport threats.
42
More accurate data is typically
available for narrowly defined segments of the global or national economy. It is usually not
straightforward to derive estimates for the whole economy from these more specific surveys.
In most cases, very strong assumptions would have to be made to arrive at such scaled-up
numbers. This section summarizes the most important data related to malware and the next
section elaborates on the related problem of spam.
5.1. Direct and indirect costs of malware
Several public and private sector organizations have tried to quantify the direct and indirect
costs of malware. The following sub-sections differentiate between findings at an aggregate
level, for businesses, and individual users.
Costs at an aggregate level
Computer Economics attempted to quantify the worldwide damage caused by malware. The
survey of 52 information technology professionals and managers estimated the direct
worldwide damage due to malware to be US$ 13.2 billion in 2006. This was a decline from
the figures of US$ 14.2 billion in 2005, and US$ 17.5 billion in 2004.
43
A large proportion of
companies in the survey kept a record of the frequency of malware incidents but was unable
to put a specific number on financial losses incurred.
44
Although the survey is the only one
applying a global perspective, one has to keep in mind that it is based only on a small number
of respondents.
According to Computer Economics, the decline probably reflects two main developments.
First, anti-malware technology is becoming more widely employed and more effective against
certain types of threats. Second, Computer Economics observed that whereas the direct costs
may be declining the indirect or secondary costs may be increasing. These include
preventative costs (e.g., hardware, software, IT security staff), secondary costs of secondary
attacks, insurance costs, as well as intangible costs such as brand damage and loss of market
share. Many of these cost components are difficult to measure and were not included in the
estimates of direct damages above.
42
See R. Anderson et.al., Security Economics, supra, note 2.
43
Computer Economics, 2007 Malware Report: The Economic Impact of Viruses, Spyware, Adware,
Botnets and other Malicious Code, p. 5, available at
/>
44
Ibid, page 9.
ITU Study on the Financial Aspects of Network Security:
Malware and Spam
www.itu.int/ITU-D/cyb/cybersecurity/docs/itu-study-financial-aspects-of-malware-and-spam.pdf
15
An alternative number provided by the U.S. Federal Bureau of Investigation (FBI) estimates
that in 2005 computer crime cost the U.S. economy US$ 67.2 billion, approximately 0.5
percent of GDP.
45
The considerable gap between these two sources can be explained by the
focus of the Computer Economics survey on direct costs of malware whereas the FBI report is
more inclusive.
Costs for businesses
Probably the most-quoted data source is the CSI (formerly CSI/FBI) Annual Computer Crime
and Security Surveys.
46
This anonymous survey, in 2007 its 12
th
consecutive year, reflects
the experience of the U.S. community associated with the Computer Security Institute and its
conferences. While not fully representative of this community (the survey response rate is
about 10 percent) it reflects major trends within it. The 494 respondents to the 2007 survey
represented a broad range of sectors, including finance (20 percent), state, local and federal
government (13 percent), education (11 percent), information technology (11 percent), and
manufacturing (95 percent).
In 2007, practitioners from 494 organizations responded, of which 194 were able to provide
numerical estimates of the losses that they had experienced during the year. The total loss due
to cybercrime for the reporting organizations was estimated to US$ 66.9 million. By far the
highest damage was caused in the category of financial fraud (US $21.1 million), followed by
damage from viruses/worms/spyware (US $8.9 million) and damage from system penetration
by outsiders (US $ 6.9 million). In 2007, these aggregate numbers translate into average
losses per reporting firm of approximately US$ 345,000.
Figure 3 Average reported losses in CSI surveys 1999-2007 ($000)
Source: CSI (2007), p. 16.
45
See Federal Bureau of Investigation, 2005 FBI Computer Crime Survey. See also Government
Accountability Office, “Cybercrime: Public and Private Entities Face Challenges in Addressing Cyber
Threats”; June 2007, available online at
46
CSI, 2007 CSI Computer Crime and Security Survey, San Francisco, CA: Computer Security Institute,
available at />.
16 ITU Study on the Financial Aspects of Network Security:
Malware and Spam
www.itu.int/ITU-D/cyb/cybersecurity/docs/itu-study-financial-aspects-of-malware-and-spam.pdf
Figure 4 shows the average losses reported in the CSI surveys since 1999. Although the
composition of the respondents changed slightly from year to year, according to CSI, it
remains generally representative of the community. The peak loss was experienced in 2001
with more than US$ 3.1 million per reporting organization. Ever since, most likely due to
increased awareness and more systematic investment in computer security, the damages
declined to a low of US$ 168,000 per reporting organization in 2006. In 2007, the downward
trend reversed as damages per reporting organization doubled to US$ 345,000. It is difficult
to assess whether this represents a one-time deviation or a sustained reversal of the downward
trend. Most likely it reflects the technology race between the provision of cybersecurity and
ever more sophisticated and virulent criminal attack techniques.
It is also, important to note that direct losses are no measure of the complete financial impact
felt by society. First, these estimates to not include the cost of preventative measures. The
amount spent by companies on information security falls in a broad range. Gartner estimates
that the total global revenue of security service providers in 2006 was US$ 7.5 billion. On the
user side, 61 percent of the respondents in the CSI survey reported security costs of 0-5
percent of the total IT budget, 23 percent reported a share of 5 percent or higher of the IT
budget.
47
A recent study by the TU Delft and the Quello Center at Michigan State University
revealed similar numbers.
48
.
Second, these direct costs do not include the costs of other indirect preventative measures
such as expenses of training personnel to adopt security-conscious work procedures or labor
expenses for researching malware in order to disinfect infected machines. Respondents to the
CSI survey indicated that a small share of the IT security budget is spent on awareness
training (48 percent responded that 1 percent or less of the IT security budget was spent for
that purpose).
49
However, it is probably safe to assume that this represents only a fraction of
the total cost of personnel-related preventative measures.
Third, these direct costs do not include opportunity costs to society at large. In as far as the
perception of security threats slows down the adoption of efficiency-enhancing ICTs
throughout society we may also suffer from unrealized efficiency gains. The existence of such
opportunity costs is, however, difficult to establish and nearly impossible to quantify. The
empirical evidence is somewhat contradictory. Surveys by the Pew Internet & American Life
Project in 2003 and subsequent years indicated considerable concerns of individual users
about spam. In contrast, panelists at the 2007 FTC Spam Summit, while reporting negative
effects on consumer trust, presented evidence of declining concerns by individuals.
50
A recent report by the U.S. Federal Deposit Insurance Corporation (FDIC) contained data on
the damages caused by malware to the financial services industry during the second quarter of
2007. Although the report was not made public, some aggregate numbers are available. The
report focuses on suspicious activity reports (SARs), which need to be filed in cases of
suspicious or fraudulent transactions exceeding US$ 5,000. The number of computer
intrusion related SARs in the second quarter of 2007 was 536 with an average loss per
47
Ibid, p. 7.
48
See M. J. G. van Eeten, J. M. Bauer with contributions by M. de Bruijne, J. P. Groenewegen, and W.
Lemstra, Economics of Malware: Security Decisions, Incentives, and Externalities, OECD STI Working
Paper 2008/1 JT03246705, Paris, OECD, 2008, available online at
49
CSI, 2007 CSI Computer Crime and Security Survey, San Francisco, CA: Computer Security Institute,
available at />., p. 8.
50
See FTC, Spam Summit, supra, note 1, p. 9-10.
ITU Study on the Financial Aspects of Network Security:
Malware and Spam
www.itu.int/ITU-D/cyb/cybersecurity/docs/itu-study-financial-aspects-of-malware-and-spam.pdf
17
intrusion of US$ 29,630.
51
Prior to 2007, the number of SARs during the second quarter had
been 503 in 2004, declined to 293 in 2005 and increased again to 370 in 2006. In 2006, the
average loss had been US$ 10,536. The number of credit card fraud cases increased from
6,301 during the second quarter of 2005 to 7,962 during the same period in 2007. Likewise,
the number of debit card fraud cases increased from 777 in the second quarter of 2005 to
1,142 in the second quarter of 2007.
52
It is important to keep in mind that the actual number of
fraud incidents will be substantially higher, as many cases – or most cases, as some argue –
do not cross the reporting threshold of US$5,000.
Costs to consumers
It is even more difficult to assess the financial losses inflicted by malware to individual
consumers although there is scattered evidence that damages can be very large. Such costs
have different components. They may result in direct damages to hardware and software as
well as financial and other damages due to identity theft or other fraudulent schemes
(discussed in section 6 below). The range of estimates differs, although the emerging overall
picture is quite coherent.
Based on information collected from 2,000 participants in its 2006 State of the Net survey,
Consumer Reports projected total losses for U.S. consumers of US$ 7.1 billion. 1 in 5
consumers reported problems with viruses, causing costs of US$ 3.3 billion. Fixing problems
caused by spyware cost consumers UD$ 1.7 billion and losses from phishing attacks
amounted to US$ 3.1 billion.
53
The total damage in 2006 was down from the estimated US$
8.4 billion in 2005.
Another estimate for the U.S. aimed at quantifying the direct damages to repair or replace
information systems infected with viruses and spyware. According to the report, consumers
paid nearly US$ 7.5 billion over two years to repair or replace hardware.
54
5.2. Illegal revenues associated with malware
It is increasingly easy to set up and even create one’s own bot. Specific skills or technological
knowledge is not a criterion anymore as there is a wide selection of readily available tools
online including access to the malware source code.55 There are several “off-the-shelf” kits
with ready-made Trojans that can be easily downloaded. The costs of such services are
reportedly low and estimated to be as little as US$ 2,000.56 Botnets can be leased at an
estimated price of about US$ 50–60 per 1,000–2,000 bots.57 Another source quotes prices of
2.5 to 6 cents per bot per week depending on the configuration.58
Some actors offer a complete range of services. They develop, maintain and sell malware,
botnets, spam transmission software, CDs full of addresses harvested from web pages, lists of
51
See B. Krebs, “Banks: Losses from Computer Intrusion up in 2007”,
/>g.
52
Ibid.
53
See Consumer Reports, September 2007, pp. 30-31, available at .
54
See Consumer Reports, national survey 2006.
55
See McAfee Virtual Criminology Report 2007; page 6; available online at
/>
56
See MessageLabs, Intelligence: 2007 Annual Security Report, available at
/>
57
Ibid.
58
See M Handley, “DoS-resistant Internet Subgroup Report”, presentation at University College,
London.
18 ITU Study on the Financial Aspects of Network Security:
Malware and Spam
www.itu.int/ITU-D/cyb/cybersecurity/docs/itu-study-financial-aspects-of-malware-and-spam.pdf
open proxy servers, and lists of open simple mail transfer protocol (SMTP) relays. Lists of
email addresses are now fairly cheap and usually cost about US$ 100 for 10 million
addresses. Some provide servers and bandwidth, charging around US$ 300 per million
messages sent.59 This allows for the whole process to be carried out in an inexpensive
manner.
Some malicious actors also rent component services such as bullet-proof hosting, email lists,
or services offered by botnet herders. However, other actors in the underground economy act
as free-riders, taking advantage of the existing information and communications infrastructure
without compensation. Thus, the cost of bandwidth, Internet connectivity, email addresses
and web hosting used to operate a botnet are typically absorbed and borne unwittingly by end
users, ISPs, and other participants in the value net.
As described above, middlemen are typically involved in selling and marketing the stolen
information (e.g., identities) for monetary benefits. An identity can sell for as low as $5. It can
include the person’s name and address, a passport or driver’s license scan, credit card
numbers and bank account details. Credit card numbers often sell for 2-5 percent of the
remaining credit balance on the cards in question60. Identity thieves also offer specialized
services to their customers. Identities may be sold sorted by country, industry, role, and credit
cards sorted by remaining balance.
5.3. Operational effects on cyber infrastructure
Although no financial data is available, activities in the underground internet economy also
affect the operations of the entire cyber infrastructure. Therefore, it seems justified to present,
in conclusion, available evidence as to the operational interruptions of that infrastructure.
These attacks cause costs that will show up in the operational data of the organizations
attacked but may not be identified as costs of security.
The Worldwide Security Infrastructure Report of September 2007 identified the most urgent
threats in the cyber world (Figure 5 above). The various threats were studied according to the
effect they had and if the system was the primary target of an attack or only a secondary
target.
The primary attack targets are depicted in Figure 6. The data was collected by asking
respondents of their perception of the primary target of an action or actionable attack.
61
As
these categories are not mutually exclusive respondents were allowed multiple answers.
59
See S. Vaknin, “The Economics of Spam,” available at
/>
60
See M. Schipka, “The Online Shadow Economy: A Billon Dollar Market for Malware Authors,” White
Paper, MessageLabs, 2007.
61
Survey conducted by Arbor Networks, Inc., covering the 12-month period between July 2006 and
June 2007.
ITU Study on the Financial Aspects of Network Security:
Malware and Spam
www.itu.int/ITU-D/cyb/cybersecurity/docs/itu-study-financial-aspects-of-malware-and-spam.pdf
19
Figure 4 Threats to cyber infrastructure
Source: Arbor Networks, Inc., 2007.
Figure 5 Primary attack targets
Source: Arbor Networks, Inc., 2007.