Tài liệu Screening Tests, Information, and the Health-Education Gradient doc
Bạn đang xem bản rút gọn của tài liệu. Xem và tải ngay bản đầy đủ của tài liệu tại đây (298.44 KB, 31 trang )
W
W
O
O
R
R
K
K
I
I
N
N
G
G
P
P
A
A
P
P
E
E
R
R
N
N
O
O
.
.
1
1
8
8
7
7
Screening Tests, Information,
and the Health-Education Gradient
Ciro Avitabile, Tullio Jappelli and Mario Padula
January 2008
This version April 2008
University of Naples Federico II
University of Salerno
Bocconi University, Milan
CSEF - Centre for Studies in Economics and Finance – UNIVERSITY OF SALERNO
84084 FISCIANO (SA) - ITALY
Tel. +39 089 96 3167/3168 - Fax +39 089 96 3167 – e-mail:
W
W
O
O
R
R
K
K
I
I
N
N
G
G
P
P
A
A
P
P
E
E
R
R
N
N
O
O
.
.
1
1
8
8
7
7
Screening Tests, Information,
and the Health-Education Gradient
Ciro Avitabile
, Tullio Jappelli
, Mario Padula
Abstract
The association between health outcomes and education – the health-education gradient - is widely documented
but little is known about its source. Using microeconomic data on a sample of individuals aged 50+ in eight
European countries, we find that education and cognitive skills (such as verbal fluency) are associated with a
greater propensity for standard screening tests (mammography and colonoscopy). In order to study the role of
information on the decision to screen, we test whether the health-education gradient varies with the quality of the
information provided by the health care system, as proxied by the quality of the General Practitioner. Using an
Instrumental Variable approach to control for the potential endogeneity of the GP quality score, we find evidence
of a strong and significant complementarity between education and quality of primary care. We interpret this result
as evidence that health-education gradient can be explained, at least in part, by the fact that better educated
individuals are more able to process and internalize health related information as provided by GPs.
JEL Classification: I0, I1, I2.
Keywords: Health, education, information, general practitioners.
Acknowledgements: We thank James Banks and Jim Smith for comments, and the Italian Ministry of University
and Research for financial support.
University College London, University of Salerno and CSEF
University of Naples Federico II, CSEF and CEPR
University Ca’ Foscari of Venice and CSEF
Table of contents
1. Introduction
2. The health-education gradient
3. The data
3.1. Screening test compliance
3.2. The quality of General Practitioners
4. Empirical analysis
4.1. Mammography
4.2. Colonoscopy
5. Conclusion
References
7
1. Introduction
People with better education tend to have better health and to exhibit healthier behavior,
even holding income, occupation and other socioeconomic variables constant. This well-
established fact does not yet have a satisfactory explanation. Cutler and Lleras-Muney (2006),
in reviewing the literature, note out that the correlation between education and health - the
health-education gradient - might derive from health causing education in childhood,
education causing health later in life, or by some hidden factor affecting both. Even in a
sample of individuals whose education is already acquired, the mechanisms through which
education and health are related are not well understood, as education is itself correlated with
the ability to acquire and process information, household resources, and preferences.
In this paper we study whether the education differences in health-related behavior
result from differences in knowledge. On the one hand, more educated individuals might
acquire more information for example because they read more. On the other hand, as argued
by Cutler and LLeras-Muney (2007), while most health related information is freely
distributed, it might be believed more by the better educated. In order to test whether and how
education can affect health related knowledge, we analyze the interaction between quality of
general practitioners (GPs) and education in the decision to screen for breast and colon
cancer. While education facilitates the acquisition of health-related information, health
professionals could provide the same information. If access to information explains at least
part of the correlation, the health-education gradient will be less important for those who
receive better information from the health system. In this case education and outside sources
of information would be substitutes, and the gradient flatter. On the other hand, people with
better education might also benefit more from the information provided by the health care
system because they can process and internalize it better. In this case education and outside
sources of information would be complements and the gradient steeper. In both cases, failure
to control for information received from the health care system biases the estimated effect of
education on health.
We use internationally comparable data on eight countries (Austria, Belgium, Denmark,
France, Germany, Italy, Spain, and Switzerland) covered by the Survey of Health, Ageing and
Retirement in Europe (SHARE). Understanding how information provided by health
professionals affects individuals’ decision-making and how it interacts with other channels of
8
information poses two problems. First, measures of medical advice are frequently not
available in survey data. Second, the type of information and the quality of doctors might be
correlated with unobserved characteristics of patients.
Our empirical strategy addresses both of these problems. We focus on two screening
tests, mammography and colonoscopy, that are strongly recommended to asymptomatic
individuals aged 50 or above, regardless of their health history. This should rule out the
problems of selection bias that arise in samples of individuals already diagnosed for various
diseases.
A further reason to concentrate on these two tests is that both screening procedures are
either free or heavily subsidized for the individuals included in our sample. This minimizes
the risk of education proxying for differing capacity to access health services.
Finally, we focus on a specific group of health professionals. In all the countries covered
by our study GP coverage is free of charge and universal. The distinctive feature of the GP-
patient relation is that it is usually long-term and likely to be characterized by repeated
interactions. As Scott (2000) notes, the long-term relation facilitates information transmission
between GP and patients. We exploit the unique SHARE data to construct a measure of GP
quality based on the completion of standard geriatric assessments, and show that it is strongly
correlated with the probability of patients being advised to undergo the standard universally
recommended screening tests. To our knowledge, our work is the first attempt to construct an
individual measure of primary care quality and to relate it to patients’ decision.
1
Nevertheless, the non-random assignment of GP quality and the potential recall bias of
patients might drive a spurious correlation between the quality score and the decision to
undertake preventive screening. In order to address this issue, we exploit a feature common to
all the countries covered by our analysis: regional governments are largely autonomous in the
decisions concerning the funding, the size and the allocation of public health care
expenditure.
2
Therefore, we exploit regional variations in quality indicators of primary care
and health promotion to control for the potential endogeneity of the GP quality score.
We then estimate whether the health-education gradient is affected by GP quality. Our
econometric results suggest that education and cognitive abilities (as measured by verbal
1
Morris and Gravelle (2006) investigate the relationship between GP supply and body mass index in UK using
information at area level.
2
The European Observatory on Health Systems and Policies provides detailed descriptions of the different
health care systems (see www.euro.who.int/observatory).
9
fluency) increase the propensity for preventive screening. A better GP quality is also
positively associated with screening. Our baseline estimates show a weak and not statistically
significant substitutability between quality of general practitioners and education. When we
control for the potential endogeneity of the GP quality score the results deliver a consistent
pattern: the better the quality of the general practitioner, the higher the effect of education and
cognitive ability on the probability of undertaking both mammography and colonoscopy. This
result supports the hypothesis that more educated individuals can better process and
internalize the information provided by GPs. It also has an important implication, namely that
making more health related information freely available might not reduce health disparities, at
least in a sample of elderly.
In Section 2 we review evidence on the health-education gradient and the different
channels that can lead to an association between education, health outcomes and health risks.
In Section 3 we describe the data and provide descriptive statistics on the percentage of
people covered by GPs and their quality. The empirical results are presented in Section 4, and
Section 5 concludes.
2. The health-education gradient
The positive association between education and health has been widely documented for
the US (Grossman and Kaestner, 1997; Cutler and Lleras-Muney, 2006) and the UK (Marmot,
1991; Banks et al., 2007). Less is known for other countries, and particularly for continental
Europe. Mackenback et al. (2003) rely on national survey data to study mortality differentials
by educational level and occupational class among men and women in Finland, Sweden,
Norway, Denmark, England, and Italy. Avendano et al. (2005), using SHARE data, find that
men and women over 50 with less education are more likely to report poor health status,
chronic conditions, and physical limitations due to health problems. Even less is known as to
why health outcomes and education are positively correlated.
Education might improve health simply because it is associated with more resources,
including access to health care. This is perhaps the most obvious explanation, but it is not the
whole picture. Cutler and Lleras-Muney (2006) show that after controlling for income and
health insurance, education is still a significant determinant of health status in the US. In
addition to earning higher incomes, however the better educated might also work in healthier
10
environments. However, Lahema et al. (2004) and Cutler and Lleras-Muney (2006) find that
job characteristics do not fully explain the education gradient, at least in the US.
Education could also be correlated with individual preferences (such as impatience and
risk aversion) that can ultimately affect investments in health. For instance, suppose that the
more risk-averse are also more likely to go to school and achieve higher education. If risk-
averse individuals are also more likely to do screening, as is found in Picone, Sloan and
Taylor (2004), one would find a relation between education and health, but it would be driven
entirely by failure to control for risk aversion.
Education is directly related to health information in several ways. An extensive
literature shows how education increases awareness of unhealthy behaviors and health risks.
Schooling reduces smoking, drinking and sedentary life (Kenkel, 1991a; Kenkel, 1991b),
affects demand for early detection of breast and cervical cancer (Kenkel, 1994) and flu
vaccination (Mullahy, 1999). Another strand of the literature points out that better educated
people are quicker to exploit technological advances in medicine and more complex
technologies - see Lleras-Muney and Glied (2003), and Cutler and Lleras-Muney (2006).
Previous research has tried to identify the role of information in the health-education
gradient relying on event studies or direct survey questions. De Walque (2006) uses event
studies to investigate how different education groups responded to an HIV information
campaign in Uganda. Kenkel (1991a) uses direct questions available in cross-sectional data to
analyze whether the effect of health information (as measured by answers to health-related
questions) on risk factors varies with years of schooling.
3
In this paper we take a third
approach, comparing the probability of undergoing the most common screening tests among
individuals who interact with universally and freely available health professionals. After
controlling for the potential endogeneity of the GP quality score, we test whether the health-
education gradient is flatter or steeper for individuals who interact with better GPs.
3
The risk factors are drinking, smoking and lack of physical exercise.
11
3. The data
We use the most recent data release of the Survey of Health, Aging and Retirement in
Europe (SHARE), a survey of the population aged 50+ conducted in 2004.
4
The survey
involved 19,286 households and 32,022 individuals, covering a wide range of topics,
including physical health, behavior, socioeconomic status, income and intensity of social
interaction. Some questions refer to the household (for instance, income), others to each
eligible member within the household and to his or her partners; this is the case for the
indicators of health status and behavior.
5
SHARE also includes a section on preferences,
beliefs, attitudes and other items, including the demand for preventive care, and an individual
level indicator of GP quality. The SHARE data are thus particularly useful for the issues we
are investigating.
Of 11 countries covered by SHARE, we exclude Greece, the Netherlands and Sweden,
because in these countries GPs play a less important role. In Greece primary care is just
beginning to develop and only a small fraction of the population is registered with a GP. In
the Netherlands there are two health insurance schemes; GP consultation is compulsory only
under the sick fund system, which covers only 60 percent of the population.
6
The Swedish
health system has traditionally been hospital-centered, as the very low ratio of GPs to
specialists shows (Simoens and Hurst, 2006). Our final sample thus includes 12,405 men and
15,177 women aged 50-85 in Austria, Belgium, Denmark, France, Germany, Italy, Spain, and
Switzerland.
3.1. Screening test compliance
We focus on two cancer screening tests: mammography and colonoscopy. Early
detection of breast and colon cancer significantly reduces mortality. The American
4
The SHARE data collection has been primarily funded by the European Commission through the 5th
framework program (project QLK6-CT-2001-00360 in the thematic program Quality of Life). Additional
funding came from the US National Institute on Ageing (U01 AG09740-13S2, P01 AG005842, P01 AG08291,
P30 AG12815, Y1-AG-4553-01 and OGHA 04-064). Data collection in Austria (through the Austrian Science
Foundation, FWF), Belgium (through the Belgian Science Policy Administration) and Switzerland (through
BBW/OFES/UFES) was nationally funded. The SHARE data set is presented in Börsch-Supan et al. (2005).
5
The questionnaire and the sample design are patterned after the US Health and Retirement Survey (HRS) and
the English Longitudinal Study of Ageing (ELSA). Börsch-Supan et al. (2005) report details on sampling,
response rates and definitions of variables.
6
Only low income employees and people aged 65 and above are eligible for this fund.
12
Association of Colon and Rectal Surgeons recommends regular screening after age 50.
7
According to the American Cancer Society, women aged 40 and above should have a
mammogram performed every year and for as long as they are in good health.
8
In most
European countries mammography is recommended every second year to women aged 50 and
above, regardless of health history. Accordingly, even if education affects personal health
histories, our use of tests recommended to the general population on the basis of age should
avoid biasing the health-education gradient.
Field studies in the medical literature show that patient compliance is much higher for
mammography than for colonoscopy, even among groups at risk.
9
Colonoscopy and
mammography are interesting also because the costs and benefits vary with individuals and
with tests themselves. If colonoscopy and mammography are provided free of charge by a
National Health System, the cost consists mainly in perceived invasiveness. The benefit, early
detection of a disease, depends on health and on time preference, as is pointed out by Picone,
Sloan and Taylor (2004): better health and a lower time preference are associated with higher
demand for preventive screening.
Table 1 shows the percentage of women aged 50-85 who had a mammography done in
the two years before the survey and the percentage of men and women who had
colonoscopies at least once in the previous ten years. In France the percentage of women
doing breast screens is above 70 percent, while it is just 22 percent in Denmark. France,
Germany and Austria show the highest rates for colonoscopy; in Spain only 8 percent of
women and men had had that test done.
Institutional factors explain part of the international differences in screening rates and
protocols. In Austria, Germany, France, Italy, and Spain women aged 50-69 are invited to
take a mammography at least once every two years free of charge.
10
In Denmark only two out
fourteen communities have established a breast cancer prevention program, which currently
covers only 20 percent of the Danish female population.
The scenario for colorectal cancer screening is different. Only in a few countries special
programs are in place (see Holland, 2006). In Austria all men and women 50+ are invited for
7
For details see www.fascrs.org/.
8
See www.cancer.org/.
9
Urban, Anderson and Peacock (1994) find a compliance rate of about 40 percent for mammography in a
population of 50+ women. Cottet et al. (2006) find a compliance rate of 18 percent for colonoscopy among first-
degree relatives of patients with large adenomas.
10
In France the age group extends to women 74 years old; in some Autonomous Communities in Spain the limit
is 64/65.
13
precautionary check-ups, informed about the risks of colorectal cancer and invited to take a
colonoscopy. In Italy, since 2001, colonoscopy every five years has been free of charges
(exempted from co-payment) for men and women age 45+ and for the population at risk as
defined by the Ministry of Health. The testing protocols for this form of cancer vary. In
France individuals at risk are advised to have the colonoscopy only if the fecal blood test is
positive; in Italy and Germany it is recommended to all individuals at risk; and in the other
countries there are no special provisions for colorectal cancer screening.
11
3.2. The quality of general practitioners
Recently the OECD and the World Health Organization have constructed quality
indicators for primary medical care, measuring obesity and diabetes prevalence, smoking rate,
flu vaccination for high-risk groups, and colon cancer screening (OECD, 2004). Here, we are
interested in measuring the quantity and quality of information that public health care systems
give to people who must make health-related decisions. Because of universal and compulsory
registration, the quality of general practitioners is crucial to this function.
In principle a variety of different health professionals can provide primary health care
but in most countries GP is the most common point of first contact. With a few exceptions,
GP care is provided free of charge and on a universal basis by National Health Systems.
12
According to a recent definition, “the GP engages with autonomous individuals across the
field of prevention, diagnosis, cure, care and palliation” (Brotons et al., 2005). Although the
organization and provision of GP care differ from country to country, everywhere one of the
GP’s most important tasks is to provide health-related information and explain options
treatment to patients (see Scott, 2000). Moreover, high quality general practice might shorten
decision times and track patients’ behavior more closely (Cutler and Lleras-Muney, 2006),
which could be particularly relevant for colonoscopy.
13
Using the SHARE drop-off questionnaire, we construct a GP quality indicator at
individual level, with six measures of geriatric assessment. These are straightforward aspects
of medical consultation that should be easily recognized by the respondents, regardless of
11
In France the introduction of a colon cancer screening program hinges on the result of trials in 22
Departments. More detailed information about the regulatory frameworks in the EU countries can be found in
Screening in Europe, Policy Brief, European Observatory on Health Systems and Policies.
12
In Germany, individuals pay small charges for some additional services.
13
People who take the test must follow a special diet for up to three days beforehand the test and are given a
laxative to clear their colon. Before the examination they are given a sedative by an injection into vein.
14
education. In particular, SHARE respondents report whether their GP asks about physical
exercise, falls and drugs, suggests regular physical exercise or checks their weight. We
convert these questions into dummy variables, so the GP quality index ranges from zero (the
GP does none of the above) to six (all of the above).
Table 2 illustrates the international variability of GP coverage and the quality index.
Consistent with the free and universal access, 94 percent of the individuals in our sample are
registered with a general practitioner. The countries where the GP quality score is highest are
France and Spain (above 3), while Denmark has the lowest (2.1). In Italy and Denmark, 25
percent of the sample receive no geriatric assessment, 20 percent in Austria and 16 percent in
Spain reported they received all the assessments. These results basically accord with patients’
evaluations and country-level indicators of the quality of health care. Grol et al. (2000), using
the European Task Force on Patient Evaluations of General Practice Care (EUROPEP), find a
generally negative opinion of the geriatric assessments of GPs in Denmark and the other
Scandinavian countries. France, Austria and Germany are the countries with the highest GP
density, Denmark the lowest (Simoens and Hurst, 2006).
We take the GP quality index as a proxy for the flow of information between doctors
and their patients. Interestingly, this indicator is strongly correlated with the probability of
having been advised to get a flu vaccination in the year before the survey, which is strongly
recommended to people over 65. Figure 1 plots this probability against the GP score. We take
the positive association between the two variables as an indication that the GP score does
proxy for the amount of medical information transmitted by health professionals.
4. Empirical analysis
We test whether education and GP are complements or substitutes in explaining the
demand for screening, by estimating the following probit model:
iiiiii
XGPEGPEy '()1Pr(
3210
)
where y
i
takes value 1 if individual i undertakes the screening test, E is years of education and
GP is the general practitioners’ quality score; X
i
includes age, marital status, presence of
children, disposable income, occupational status, a proxy for the quality of health supply and
15
an indicator of social activities as explanatory variables for screening compliance. In order to
control for variations in the supply of health care at the regional level we use the waiting time
in months for outpatient surgery examination. This is defined the average at regional level of
the individual responses on the number of months waited for their last outpatient
examination.
14
Recent work shows that social networks affect the incidence of health conditions and
health care utilization, see Pescosolido and Levy (2002), Devillanova (2007), and Deri
(2005). We therefore consider social activities as an additional channel through which people
acquire information on health (by word-of-mouth or observational learning). We rely on a set
of questions on seven kinds of activities engaged in the month prior to the interview.
15
We
convert the seven variables into a score of 0 to 7. Country dummies are included in all
specifications to account for institutional and cultural differences. Sample means for variables
used in the estimation are reported in Table 3 separately for those who undertake
mammography and colonoscopy tests and for those who don’t.
The main parameter of interest is
positive value would mean that education and
GP quality are complements, a negative value would imply they are substitutes. However,
there are at least three reasons to expect the estimate of
to be biased. First, even though the
access to GP is universal and free of charge, individuals are allowed to choose their GP and
eventually change him without any monetary cost. Therefore, GP quality might be
endogenously determined. Second, our index is based on self reported answers. The failure to
recall whether the GP performed a certain assessment might be correlated with unobservable
traits that are correlated with the level of education. Third, even though the assessments
should be performed regardless of the patient health history, in practice GPs might decide to
perform them only on individuals with a specific health history or particular symptoms. It is
hard to determine the direction of the bias a priori. In the data we observe that the GP index is
negatively correlated with years of education (Figure 2). This might be due to the fact that
individuals with higher levels of education (and income) might bypass the GP and rely
primarily on specialists. This is confirmed by the positive correlation between years of
14
Our results are robust to alternative measures of the waiting time.
15
Specifically: (1) voluntary or charity work; (2) care for a sick or disabled adult; (3) help for family, friends or
neighbours; (4) attendance of an educational or training course; (5) participation in a sport, social or other kind
of club; (6) taking part in a religious organization; (7) taking part in a political or community-related
organization.
16
In a probit model the marginal effects depend on the parameter as well as on the density function. For
notational simplicity in the text we refer to the relevant parameter to denote the marginal effect.
16
education and the proportion of specialists visits, as defined by the ratio of contacts with
specialists over the total number of contacts with doctors in the last 12 months (Figure 3).
To address these concerns we instrument GP quality using the flu vaccination coverage
for high risk individuals and the smoking rate measured at the regional level. The first
variable is the regional proportion of individuals aged 65 or above who answered yes to the
question whether they got a flu shot in the year before the survey. The second variable is the
ratio of the number of smokers over the total population in the region. According to the
OECD (2004), the former is an indicator of quality of preventive care in the area, while the
second measures the quality of health promotion. It is understood that the health system can
affect the vaccination coverage in risk groups through medical education, awareness
campaigns and establishing remind and recall systems. Both educational campaigns and
cessation counseling have been assigned an important role in reducing smoking rates. The
rationale behind our instruments is straightforward: on average, in regions with higher
investments in preventive care and health promotion it is easier to find a better GP. Using the
territorial units classification (NUTS) adopted by EUROSTAT, we are able to calculate our
measures of investments in primary health care for 102 regions.
The identification assumption is that, conditional on the average waiting time in the
region, flu vaccination coverage and smoking rate can affect the take up of colonoscopy and
mammography only by affecting the average quality of general practitioners. A potential
violation might rise if our instruments proxy for the quality of health care services other than
the primary care ones. In order to bolster confidence in the identifying assumption, we test
whether flu vaccination coverage and smoking rates are correlated with two indicators that are
extensively used to measure the quality of secondary care: the number of hospital beds and
the number of physicians in the region.
17
Reassuringly, we can never reject the null
hypothesis of zero correlation.
4.1. Mammography
Table 4 reports the results for mammography. In order to test whether education and GP
quality are complements or substitutes, we first allow for the interaction between years of
education and the GP quality score. The results of the baseline probit estimates are reported in
17
These two indicators are provided in the EUROSTAT REGIO database but they are not available for the full
list of regions included in our sample.
17
column 1. Consistent with previous evidence, education has a positive and significant effect
on the probability of undertaking the test. An extra year of education increases the probability
by 0.9 percentage points. GP quality is positively and significantly correlated with the
probability of taking the test. The marginal effect on the interaction between the GP score and
years of education suggests a weak and non-significant substitutability between these two
variables.
In our sample of elderly women we find that the probability of taking the test falls with
age, by 1.2 percentage points per year. Since medical guidelines prescribe that women over
50 should take the test every two years, this result may seem surprising, but it is consistent
with many studies in the medical literature - for instance Burack, Gurney, and McDaniel
(1998).
18
The probability increases by almost 10 percent for married women indicating that
prevention is more prevalent among couples. Interestingly, we also find that it is significantly
higher for women with children (5.8 percentage points).
The income coefficient signals that households’ resources are positively correlated with
screening, even though the correlation is weak and significant only at the 10 percent
confidence level. A plausible explanation is that women in the age group 50-69 are allowed to
screen free of charge in all the countries examined. For older women the cost of the exam is
largely subsidized.
The effect of social activities is positive and precisely estimated. The coefficient
indicates that an additional social activity raises test compliance by just below 2 percentage
points, suggesting that social interactions increase people’s awareness of health risks and
lower the cost of acquiring health-related information.
Our primary interest here is measuring the quality of the information provided by health
professionals, but other aspects of health supply might also be relevant to the decision to
screen. In particular, long waiting times might discourage women from undertaking the test.
This is confirmed by the negative and significant effect of the average number of months
individuals have to wait before receiving an outpatient treatment.
Since for the elderly educational attainments might not reflect current ability to process
information, we also investigate the role of current cognitive skills. The cognitive psychology
literature identifies four main domains of ability: orientation, memory, executive function and
language. These abilities depend on genetic endowments and environmental factors, such as
18
The results might be due also to a cohort effect, which cannot be distinguished from a genuine age effect in
cross-sectional data.
18
childhood home environment and education, and change over time, see Richards et al. (2004).
In particular we test whether planning and executive functions (verbal fluency) increase the
propensity to screen for breast cancer and whether this effect is mediated by the quality of the
general practitioner. Results are reported in column 2.
19
Fluency has a strong a significant effect on the probability of taking a mammography.
One standard deviation increase in the fluency score increases the probability of screening by
2.5 percentage points. The effect of the GP score is line with the one we have discussed
above. The interaction between the GP quality score and the verbal fluency indicator displays
a negative and slightly significant marginal effect. Remarkably, controlling for the verbal
fluency is not sufficient to explain the large and significant effect of years of education.
Our results suggest a weak and not significant substitutability between
education/cognitive abilities and GP quality but so far we have not taken into account the
potential endogeneity of the GP score. We use a control function approach to test whether
spurious correlation and endogeneity drives our results. The GP score is instrumented using
the quartiles of the flu vaccination coverage and the smoking rate at regional level. The IV
estimates in columns 3 and 4 of Table 4 show that, on average, the effect of the quality of
primary care physicians is not statistically different from zero. Most importantly, when we
allow the effect of education and verbal fluency to vary with the quality of the general
practitioner, we find evidence of a strong and significant complementarity. The effect of an
additional year of education on the propensity to screen for breast cancer increases by 0.5
percentage points if the GP score is exogenously increased by one unit. Similarly, the
marginal effect of verbal fluency increases by 0.2 percentage points when the GP score
increases by one unit.
4.2. Colonoscopy
We turn now to the analysis of the relation between education and the propensity for
colonoscopy. Results are reported in Table 5. The first regression shows that the effect of an
extra year of education is quantitatively comparable to the one we have found for
mammography. Similarly, there is a positive a slightly significant correlation between GP
19
In SHARE the fluency indicator is obtained by asking respondent to name as many animals as she or he can in
exactly one minute. Each respondent is then given a score, which is equal to the number of animals that she or he
can name. More details on this indicator can be found in Dewey and Prince (2005), and Christelis, Jappelli and
Padula (2006).
19
quality and the propensity to screen for colon cancer. The interaction between years of
education and GP quality score shows a negative and not significant effect, in line with the
results we found for mammography.
Consistent with the fact that the test is universally recommended both to males and
female above age 50, the marginal effect of the gender dummy is not statistically different
from zero. Age and the presence of a partner have an effect similar to those found for
mammography. The probability of undertaking a colonoscopy increases with income (by 1.6
percent for every 1 percent increase in income). It is also positively associated with social
activities (1.9 points for each additional social activity). These results offer additional support
for the hypothesis that formal and informal channels both increase awareness of health risks.
Also in this case, longer waiting times have a negative and significant effect on the decision
to screen for colon cancer.
Unlike our previous results, fluency has a very small and not significant effect on the
probability of screening. We also find a weak and not significant substitutability between
cognitive skill and the ability of the GP. Interestingly, when we control for cognitive skills,
age has a positive and significant effect on the decision to screen for colon cancer.
As for mammography, the picture changes when we control for the possible endogeneity
of the GP score. The marginal effects of the interactions terms are positive and strongly
significant. Reassuringly, the size and the significance level of the effects are in line with the
ones for mammography. Also in this case the results point towards a strong and significant
complementarity between education (verbal fluency) and quality of the general practitioner.
Two important conclusions can be drawn from these results. First, it is important to take
into account the potential endogeneity of the GP choice when studying how the quality of
physicians affects health related behaviors. Second, the strong effect of education on the
propensity to undertake preventive screening can be partially explained by the higher ability
to process and internalize the information received by the health care system.
5. Conclusion
The positive association between health outcomes and education is widely documented,
but little is known about the actual source of this correlation. The most common explanations
emphasize the role of preferences and resources. In this paper, we seek to determine whether
20
information explains the nexus between schooling and the demand for health procedures. In
order to isolate the role of information, we analyze whether information obtained from
primary health care institutions acts as a complement to or as a substitute for schooling and
cognitive abilities in patients’ decision to have two cancer screening tests done:
mammography and colonoscopy.
To proxy for information we use an indicator of general practitioner quality and assume
that better-quality GPs are more valuable, in giving their patients better (more relevant and
timely) information. Once we control for the possible endogeneity of the GP quality, we find
that the health-education gradient is steeper for those who have a better GP. The most likely
explanation for our analysis of compliance is that better educated individuals screen more
because are more likely to internalize the information received by their GPs. In a nutshell,
while everyone has access to a GP, only the better educated can take full advantage of the
information provided by the GP. In addition, the results highlight the importance of social
interactions: who are more socially active individuals are also more likely to have the tests
run.
Our results have three important implications. First, estimates of the health-education
gradient are biased unless there is an explicit control for the quality of the information
provided by the health care system. Second, external sources of health-related information
and education are at least in part complements. Finally, since information provided by the
general practitioner does not reduce health disparities, targeted programs should be designed
to increase individual awareness on virtuous health behaviors.
21
References
Avendano, M., A. Aro, and J. P. Mackenbach (2005), “Socio-economic disparities in physical
health in 10 European countries,” in Health, Aging and Retirement in Europe: First
Results from the Survey of Health, Aging and Retirement in Europe, A. Börsch-Supan,
A. Brugiavini, H. Jürges, J. Mackenbach, J. Siegriest, and G. Weber, eds. Mannheim:
Mannheim Research Institute for the Economics of Aging.
Banks, J., M. Marmot, Z. Oldfield, and J.P. Smith (2007), “The SES health gradient on both
sides of Atlantic,” IFS Working Papers W07/04.
Börsch-Supan, A., A. Brugiavini, H. Jürges, J. Mackenbach, J. Siegriest, and G. Weber
(2005), Health, Aging and Retirement in Europe: First Results from the Survey of
Health, Aging and Retirement in Europe. Mannheim: Mannheim Research Institute for
the Economics of Aging.
Burack, R. C., J. G. Gurney, and A. M. McDaniel (1998), “Health Status and Mammography
Use Among Older Women,” Journal of General Internal Medicine 13, 366-72.
Cottet, V., A. Pariente, B. Nalet, J. Lafon, C. Milan, S. Olschwang, J. Faivre, C. Bonaitti-
Pellie and C. Bonithon-Kopp (2006), “Low Compliance with Colonoscopy Screening in
First-Degree Relatives of Patients with Large Adenomas,” Alimentary Pharmacology
and Therapeutics 24, 101-09.
Christelis, D., T. Jappelli and M. Padula (2006), “Cognitive Abilities and Portfolio Choice,”
CEPR Discussion Paper n. 5375.
Cutler, D., and A. Lleras-Muney (2006), “Education and Health: Evaluating Theories and
Evidence,” NBER Working Paper n. 12352.
Cutler, D., and A. Lleras-Muney (2007), “Understanding Health Differences by Education,”
NBER Working Paper n. 12352, Department of Economics, Princeton University,
mimeo.
Deri, C. (2005), “Social Networks and Health Service Utilization,” Journal of Health
Economics 24, 1076-107.
Devillanova, C. (2007), “Social Networks, Information and Health Care Utilization: Evidence
from Undocumented Immigrants in Milan,” Journal of Health Economics
(forthcoming).
De Walque, D. (2007), “How Does the Impact on HIV/AIDS Information Campaign Vary
with Educational Attainment? Evidence from Rural Uganda,” Journal of Development
Economics 84, 686-714.
22
Dewey, M. E., and M. J. Prince (2005), “Cognitive Function.” In Health, Aging and
Retirement in Europe: First Results from the Survey of Health, Aging and Retirement in
Europe, A. Börsch-Supan, A. Brugiavini, H. Jürges, J. Mackenbach, J. Siegriest, and G.
Weber, eds. Mannheim: Mannheim Research Institute for the Economics of Aging.
Grol, R., M. Wensing, J. Mainz, H. P. Jung, P. Ferreira, H. Hearnshaw, P. Hjortdahl, F.
Olesen, S. Reis, M. Ribacke and J. Szecsenyi (2000), “Patients in Europe Evaluate
General Practice Care: An International Comparison,” The British Journal of General
Practice 50(460), 882-7.
Grossman, M., and R. Kaestner (1997), “Effects of Education on Health,” in The Social
Benefits of Education, J.R. Behrman and N. Stacey eds. Ann Arbor: University of
Michigan Press.
Holland, W., S. Stewart and C. Masseria (2006), “Screening in Europe,” European
Observatory on Health Systems and Policies, Policy Brief.
Kenkel, D.S. (1991a), “Health Behavior, Health Knowledge, and Schooling,” Journal of
Political Economy 99, 287-305.
Kenkel, D.S. (1991b), “What You Don't Know Really Won't Hurt You,” Journal of Policy
Analysis and Management 10, 304-9.
Kenkel, D.S. (1994), “The Demand for Preventive Medical Care,” Applied Economics 26,
313-25.
Lahema, E., P. Martikainen, M. Laaksonen and A. Aittomäki (2004), “Pathways Between
Socioeconomic Determinants of Health,” Journal of Epidemiology and Community
Health 58, 327-32.
Lleras-Muney, A. and S. Glied (2003), “Health Inequality, Education and Medical
Innovation,” NBER Working Paper n. 9738.
Mackenback, J. P., V. Bos, O. Andersen, M. Cardano, G. Costa, S. Harding, A. Reid, Ö.
Hemström, T. Valkonen and A. E. Kunst (2003), “Widening Socioeconomic Inequalities
in Mortality in Six Western European Countries,” International Journal of
Epidemiology 32, 830-837.
Morris, S. and H. Gravelle (2006), “GP supply and obesity,” Centre for Health Economics,
University of York; CHE Research Paper 13.
Mullahy, J. (1999), “It'll Only Hurt a Second? Microeconomic Determinants of Who Gets Flu
Shots,” Health Economics 8, 9-24.
OECD (2004), “Selecting Indicators for the Quality of Health Promotion, Prevention and
Primary Care at the Health Systems Level in OECD countries,” OECD Health Technical
Paper 16.
23
Pescosolido, B.A. and J.A. Levy (2002), “The Role of Social Networks in Health, Illness,
Disease and Healing: The Accepting Present, The Forgotten Past, and The Dangerous
Potential for a Complacent Future,” Social Networks & Health 8, 3-25.
Picone, G., F. Sloan and D. Taylor Jr. (2004), “Effects of Risk and Time Preference and
Expected Longevity on Demand for Medical Tests,” The Journal of Risk and
Uncertainty 28, 39-53.
Richards, M., B. Shipley, R. Fuhrer and M. E. J. Wadsworth (2004), “Cognitive Ability in
Childhood and Cognitive Decline in Mid-Life: Longitudinal Birth Cohort Study,”
British Medical Journal 328 (7439), 552 – 554.
Scott, A. (2000), “Economics of General Practice,” Handbook of Health Economics, A. J.
Culier and J. P. Newhouse, eds. Amsterdam: Elsevier.
Simoens, S. and J. Hurst (2006), “The Supply of Physician Services in OECD Countries,”
OECD Health Working Papers, No. 21, OECD Publishing.
Urban, N., G. L. Anderson and S. Peacock, (1994), “Mammography Screening: How
Important is Cost as a Barrier to Use?” American Journal of Public Health 84(1), 50-55.
Wooldridge, J, (2002), “Econometric Analysis of Cross Section and Panel Data,” MIT Press.
24
Figure 1
Probability of being advised to get a flu vaccination
0 .1 .2 .3 .4 .5
0123456
Probability of being advised
GP score
Note. The figure plots the probability of an individual aged 65+ being advised to get a flu
vaccination in the year before the survey against the GP score.
25
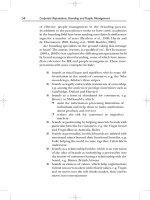
Figure 2
Quality of General Practitioner and Education
Note. The figure plots the GP quality score against years of education. The sample includes all
the individuals in the age group 50-85.