Tài liệu Education and Health in G7 Countries: Achieving Better Outcomes with Less Spending docx
Bạn đang xem bản rút gọn của tài liệu. Xem và tải ngay bản đầy đủ của tài liệu tại đây (485 KB, 52 trang )
WP/07/263
Education and Health in G7 Countries:
Achieving Better Outcomes with
Less Spending
Marijn Verhoeven, Victoria Gunnarsson,
and Stéphane Carcillo
© 2007 International Monetary Fund
WP/07/263
IMF Working Paper
Fiscal Affairs Department
Education and Health in G7 Countries: Achieving Better Outcomes with Less Spending
Prepared by Marijn Verhoeven, Victoria Gunnarsson, and Stéphane Carcillo
Authorized for distribution by Gerd Schwartz
November 2007
Abstract
This Working Paper should not be reported as representing the views of the IMF.
The views expressed in this Working Paper are those of the author(s) and do not necessarily represent
those of the IMF or IMF policy. Working Papers describe research in progress by the author(s) and are
published to elicit comments and to further debate.
Enhancing the efficiency of education and health spending is a key policy challenge in G7
countries. The paper assesses this efficiency and seeks to establish a link between differences
in efficiency across countries and policy and institutional factors. The findings suggest that
reforms aimed at increasing efficiency need to take into account the nature and causes of
inefficiencies. Inefficiencies in G7 countries mostly reflect lack of cost effectiveness in
acquiring real resources, such as teachers and pharmaceuticals. We also find that high wage
spending is associated with lower efficiency. In addition, lowering student-teacher ratios is
associated with reduced efficiency in the education sector, while immunizations and doctors’
consultations coincide with higher efficiency in the health sector. Greater autonomy for
schools seems to raise efficiency in secondary education.
JEL Classification Numbers: H11, H51, H52, I12, I28
Keywords: Expenditure efficiency; health sector reform, education sector reform, G7
Authors’ E-Mail Addresses: , ,
2
Contents
Page
I. Introduction and Main Conclusions .......................................................................................4
II. Education and Health Spending, Outcomes, and Economic Growth: Background and
Literature Review.......................................................................................................................5
III. Spending and Outcomes in Education and Health: Empirical Analysis..............................6
A. Trends in Education and Health Spending and Outcomes........................................7
B. The Relative Efficiency of Education and Health Spending...................................11
C. Achieving Better Outcomes with Lower Spending.................................................14
IV. Concluding Remarks .........................................................................................................18
Tables
1. Trends in Health and Education Spending, 1995–2003.........................................................9
2. Trends in Health and Education Outcomes .........................................................................10
3. Efficiency of Education and Health Spending in G7 Countries Relative to the OECD ......12
4. Spending and System Efficiency in Education and Health .................................................13
Figures
1. Total Education Spending per Student by Level of Education, 2003....................................8
2. Total Health Spending per Capita by Source, 1998–2001.....................................................8
3. Efficiency and the Best-Practice Frontier ............................................................................22
4. Secondary Education Spending and Average PISA Mathematics Scores ...........................41
5. Secondary Education Spending and the Distribution of PISA Mathematics Scores ...........41
6. Secondary Education Spending and Upper Secondary Graduation.....................................42
7. Tertiary Education Spending and Tertiary Graduation Rates..............................................42
8. Public Health Spending and HALE .....................................................................................43
9. Public Health Spending and Standardized Death Rates ......................................................43
10. Public Health Spending and Infant Mortality ....................................................................44
11. Public Health Spending and Child Mortality.....................................................................44
12. Public Health Spending and Maternal Mortality ...............................................................45
13. Teacher Salary in Secondary Education and GDP ............................................................45
Appendixes
I. Data, Data Envelopment Analysis, and Second-Stage Analysis ..........................................20
II. Tables and Figures ..............................................................................................................28
Appendix Tables
5. Links Between Economic Growth and Spending and Outcomes in Education and Health 28
6. Education and Health Spending...........................................................................................33
7. Outcome Indicators in Education.........................................................................................33
8. Outcome Indicators in Health ..............................................................................................34
9. Intermediate Output Indicators in Education.......................................................................35
3
10. Intermediate Output Indicators in Health ..........................................................................36
11. Correlations of Bias-Corrected Efficiency Scores and Associated Factors for Secondary
and Tertiary Overall Education Spending................................................................................37
12. Correlations of Bias-Corrected Efficiency Scores and Associated Factors for Public
Health Education......................................................................................................................38
13. Regression Results for Overall Education Spending Efficiency Scores............................39
14. Regression Results for Public Health Spending Efficiency Scores ...................................40
References................................................................................................................................46
4
I. INTRODUCTION AND MAIN CONCLUSIONS
A key policy challenge in G7 countries is to improve the performance of education and
health systems while containing their cost. Education and health outcomes are critically
important for social welfare and economic growth and thus, spending in these areas
constitutes a large share of public spending. But there is concern about the efficiency of such
spending. In education, there are questions about the ability of school systems to maximize
the potential of students and respond effectively to changes in the demand for education
outcomes. In health, there is concern about the rapid rise of the cost of health care and the
impact on competitiveness, as well as trade-offs between the efficiency and equity of health
systems.
This paper attempts to assess the efficiency of education and health spending in G7 countries.
It asks whether countries could achieve better education and health outcomes at current
levels of spending or, conversely, whether countries could have the same outcomes at lower
levels of spending. We seek to establish a link between observed differences in efficiency
across G7 countries and discuss the role of policy and institutional factors in explaining
efficiency differences. The paper also discusses efficiency-enhancing reforms for the
education and health sectors. The analysis involves addressing complicated issues of what
drives outcomes in education and health and should be regarded as exploratory. Follow-up
work on data and other parts of the analysis are needed for more definitive answers.
The paper is organized as follows. Section II provides the background and relevant literature
for the analysis. Section III describes trends in education and health spending and outcomes
in G7 countries. It also explores the issue of how efficiency in the education and health
sectors in the G7 can be measured, and how observed differences between countries may be
related to policy choices and institutions. Section IV makes some suggestions for reforms in
the education and health sectors in G7 countries. The technical aspects of the analysis are
elaborated in Appendix I.
Based on the quantitative analysis of education and health spending and outcomes for the G7,
this paper finds that:
•
Public spending on education and health systems varies greatly in G7 countries, and
so do education and health outcomes. Spending is particularly high in relation to
outcomes in education and health in France, Germany, the U.K., and the U.S.; that is,
the question of how to increase the efficiency of spending on education and health is
most relevant for these countries. On the other hand, Canada’s education spending is
relatively efficient, as is health spending in Italy and Japan.
•
Part of the differences in spending efficiency can be attributed to exogenous factors
such as GDP, demographics, and differences in lifestyle.
5
•
Policies and institutions are also associated with differences in efficiency. In
particular, countries that spend a relatively large share of their education and health
budgets on wages and salaries tend to be less efficient. Also, lower student-teacher
ratios are associated with reduced efficiency in the education sector, while
immunizations and doctors’ consultations (but not the number of doctors per se) are
positively correlated with efficiency in the health sector. Greater autonomy for
schools seems to raise efficiency in secondary education.
•
Effective education and health reform should aim at enhancing efficiency. This
should take into account the stage at which the inefficiencies arise. Further, reforms
should seek to balance devolution (of responsibility and resources) and enhanced
market competition with regulation to ensure accountability.
•
Cross-country studies, such as this one, can provide important insights into policy
challenges that countries face. However, further work on data and sectoral issues is
needed to deepen the findings of this paper.
II. EDUCATION AND HEALTH SPENDING, OUTCOMES, AND ECONOMIC GROWTH:
BACKGROUND AND LITERATURE REVIEW
A large volume of research has emphasized the importance of education outcomes to human
development, economic growth, and productivity.1 However, the findings also note the mixed
evidence for the relationship between education spending and student performance in
developed nations. Recent G8 statements have recognized the need to improve all aspects of
the quality of education and the promotion of high standards in education of mathematics,
science, technology, and foreign languages.2
On health issues, the G7 countries have focused on complex issues of high and rapidly rising
cost and concerns about equity. Cost-enhancing technological advances and, to a lesser
extent, aging populations and increased demand for health services as populations become
wealthier, are pushing up health care prices faster than general price levels. This has
prompted governments to introduce measures to reduce the cost of health care (Cutler, 2002;
Newhouse, 1992). But efforts in G7 countries to constrain health spending by rationing or
increasing competition have run into concerns about disadvantaged groups’ access to health
care.
1
See Table 5 for a comprehensive literature review of the association between human development and
economic growth.
2
See the Moscow Declaration of the G8 Ministerial Meeting on Education (June 1–2, 2006), available on the
Internet at and the G8 Statement on Education for
Innovative Societies in the 21st Century of July 16, 2006, available at />
6
A key issue in the debate about education and health spending is how (and how strongly) it
translates into sectoral outcomes and economic growth. Underlying the policy discussions on
education and health is a concern that public and private spending is high in relation to
outcomes (education attainment, health status, and economic growth). Prior research on this
has yielded the following insights (see Table 5):
•
Education attainment is a key driver of economic growth, with attainment at higher
levels of education gaining importance as economies become more developed. Health
status is also found to have a positive impact on growth.
•
However, the evidence for a positive relationship between education spending and
attainment is mixed, with a number of studies finding no evidence of a statistically
significant relationship. Similarly, there is limited evidence for a positive link
between health spending and health status. But public spending has been found to
benefit the poor by enhancing their access to health services.
•
Selected policies, institutions, and environmental factors, on the other hand, have a
clear impact on education attainment. In particular, family background and teacher
quality have been identified as important explanatory variables for student
achievement. School autonomy and emphasis on assessing student performance are
likely to raise education attainment, while teacher unions’ influence may have a
negative impact. The effect of other factors on education attainment is ambiguous;
these include the impact of class size, decentralization, and the relative importance of
public and private education.
•
Key factors for explaining health status include lifestyle (e.g., the consumption of
alcohol and tobacco, and diet), income level, occupational and socioeconomic status,
urbanization, and medical technology. In addition, education attainment is an
important explanatory factor for health outcomes. As in education, the impact of the
mix of private and public spending on outcomes is not clear.
•
Improved achievement at lower levels of education promotes both equity and
economic growth. However, improved achievement at higher levels of education may
benefit the well-off most. In health, there is a strong tradeoff between policies aimed
at enhancing cost effectiveness of spending and improving the equity of outcomes.
III. SPENDING AND OUTCOMES IN EDUCATION AND HEALTH: EMPIRICAL ANALYSIS
This section discusses cross-country empirical evidence on the relationship between spending
and outcomes in the education and health sector. It starts with a description of recent trends
in education and health spending and outcomes. Then, differences in the relationship between
spending and outcomes are assessed for G7 countries. Finally, an attempt is made to identify
factors that may affect these differences.
7
A. Trends in Education and Health Spending and Outcomes
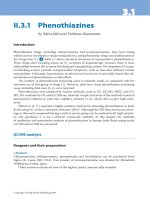
Spending on education and health varies considerably within the group of G7 countries.3
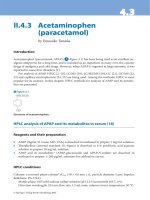
Total education spending (including funded from private sources) has been considerably
higher in the U.S. than in other G7 countries, particularly at the tertiary level (Figure 1 and
Table 6 in Appendix II). Average G7 spending on primary and secondary education is near
average levels in the OECD but G7 countries spend more on average on tertiary education.4
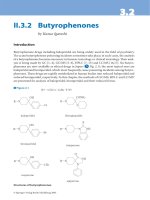
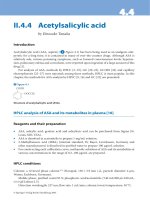
Public health spending is highest in Germany and the U.S., and lowest in Italy, Japan, and the
U.K. (Figure 2 and Table 6).5 Average public health spending in OECD countries is below
spending levels in G7 countries.
G7 countries have markedly increased overall (public and private) spending on education and
health in real terms over the last decade. Between 1995 and 2003, real overall spending per
student from public sources increased at an average rate of 2.2 percent per year in primary
and secondary education and 1.8 percent in tertiary education (Table 1). Spending trends
differed considerably between G7 countries, with Germany posting relatively small spending
increases and Canada and Japan increasing their spending at rates well above the average for
the G7. Average health expenditure from public and private sources increased by 3.8 percent
per year in real per capita terms in the G7 over the period 1995–2003. Increases in health
spending were significantly larger for the U.K. and U.S. than for Germany.
3
Spending is measured in equivalent U.S. dollars using GDP purchasing power parity (PPP). This is intended to
eliminate unit cost differences across countries and to measure spending such that a similar package of
education and health services could be bought at the same level of spending across countries. In education,
expenditure is measured per student in PPP terms by level of education: primary, secondary (including postsecondary non-tertiary), and tertiary education. These per-student education expenditure data are only available
for overall spending funded both by public and private sources (the complicated nature of the arrangements for
funding of education institutions prevent a breakdown between spending funded from public and from private
sources). Health resources are measured as health spending per capita in PPP terms; data on public and private
spending are separately available. Data on spending and outcomes in education are from OECD (2006a) and the
OECD PISA database available at For health, the source
is the OECD at />and OECD (2005). See Appendix I for more details on data issues.
4
Mexico and Turkey are outliers in many respects, and were excluded from the OECD group for the analysis of
this paper.
5
Italy may not be part of the low-spending group any longer as its public spending on health increased
markedly in the last few years.
8
Figure 1. Total Education Spending per Student by Level of Education, 2003
(PPP dollars)
25,000
20,000
15,000
10,000
5,000
0
US
France
Italy
G-7
Primary
OECD 1/
Secondary
UK
Japan
Tertiary
Germany Canada
2/
Source: OECD Education at a Glance 2006, www.oecd.org/edu/eag2006.
1/ Excludes Mexico and Turkey (because of outlying data). Countries are ranked by level of total
secondary education spending.
2/ Data for primary and secondary education are averaged for Canada.
Figure 2. Total Health Spending per Capita by Source, 1998–2001
(Period average in PPP dollars)
5,000
4,000
3,000
2,000
1,000
0
Germany
US
France
Canada
G-7
Public
Japan
UK
Italy
OECD 1/
Private
Source: OECD Health Data 2006, www.ecosante.fr.
1/ Excludes Mexico and Turkey (because of outlying data). Countries are ranked by level of public
health spending.
9
Table 1. Trends in Health and Education Spending, 1995–2003
Education
Real overall spending
(public and private, average
annual increase in percent) 1/
Canada
France
Germany
Italy
Japan
U.K.
U.S.
G7
OECD 3/
Primary and
secondary
education
2.2
Tertiary
education
3.1
Public
spending
(cumulative
increase in
percent of
GDP)
-1.6
...
...
...
0.6
1.2
3.0
2.9
3.1
1.0
3.1
1.7
0.0
1.2
-0.1
-0.1
0.0
0.3
0.4
2.2
3.6
1.8
0.7
-0.2
0.2
Health
Real overall
Public
spending
spending
(public and
(cumulative
private,
average annual increase in
percent of
increase in
GDP)
percent) 2/
3.4
0.4
3.2
1.0
2.0
0.2
3.1
1.1
0.8
...
4.2
1.0
3.8
0.8
3.3
5.2
0.8
0.8
Sources: OECD Education at a Glance 2006, www.oecd.org/edu/eag2006; OECD Health Data
2006, www.ecosante.fr; and IMF staff calculations.
1/ The average annual real percent increase over 1995–2003 in per student public and private
spending in primary and secondary (including post-secondary non-tertiary) and tertiary
education.
2/ The average annual increase in real per capital health public and private spending over
1995–2003.
3/ Excludes Mexico and Turkey (because of outlying data).
The rapid increase in the cost of health care has put pressure on public health budgets in G7
countries. Average public spending on health increased from 6.4 percent of GDP in 1995 to
7.1 percent of GDP in 2003. This increase was highest for France, Italy, and the U.K. (see
Table 1). Public spending for education declined slightly in the G7 countries, from an
average of 4.8 percent of GDP in 1995 to 4.6 percent of GDP in 2003. This mostly reflected
a substantial decline in public education spending in Canada.6
6
Public education spending in Canada fell from 6.2 percent of GDP in 1995 to 4.6 percent of GDP in 2003.
However, because of rapid increases in real GDP, this still allowed for substantial increases in real spending per
student in Canada.
10
Table 2. Trends in Health and Education Outcomes
Canada
France
Germany
Italy
Japan
U.K.
U.S.
PISA
mathematics
scores 1/
1.9
1.2
3.7
2.7
-1.1
...
1.2
Education
Upper
secondary
graduation
rate 2/
3.4
14.3
-1.2
23.1
0.0
7.7
-1.1
Health
Tertiary
graduation
rate 3/
12.6
58.3
-14.8
25.0
15.6
20.7
0.0
Standardized
death rates 4/
-1.6
-0.9
-2.2
-2.5
-2.8
-1.9
-1.4
Infant
mortality 5/
-1.5
-2.5
-2.9
-4.8
-4.4
-1.9
-1.2
G7
OECD 6/
1.6
1.9
6.6
8.2
16.8
14.8
-1.9
-2.0
-2.7
-3.7
Sources: OECD Education at a Glance 2006, www.oecd.org/edu/eag2006; OECD Health Data
2006, www.ecosante.fr; and IMF staff calculations.
1/ Percent difference in scores on comparable components of the PISA mathematics test
between the 2000 and 2003 rounds.
2/ Difference in the percent of the population that has attained upper secondary education
between the age group 35–44 and 25–34 in 2004.
3/ Percent difference in the percent of the population that has attained tertiary education
between the age group 35–44 and 25–34 in 2004.
4/ Annual percent change during 1995–2002.
5/ Annual percent change during 1995–2003.
6/ Excludes Mexico and Turkey (because of outlying data).
Education and health outcomes generally improved in G7 countries in recent years
(Table 2).7 Except for Japan, all G7 countries posted increases in the average test scores for
mathematics proficiency under OECD’s Programme for International Student Assessment
(PISA) between the 2000 and 2003 rounds.8 Improvements in education participation can be
gauged from trends in graduation rates of successive cohorts (i.e., if later cohorts have higher
graduation rates, education participation has increased over time). The current cohort of 25–
34 year olds is generally better educated than the preceding cohort which is presently aged
35–44 years, as indicated by the larger share that attained at least upper secondary and
7
8
See Tables 7 and 8 for levels of education attainment and health status in G7 countries.
PISA’s assessment focuses on the capabilities of 15 year-old students in reading literacy, mathematics literacy,
and science literacy. It also includes measures of general or cross-curricular competencies such as learning
strategies. The test scores for mathematics are very highly correlated with those for reading and science, and are
in many studies interpreted as representative of student test scores in secondary education (including OECD
2006a). But it is important to look at various indicators of achievement in conjunction. For instance, Table 2
shows that Germany achieved relatively large increases in PISA test scores while graduation rates dropped. This
raises the question whether improvements in education or the reduced participation in education drives the
higher test scores.
11
tertiary education in the younger of the two cohorts. France, Italy, and the U.K. posted the
highest gains, while there was no substantial progress in the U.S. and even a loss of
education attainment in Germany. In health, indicators of mortality (standardized death rates
and infant mortality) significantly improved in all G7 countries between 1995 and 2003, with
the most progress made by Germany, Italy, and Japan.
Trends in education and health outcomes are not closely related to spending trends in G7
countries. A comparison of Tables 1 and 2 shows that the U.K. achieved above-average
improvements in education outcomes with relatively modest increases in real spending, while
the U.S. achieved less with more additional resources. Similarly, trends in real health
expenditure and health status show that Germany has been able to achieve more gains with a
smaller increase in real resources than Canada, the U.K., and the U.S.9 These issues will be
investigated in more depth in the following section.
B. The Relative Efficiency of Education and Health Spending
The relative efficiency of education and health spending is assessed by comparing
expenditure levels and associated outcomes in G7 countries and other OECD countries. This
is done using the Data Envelopment Analysis (DEA) technique, which was developed for
estimating best-practice frontiers and relative efficiency in business applications. In this case,
DEA is used to assess the relationship between spending (inputs) and outcomes (production)
across countries. The general principle is that countries which achieve the same or better
outcomes with lower levels of spending than other countries in the sample are the most
efficient and determine the best-practice frontier.10 The relative spending efficiency of other
countries can be measured by how far away they are from the best-practice frontier. This
method is intuitively appealing and has the advantage of being flexible and parsimonious in
its assumptions. Appendix I provides a detailed discussion of DEA.
9
These results for Germany may, in part, reflect developments after the reunification and the impact of reforms
of the education and health systems of former East Germany.
10
The concept of efficiency in this application of DEA to spending is not completely analogous to the concept
of technical efficiency in the case of business units engaged in a particular commercial activity (e.g., bank
branches). In particular, the heterogeneity of countries needs to be taken into account for the present analysis.
Countries differ in many ways, and such differences may have an impact on spending and outcomes. The DEA
results mix inefficiencies in spending and sectoral policies with other differences between countries that affect
the relationship between spending levels and outcomes. For example, it may be more costly to provide the same
education and health services in countries with higher GDP per capita levels. Similarly, education and health
outcomes may differ between countries because of variations in the degree of urbanization and demographics.
So, in contrast to the more standard application of DEA for production units operating in very similar
environments and with clearly defined inputs and outputs, the efficiency results derived here do not provide an
accurate measure of the technical efficiency of the use of resources. Rather, they provide a measure of whether
the ratio of outcomes over spending is low relative to comparable countries (i.e., countries that achieved at least
as much in terms of outcomes) which may be for a variety of reasons including spending inefficiencies.
12
Education and health spending in the G7 countries are generally not among the most efficient
in the OECD (Figures 4–12). Japan is on the best-practice frontier for health-adjusted life
expectancy (HALE), standardized death rates, and infant mortality. This means that among
the OECD countries with health spending at or below Japan’s level, no country scored better
on these health outcomes. Table 3 shows how G7 countries are placed in the ranking of
efficiency scores in the sample of OECD countries. G7 countries generally rank in the
bottom two quartiles of the rank distribution (particularly France, Germany, the U.K., and the
U.S.). Yet, Canada ranks relatively high in education, and Italy and Japan rank relatively
high in health.
These initial findings for spending efficiency can be further disentangled by looking at the
different stages of the process that links spending and outcomes. In particular, it is useful to
separate the impact of spending on intermediate outputs (the first stage of the process from
spending to outcomes) and the impact of these intermediate outputs on outcomes (the second
Table 3. Efficiency of Education and Health Spending in G7 Countries
Relative to the OECD
(Distribution by quartiles of the ranking of efficiency scores for OECD countries) 1/
Percentile
Education 2/
Health 3/
1–25
Canada
26–50
51–75
France
Germany
Italy
Japan
U.K.
76–100
U.S.
Italy
Japan
Canada
France
Germany
U.K.
U.S.
Sources: OECD Education at a Glance 2006, www.oecd.org/edu/eag2006; OECD PISA,
OECD Health Data 2006,
www.ecosante.fr; and IMF staff calculations.
1/ Canada’s efficiency scores in education ranked, on average, at the 15th percentile of the
overall ranking of efficiency scores in the sample of OECD countries. This places Canada in the
top (1–25) quartile of the OECD ranking distribution. The rankings are based on the point
estimates of the input-oriented bias-corrected efficiency scores (see Appendix I).
2/ Based on overall (public and private) spending by level of education and associated outcome
indicators, including the mean and within-country variation in PISA scores for mathematics and
graduation rates for upper-secondary and tertiary education. The OECD countries are ranked
by efficiency score for each outcome indicator. Finally, the rankings for all education outcome
indicators are averaged to get the average country ranking for education spending.
3/ Based on average rankings of spending efficiency (see previous footnote) based on public
health spending and associated outcome indicators, including infant, child, and maternal
mortality rates, and healthy life expectancy and standardized death rates.
13
stage of the process).11 The link between spending and intermediate outputs reflects the cost
of procuring and producing the intermediate outputs, that is, issues of cost effectiveness.
Countries may also find that their education and health outcomes are low in relation to the
available intermediate outputs—in this paper this is referred to as system inefficiency. See
Appendix I for more details on these concepts.
For the most part, the relatively low average spending efficiency in G7 countries seems to
reflect issues of cost effectiveness, at least in tertiary education and health. Table 4 shows
that the majority of G7 countries have better system efficiency in education and health than
other OECD countries on average (i.e., the ratio shown for the G7 average is smaller
than 1).12 The results are especially striking for the U.K., which shows very high system
Table 4. Spending and System Efficiency in Education and Health 1/
Canada
France
Germany
Italy
Japan
U.K.
U.S.
G7
Secondary Education
Total
System
spending efficiency
efficiency
3/
2/
0.4
1.2
0.8
1.7
1.0
0.1
1.1
1.6
0.7
1.4
…
…
1.2
1.4
0.8
1.2
Tertiary Education
Total
System
spending efficiency
efficiency
3/
2/
…
…
1.1
0.6
1.3
1.5
0.8
0.1
1.2
1.7
1.3
0.4
1.8
0.8
1.2
0.9
Public
spending
efficiency
2/
1.4
1.2
1.4
0.6
0.4
1.5
1.9
1.2
Health
Total
spending
efficiency
System
efficiency
4/
1.6
1.3
1.5
0.7
0.4
1.1
2.0
0.9
1.1
1.6
0.6
0.7
0.1
0.8
1.2
0.8
Sources: OECD Education at a Glance 2006, www.oecd.org/edu/eag2006; OECD PISA,
OECD Health Data 2006,
www.ecosante.fr; and IMF staff calculations.
1/ Ratio of efficiency rankings of G7 countries and the average ranking in the sample of OECD
countries. A ratio of 1 implies that the country ranks at the average of the OECD sample; a lower ratio
signifies an above average efficiency and a ratio in excess of 1 implies that the country is less efficient
than OECD average. See Appendix I for a more detailed explanation of the underlying calculations.
2/ Based on efficiency rankings from Table 3.
3/ Based on efficiency rankings using as inputs the average of various intermediate education outputs
(see Table 9) and as production various outcome indicators (see Table 3 and Table 7).
4/ Based on efficiency rankings using as inputs the average of various intermediate health outputs
(see Table 10) and as production various outcome indicators (see Table 3 and Table 8).
11
Intermediate outputs are defined here as goods and services (e.g., school instruction hours and patient-doctor
consultations) procured with education and health spending and that are used to achieve outcomes (see
Appendix I). Indicators and data for key intermediate outputs are listed in Tables 9 and 10.
12
See Appendix I for more detail.
14
efficiency in both tertiary education and health, although spending efficiency in the U.K. is
well behind the OECD average. The average results for the G7 imply that lack of cost
effectiveness is a major driver of spending inefficiencies in the G7 in tertiary education and
health. This may be addressed by increasing competition between suppliers of goods and
services to education and health institutions and tackling overspending on specific spending
items (e.g., due to overstaffing). In secondary education, the situation is reversed, and G7
countries (except Germany) score worse on system efficiency than on overall spending
efficiency. This suggests that for secondary education, options for reducing public spending
may be found by assessing whether the mix of intermediate outputs is optimal for achieving
improved outcomes, or whether incentives for an effective use of intermediate outputs are
adequate.
The efficiency findings are reasonably robust and in line with results from similar
assessments of spending efficiency. The rankings of G7 countries do not change very much if
overall health spending is used in the efficiency analysis instead of public spending (see
Table 4). The findings also do not seem substantially affected by outliers or choice of
outcome indicator.13 Furthermore, the findings of this paper are broadly consistent with
findings from other research on the efficiency in education and health, although some results
differ due to variations in methodology, choice of measures for spending and outcomes, and
the selection of sample countries.14
C. Achieving Better Outcomes with Lower Spending
Strengthening the link between spending and outcomes would allow countries to achieve the
same outcomes at lower levels of spending or achieve better outcomes at the same level of
spending. In order to understand how countries can do this, it is important to determine
13
Without Mexico and Turkey in the dataset, the results are not driven by outlying observations. In addition, the
efficiency results are similar for different measures of outcomes in education and health (with the exception of
the education results for Germany, which are quite varied across outcome indicators).
14
For example, OECD (2006b) assesses the relationship between education spending and PISA test scores (both
the average and the distribution) in a framework that is very similar to that of this paper. Japan does better than
in the analysis of this paper, but otherwise the results are similar. Afonso and St. Aubyn (2004) find results that
are comparable to this paper (although relatively more favorable for Germany) for spending as the input item
and PISA test scores as the outcome indicator. Wilson (2005) considers school level data, and uses various
measures of input and production in his analysis of education. He finds more favorable results than this paper
for Italy, France, and the U.S. WHO (2000) and Greene (2004) use a stochastic approach to assess the link
between public health spending and HALE on the basis of a wide sample that covers low-income as well as
OECD countries. The main difference from our results is that G7 countries rank more highly, in particular
France. Afonso and St. Aubyn’s (2004) results are similar to this paper’s for health, although they show a better
rank for the U.K.
15
whether the DEA results are policy-related or reflect factors outside of the direct influence of
policy makers. This is done below through a statistical analysis of the efficiency results.15
Cross-country differences in efficiency results are associated with expenditure composition
and institutional arrangements in education and health. In particular, wage spending is
negatively associated with efficiency in education, while health efficiency tends to be lower
in countries with more health workers (Tables 11 and 12).16 This finding indicates that
reduced compensation spending may increase efficiency. However, it could also reflect the
possibility that countries with poor past education and health outcomes are spending more on
staffing. The mix of intermediate outputs is also important: lowering student-teacher ratios in
education is associated with lower efficiency, while immunizations seem to be a costeffective way of boosting health status, and thereby is associated with higher efficiency.17
Greater autonomy for schools and emphasis on academic ability in student selection for
schools seems to raise efficiency in secondary education, while decentralization and large
out-of-pocket payments are associated with lower efficiency in the health sector. In tertiary
education, efficiency is negatively associated with decentralization and private spending.
Finally, exogenous factors, such as GDP,18 urbanization,19 socioeconomic background, and
lifestyle also affect efficiency.
15
The results presented here are based on simple correlations and the results should be interpreted with caution.
For example, the analysis does not allow for firm conclusions on the direction of causaility. As a robustness
check, we also employed an innovative strategy for regression analysis of efficiency outcomes on associated
factors. The regression findings are very similar to the correlation findings but are affected by problems of serial
correlation. Appendix I discusses this second-stage analysis in more detail.
16
These results are based on correlations for OECD countries and should therefore not be generalized to other
countries. In fact, it is likely that the relationship between efficiency and many of the associated factors
identified here is not linear. That is, if spending on compensation is low, an increase in such spending could
result in increased efficiency as benefits exceed costs. But, at current levels of spending prevailing in the
OECD, the marginal cost of raising wage payments is more likely to exceed the benefits in most cases.
17
In addition, efficiency in secondary education is higher in countries where more schools report shortages in
supplies and library materials. This may reflect an emphasis on cost containment and effectiveness in countries
where many schools report such shortages, rather than that spending on school supplies and libraries is
inefficient.
18
Efficiency in education and health, as well as spending levels and outcomes, are highly correlated with GDP.
There are two possible main channels through which GDP can affect spending efficiency. First, a higher GDP is
associated with a higher cost of service provision (e.g., through the impact on teacher salaries), whereas there
are only limited options for productivity increases, especially in primary and secondary education (this is
Baumol’s disease—for a discussion and evidence for the U.S., see Nordhaus, 2006). Second, as populations
grow wealthier, they are likely to consume a larger and more varied package of education and health services,
which would include items that do not contribute to education attainment and health status as measured here
(e.g., medical care which is not directed at reducing mortality, including many types of cosmetic surgery).
19
Urbanization poses additional challenges in education and health, which likely accounts for the negative
impact on efficiency in education and health (e.g., see Bennett, 2003). This result is robust to the exclusion of
(continued)
16
For G7 countries looking to enhance the efficiency of their education and health spending,
the findings could have several implications:
•
The composition of spending in G7 countries tends to be tilted toward compensation,
which seems to hamper efficiency in both education and health.
For education, the evidence for a negative associated between overspending on
compensation and efficiency is quite strong (see Table 11). The negative association
between efficiency in achieving PISA test scores and student-teacher ratios suggest
that overstaffing may play a role. In addition, the literature suggests that salary levels
may also contribute to inefficiencies.20 In particular, it has been found that although
the quality of teachers is an important driver of educational attainment, higher
compensation does not in itself increase teacher quality (Blau, 1996, and Rivkin,
Hanushek, and Kain, 2005). Among the G7 countries, Japan, Germany, and Italy have
high wage bills in education. In Italy, a relatively low student-teacher ratio seems a
key driver for the relatively high costs of compensation. In Germany, on the other
hand, classroom sizes are relatively large and salary levels may be more of a factor in
inefficiencies.21
For health, the data strongly suggest that overstaffing is associated with efficiency
problems. Health employment density as well as general practitioner density are
negatively correlated with efficiency for all health outcome indicators. At the same
time, numbers of doctors’ consultations and hospital beds have a positive association
with the efficiency of spending for infant, child, and maternal mortality. It seems,
therefore, that how (and how often) health workers interact with patients matters for
improving health outcomes in a cost-effective manner.22 Several of the G7 countries
(Canada, France, Germany, and the U.S.) have a substantially higher number of
health practitioners than the OECD on average, pointing to a potential source of
inefficiency in these countries. The U.S. not only has a relatively high number of
health practitioners, but also markedly fewer doctors’ consultations per capita than
other G7 and OECD countries.
highly urbanized Luxembourg. Somewhat surprisingly, the data do not provide evidence for a higher cost of
service delivery in countries with large areas which are relatively sparsely populated.
20
This is difficult to verify through our analysis as salary levels are highly correlated with GDP, which makes it
hard to distinguish between the effect on efficiency of salary levels, GDP, and other factors that are highly
correlated with GDP (Table 13).
21
Figure 13 shows that teacher salaries in secondary education in Germany are relatively high in relation to
GDP per capita while salaries are lower in Italy.
22
Only partial data are available on salaries and wage payments in the health sector, which was not adequate to
draw conclusions on the nominal part of wage spending.
17
•
Policies at the school level is positively associated with the efficiency of education
spending, while the relation with decentralization is ambiguous. The devolution of
responsibility to the school level is positively correlated with efficiency scores: in
countries where more school principals have hiring authority, the efficiency scores of
PISA mathematics test scores and the distribution of scores are higher (see also
Woessmann, 2000). In Japan, Germany, and Italy—where efficiency scores for
education are relatively low—principal autonomy in hiring teachers is substantially
lower than in the OECD on average. Moreover, relying on student records for
admission to secondary school appears to be a cost-effective practice which boosts
efficiency scores of upper-secondary graduation rates. However, decentralization of
spending is not associated with higher or lower efficiency of spending in secondary
education, while it is negatively correlated with efficiency in tertiary education. This
echoes findings from the literature that the link between performance and
decentralization in education is ambiguous (see Table 5). This may reflect the need to
balance school autonomy and decentralization with accountability for results
(e.g., Woessmann, 2006), which may be a complicated task in the context of fiscal
decentralization.
•
The increasing cost of health care has prompted countries to institute reforms,
including by increasing out-of-pocket payments for users of health services. It is
therefore unsurprising that out-of-pocket payments are associated with lower
efficiency—countries where efficiency problems are large have raised out-of-pocket
payments to reduce inefficiencies and the fiscal burden posed by the health sector
(see Cutler, 2002). But it also suggests that such measures have only achieved limited
success and those countries remain relatively inefficient. Aside from the effect of outof-pocket payments, the share of private spending does not have an impact on
efficiency in health. This may reflect adverse selection issues related to private health
insurance and incentives for insured persons to overconsume health services.23 The
negative correlation between decentralization and health spending efficiency we find
23
Other factors do not appear to play a role in differences in inefficiencies across countries, although it seems
plausible that they would have an impact. For example, the share of health spending funded through social
security schemes and private health insurance does not help to explain differences in spending inefficiencies in
health. Similarly, the relative share of personal versus collective health care as a percent of public health
expenditures does not matter. Also, differences in population age structure and income inequality (as measured
by the Gini coefficient) does not affect the relationship between health and education spending and outcomes.
Finally, although there is strong evidence of the effects of education attainment on health outcomes and health
status on education outcomes, we cannot distinguish these cross-sectoral effects from the correlation of GDP
with education and health efficiency. However, the statistical analysis shows no impact of education attainment
on health efficiency and health status on education efficiency after controlling for GDP.
18
for the OECD does not have a clear implication for the G7. It reflects the relatively
high efficiency of EU new member states, where a relatively small share of health
spending is allocated at the subnational level.
IV. CONCLUDING REMARKS
The analysis of this paper breaks new ground by assessing the relationship of spending
efficiency in education and health with policies and institutions. The question of how better
outcomes can be achieved at a lower cost is central to the concept of efficiency. This is also a
critical question for fiscal policy, and a better understanding of what drives efficiency allows
a more rational approach to balancing needs in education and health with limits imposed by
fiscal affordability and sustainability. In particular, the analysis of this paper suggests
directions for education and health policies that could raise efficiency, including:
•
Education and health reforms need to pay close attention to issues of staffing and
wages. Countries where the education and health sectors are overstaffed and
compensation payments account for a relatively high share of spending may pay a
price in the form of reduced efficiency. This seems to be a relevant issue for all G7
countries, perhaps with the exception of the U.K. In this context, policy making
should take into account that a larger education and health workforce will not
automatically lead to an increase in education and health service delivery. This
suggests that policy makers should carefully monitor indicators of capacity utilization
(e.g., average class size and hospital bed occupation rates).
•
Spending efficiency can be enhanced by gearing the composition of spending toward
cost-effective intermediate outputs. For instance, immunizations yield large benefits
in terms of health status at a relatively low cost, and countries should ensure that
public spending is not a constraint to achieving better immunization rates. Reducing
student-teacher ratios, on the other hand, tends to be a relatively inefficient way of
improving education outcomes.
•
Reforms aimed at increasing efficiency need to take into account the stage of the
spending process at which inefficiencies arise. In particular, it is important to
distinguish lack of cost effectiveness (mostly a problem in health and tertiary
education) from system inefficiency (a frequent problem in secondary education).
Issues of cost effectiveness may be tackled by increasing competition between
suppliers of goods and services to education and health institutions, as well as
addressing any bias in the composition of spending toward wages and salaries
(e.g., by moderating salaries and tackling overstaffing). System efficiency can be
improved by reforms that promote competition between education and health
institutions in a framework of appropriate accountability for the quality of service
delivery.
19
•
Effective education and health reforms need to balance increased devolution of
responsibility and resources with enhanced market competition and regulatory
frameworks that ensure accountability for results. Shifting responsibility for
education and health to the private sector and subnational governments is unlikely to
achieve efficiency gains alone, but may be part of a balanced reform strategy. In
education, such a reform strategy could include enhanced autonomy for schools to
hire teachers and selecting students on merit. In health, progress may be made by
providing incentives for cost savings. With cost-increasing technological progress and
aging driving up the cost of health care, reducing inefficiencies in the health sector
will be key for achieving sustainable fiscal policies and overcoming obstacles to
international competition in G7 countries. However, it is critical for reforms aimed at
increasing efficiency to address concerns about accountability that may arise from an
increased role for competition. In addition, concerns about equity need to be taken
into account. In particular, disadvantaged groups are often dependent on public
spending for access to basic education and health services. Reforms should be
designed to balance equity concerns (and the related risk of reversal of reforms in the
future) with the need to increase spending efficiency.
20
APPENDIX I. DATA, DATA ENVELOPMENT ANALYSIS, AND SECOND-STAGE ANALYSIS
In this paper, the DEA technique is used to assess the relationship between spending and
outcomes. This method allows us to identify countries where the ratio of outcomes over
spending is relatively high in comparison with other countries where it is comparatively low.
A second-stage statistical analysis is used to assess whether differences between countries
can be accounted for by factors out of the control of policy makers, or whether changes in
expenditure and sectoral policies may make a difference. This appendix explains key
technical aspects of the data used in the paper, the DEA methodology and the second-stage
analysis.
A. Some Data Issues
The paper uses PPP deflated spending that eliminates unit cost differences across countries in
the education and health sector. The idea is to use a measure of spending that is comparable
across countries in the sense that, assuming equal cost efficiency, a similar package of
education and health services could be bought at the same level of spending.24 Expressed as a
ratio of GDP, the spending measure will be biased against countries with lower levels of
GDP—at a given level of spending as a share of GDP, richer countries will be able to procure
more education and health services than poorer countries. In PPP terms this bias will likely
be closer to zero than with the alternatives, although some bias against richer countries may
remain. In any event, such bias should be limited within the relatively homogeneous group of
OECD countries.
The DEA exercise benchmarks the relationship between spending and outcomes in G7
countries against the OECD. The sample of G7 countries is too small for a meaningful
comparison of spending levels and outcomes, so the sample was expanded to the OECD
(excluding the outliers Mexico and Turkey). The DEA exercise links spending and outcomes
as follows:25
24
Since relative prices of non-tradable goods, including many education services and key health services, tend
to rise with per capita income (the Balassa-Samuelson effect), conventional spending measures such as
converting spending in a common currency using market exchange rates will tend to be biased against richer
countries (i.e., this measure of spending will overestimate what richer countries can buy in comparison with
poorer countries). This is one likely explanation for the finding that richer countries tend to have higher levels
of spending at lower levels of education and health attainment (see also Gupta and Verhoeven, 2001). PPPs for
household final consumption expenditure and for GDP are very similar (OECD, 2006b)—here GDP PPPs are
used. Ideally, one would like to use sector-specific national unit costs in the education and health sectors, but
these are not available.
25
With enrollment rates near 100 percent in G7 countries and in the absence of internationally comparable test
results at the primary school level, no indicators are available that can meaningfully capture differences in
primary education attainment for a sufficiently large sample of countries.
21
•
Total spending per student in secondary education is related to average PISA
mathematics test scores, the distribution of those test scores (measured as the ratio of
the score at the 25th percentile in the country to the score at the 75th percentile), and
secondary education graduation rates.26
•
Total spending per student in tertiary education is related to tertiary education
graduation rates.
•
Public spending per capita on health is related to infant, child, and maternal mortality
rates, as well as HALE and population standardized death rates.27
The choice of these outcome indicators is driven by data availability and reflects the
variables that have been used in other studies of education attainment and health status
(e.g., WHO, 2000, and OECD, 2005 and 2006b). These are also the outcome indicators of
choice in many of the studies that have assessed the link between education and health
outcomes and economic growth. A limitation of these variables is that they may not capture
the full range of outcomes pursued with education and health spending.
B. Data Envelopment Analysis
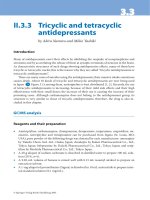
The framework for analyzing the relationship between spending and outcomes derives from
the empirical analysis of production efficiency. This framework provides a method for
assessing the relative efficiency with which production units convert input items into product
items (i.e., technical efficiency). It is based on a straightforward concept of dominance (see
Figure 3): as unit A achieves the same number or more product items than unit E with fewer
input items, unit A is more efficient than (i.e., dominates) unit E. By the same token, unit E is
also less efficient than units B, C, and D. The difference between the input items used by unit
26
Alternatively (see OECD, 2006b), one could define the relevant spending measure for PISA test scores and
secondary graduation rates as the cumulative spending through secondary education, including primary
education. This has the advantage of taking into account all education spending that may be relevant for
outcomes in secondary education. However, this measure also has drawbacks. It seems reasonable to assume
that some type of discount factor should be applied to the education enjoyed longer ago—but it is unclear how
one would estimate such a discount factor. The cumulative spending measure is also more complicated, thereby
increasing the risk of measurement error (and DEA is sensitive to measurement error). Fortunately, the
measures of cumulative spending and current annual spending in secondary education are very highly
correlated, which suggests that the findings are not much influenced by the choice between those alternatives.
27
Since the emphasis is on public policy, we consider public spending when data are available (which is for
health, but not education). Moreover, the DEA results are very similar when using public health spending as the
input item and when considering public and private spending as the input item. Finally, in the second-stage
regressions below, an attempt is made to separate out the effect of private spending.
22
Figure 3. Efficiency and the Best-Practice Frontier
3
2.5
B
2
Product item
F
C
1.5
D
A
1
E
0.5
0
0
0.2
0.4
0.6
0.8
Input item
1
1.2
1.4
A and E can be used as a measure of the inefficiency of unit E relative to unit A.
(Alternatively, this could be measured by the difference in production items.)
The most efficient units in a sample provide the parameters for an initial estimate of the bestpractice frontier. One of the most common ways for determining the best-practice
(or production possibility) frontier is DEA (a more detailed discussion of DEA can be found
in Zhu, 2003). The best-practice frontier is illustrated in Figure 3 by the solid line that
connects the best-practice units A, B, C, and F. Because these are the most efficient units in
the sample, they are assigned an efficiency score of 1. The efficiency scores of the less
efficient units (D and E) depend on their distance to the best-practice frontier (the lower the
efficiency score, the less efficient the unit). Several measures of the distance to the frontier
can be used. Here we adopt the Farrell input-oriented efficiency score and we only assess
cases with one input and one production item. In this simple case, it is straightforward to
calculate the efficiency score for unit E as the ratio of the number of inputs needed at a
minimum (i.e., at the best-practice frontier) to achieve its level of production (this is 0.2, see
Figure 3) and the number of inputs actually used by unit E (1.0). In other words, the
efficiency score of unit E is 0.2. This can be interpreted as an indicator of the cost savings
that could be achieved from efficiency enhancement. That is, if unit E was fully efficient, it
would only need 20 percent of the inputs it is using to achieve the same production level.
Simple DEA estimation produces upward-biased estimates of the efficiency scores which
need to be corrected. In this paper, spending is taken as the input, measures of education
achievement and health status are used to measure production, and OECD countries are the
23
production units. However, estimating the best-practice frontier for the OECD countries from
the observations of education and health spending and outcomes is subject to bias, for which
a correction needs to be made. This bias stems from the fact that since we only observe a
sub-sample of the possible outcomes representing all feasible combinations of spending and
outcomes, we do not know the exact position of the best-practice frontier. Suppose, for
example, that the inputs in Figure 3 represent education spending and the product item PISA
test scores. Also, suppose that education spending or PISA test scores were initially not
observed for country B. Then the best-practice frontier would be drawn through the countries
A, C, and F, following the dashed line between the observations for countries A and C.
However, suppose the observation for country B becomes available. Then, the best-practice
frontier would shift outward to the line that connects countries A, B, C, and F. It is
straightforward to see that, as a general principle, as more information becomes available
about the feasible production combinations, the best-practice frontier may shift outward but
cannot move inward. This one-sided error means that estimating the best-practice frontier
with a finite sample is subject to a bias. Since efficiency scores are measured in relation to
the frontier, the estimation of scores is subject to the same bias in finite samples
(i.e., efficiency is overestimated unless a correction is made for the bias).
Corrections are made for the estimation bias in the best-practice frontier and efficiency
scores through bootstrapping. This paper uses a method proposed by Simar and Wilson
(2000), and is based on the assumption that the frontier that envelops all possible production
combinations of input and product items is smooth. A key issue is how quickly the estimated
efficiency scores converge to their unbiased true values if the sample of observations is
expanded.28 In the case of one input and one product item the convergence rate is fast enough
to yield acceptable estimates of efficiency scores and build confidence intervals. Table 3 in
the main text presents rankings for the G7 countries relative to the OECD based on the point
estimates of the input-oriented bias-corrected efficiency scores.
As an alternative to DEA, efficiency scores could be estimated using stochastic estimation
methods (e.g., WHO, 2000, and Greene, 2004). The main advantage of DEA is that it is
parsimonious in its assumptions for deriving the best-practice frontier—the key assumptions
are that all units have access to the same set of production technologies, free disposal of
inputs and outputs, and convexity of the set of production possibilities. Drawbacks of DEA
28
This convergence speed is n-2/(p+q+1), where p is the number of inputs and q is the number of product items. In
the 1 input/1 product cases of this paper, the convergence speed is n-2/3. This is faster than the convergence
speed for a standard parametric regression of n-1/2, suggesting that reasonable estimates of efficiency scores and
confidence intervals can be reached with a lower number of observations than would be needed for standard
regression analysis. However, the convergence speed declines exponentially as the number of inputs and
product items is increased, and already at two inputs and two product items, the speed of convergence is
markedly slower than for parametric regressions. This implies that such an expansion in numbers of inputs and
product items comes at great cost in terms of the ability to draw conclusions on efficiency from a limited
number of observations.