Tài liệu Báo cáo khoa học: Glycomics-based analysis of chicken red blood cells provides insight into the selectivity of the viral agglutination assay docx
Bạn đang xem bản rút gọn của tài liệu. Xem và tải ngay bản đầy đủ của tài liệu tại đây (1.08 MB, 14 trang )
Glycomics-based analysis of chicken red blood cells
provides insight into the selectivity of the viral
agglutination assay
Udayanath Aich
1
, Nia Beckley
1
, Zachary Shriver
1
, Rahul Raman
1
, Karthik Viswanathan
1
,
Sven Hobbie
2
and Ram Sasisekharan
1,2
1 Harvard-MIT Division of Health Sciences & Technology, the Koch Institute for Integrative Cancer Research and the Department of Biological
Engineering, Massachusetts Institute of Technology, Cambridge, MA, USA
2 Singapore-MIT Alliance for Research and Technology, Centre for Life Sciences, Singapore
Introduction
Existing assays used to quantify virus isolates and to
assess the protective response of vaccines can be
grouped into two categories: assays that ‘count’ virus
(or infectious) particles and assays that measure the
binding of a virus particle to a cell, representative of
the first step in the infection cycle. In the former cate-
gory, assays include the assessment of plaques formed
on a monolayer of mammalian cells, typically Madin–
Darby canine kidney cells, as well as direct characteri-
zation or quantification of viral genome copies through
PCR [1–3]. In the latter category, the most routinely
used assay is the hemagglutination assay [4], where the
ability of a given virus to bind to and agglutinate red
blood cells (RBCs) is measured.
In the case of influenza, for example, the hemagglu-
tination assay takes advantage of the fact that hemag-
glutinin (HA) on the surface of human-adapted viruses
typically binds to specific sialylated glycans on the
surface of epithelial cells of the human upper respira-
tory tract, the key first step in the infection cycle [5].
RBCs, also possessing cell surface, sialylated glycans,
act as a surrogate for this binding event. Agglutination
Keywords
glycans; influenza; mass spectrometry;
nuclear magnetic resonance; red blood cells
Correspondence
R. Sasisekharan, 77 Massachusetts Avenue
E25-519, Cambridge, MA 02139, USA
Fax: +1 617 258 9409
Tel: +1 617 258 9494
E-mail:
(Received 2 December 2010, revised 3
February 2011, accepted 11 March 2011)
doi:10.1111/j.1742-4658.2011.08096.x
Agglutination of red blood cells (RBCs), including chicken RBCs (cRBCs),
has been used extensively to estimate viral titer, to screen glycan-receptor
binding preference, and to assess the protective response of vaccines.
Although this assay enjoys widespread use, some virus strains do not
agglutinate RBCs. To address these underlying issues and to increase the
usefulness of cRBCs as tools for studying viruses, such as influenza, we
analyzed the cell surface N-glycans of cRBCs. On the basis of the results
obtained from complementary analytical strategies, including MS, 1D and
2D-NMR spectroscopy, exoglycosidase digestions, and HPLC profiling, we
report the major glycan structures present on cRBCs. By comparing the
glycan structures of cBRCs with those of representative human upper respi-
ratory cells, we offer a possible explanation for the fact that certain influ-
enza strains do not agglutinate cRBCs, using specific human-adapted
influenza hemagglutinins as examples. Finally, recent understanding of the
role of various glycan structures in high affinity binding to influenza
hemagglutinins provides context to our findings. These results illustrate
that the field of glycomics can provide important information with respect
to the experimental systems used to characterize, detect and study viruses.
Abbreviations
2AB, 2-aminobenzamide; cRBC, chicken red blood cell; Gal, galactose; GlcNAc, N-acetylglucosamine; HA, hemagglutinin protein; HBE,
human bronchial epithelial; HSQC, heteronuclear single quantum coherence; Man, mannose; PNGase F, peptide: N-glycosidase F; RBC,
red blood cell; TFA, trifluoroacetic acid.
FEBS Journal 278 (2011) 1699–1712 ª 2011 The Authors Journal compilation ª 2011 FEBS 1699
of RBCs occurs when the addition of a limiting
amount of virus results in ‘crosslinking’ of RBCs
through binding of multiple RBCs to HAs present on
a single virus; measurement of various concentrations
of solutions can then be used to quantify viral titer.
Additionally, the introduction of antisera capable of
neutralizing a viral strain reduces the ability of virus to
agglutinate RBCs. In this manner, the protective effect
of vaccines can be assessed. The agglutination assay
has a number of advantages, including rapid turn-
around time and easy readout, as well as benchmarked
results with well-characterized virus strains. These con-
siderable advantages have resulted in widespread adop-
tion of this assay format.
Given the widespread use of RBCs, specifically those
from chicken (cRBCs) as a tool, it is essential to
understand to what extent its glycan repertoire recapit-
ulates the receptors for human-adapted influenza
strains (i.e. glycans of the human upper respiratory
tract). This question becomes especially important
when considering previous studies show that various
human-adapted virus strains and their mutants fail to
agglutinate cRBCs. In one study, it was found that the
A ⁄ Fujian ⁄ 411 ⁄ 02 H3N2 virus, responsible for the
unusually severe influenza season of 2003–2004, did
not efficiently agglutinate cRBCs [6]. This same lack of
binding has been shown for other strains as well [7,8].
Therefore, through a combination of analytical tech-
niques including MALDI-MS, HPLC, exoglycosidase
treatment, MS ⁄ MS and 1D and 2D-heteronuclear single
quantum coherence (HSQC) NMR, we report a detailed
characterization of the N-linked glycans present on the
surface of cRBCs. We chose to look specifically at the
N-glycan repertoire because we have previously pro-
vided detailed characterization of the N-linked sialylat-
ed glycan receptors expressed on the cell surface of
human bronchial epithelial cells (HBE), a natural target
for infection by human-adapted influenza A viruses
[9,10]. By comparing fine structure attributes, such as
the degree and extent of branching and the relative
abundance of a2 fi 3 and a2 fi 6 terminal sialic acids
between cRBCs and HBEs, the present study provides
insights into the inability of some human-adapted influ-
enza viruses to agglutinate cRBCs. Defining the glycans
present on the surface of cRBCs will allow either for the
design of strategies to optimize the agglutination assay
or the design of alternative strategies for the detection
and quantification of virus strains. Additionally, we
anticipate our strategy to integrate multiple analytical
methods can be used to discern the structure of N-linked
glycans obtained from other cell types and thus will
prove useful to interrogate the role of glycans in a vari-
ety of disease processes.
Results
To provide a context to our studies, we examined the
ability of two well-characterized HAs from prototypic,
pandemic influenza strains, A ⁄ South Carolina ⁄ 1 ⁄ 1918
H1N1 (SC18, 1918 pandemic) and A ⁄ Albany ⁄ 6 ⁄ 1958
H2N2 (Alb58, 1957 pandemic), to agglutinate cRBCs.
These HAs, both from human-adapted, pandemic
viruses, have distinct glycan binding characteristics
(Fig. S1). Although both strains bind with high affinity
to a subset of a2 fi 6 sialyated glycans able to adopt an
umbrella topology, associated with human-adaptation
[10–12], SC18 binding is restricted to only glycans of
this type, whereas Alb58 also binds other a2 fi 6 and
a2 fi 3 sialyated glycans [12]. In the context of the
agglutination assay, Alb58 HA agglutinated cRBCs at
concentrations as low as 6.25 lgÆmL
)1
(Fig. S2A).
Conversely, SC18 HA does not agglutinate cRBCs in
the concentration range tested (up to 400 lgÆmL
)1
)
(Fig. S2B). Taken together with the findings from
previous studies [10–13], these data indicate that the
glycans of cRBCs may not be representative of the
physiological receptors for human-adapted influenza
strains. Therefore, structural analysis of the cell surface
glycans and comparison of these structures to those
present on human upper respiratory epithelium is criti-
cal for understanding the output of the agglutination
assay, as well as for providing information on its
strengths and limitations.
Release and MALDI-MS analysis of N-glycans
from cRBCs
N-glycans were isolated from both bovine fetuin, used
as a control protein, and from the surface of cRBCs.
Peptide: N-glycosidase F (PNGase F) was used for
enzymatic cleavage of N-glycans because it releases
most protein-bound N-linked carbohydrates from ani-
mal-derived cells [14]. Post-purification, but before
labeling, N-glycans were characterized by orthogonal
analytical techniques including MALDI-MS and
NMR.
To obtain preliminary information about the glycan
pattern in terms of sugar composition and possible
branching patterns of cRBC glycans, MS profiling was
performed. MS-based strategies offer a sensitive tool
to determine glycan composition [15], and the resulting
glycan map provides an overall structural fingerprint
of the sample. MALDI-MS analysis of released
N-glycans from cRBCs indicates the presence of a
wide range of structures; tentative assignments of
molecular ions are reported in Fig. 1. Additionally,
Glycan analysis of cRBCs U. Aich et al.
1700 FEBS Journal 278 (2011) 1699–1712 ª 2011 The Authors Journal compilation ª 2011 FEBS
with appropriate sample work-up and analysis, semi-
quantitative information can also be obtained from
this analysis through the use of soft ionization condi-
tions [16], which have been optimized for the detection
of acidic, sialylated structures. To validate the accu-
racy of the method, analysis of fetuin N-glycans under
identical experimental conditions was performed and
compared with previously reported structures [17] and
indicated good agreement, both qualitatively and
quantitatively. This analysis provided us with an
overall set of glycan compositions; additional analyses
were performed to extend the initial results and pro-
vide more detailed information on the glycan sequence,
including linkages and branching patterns.
Analysis of cRBC glycans by
1
H-NMR
To determine the most relevant glycan sequences for
each composition, we completed additional MS and
NMR-based analysis of the cRBC glycan pool. In
addition to identification and quantification of other
monosaccharides, we aimed to characterize the overall
sialic acid content, to benchmark our analysis to exist-
ing studies using lectin staining [8,18]. Additionally,
such an analysis is particularly important with
reference to the cRBC ⁄ influenza system because it is
known that human-adapted HAs bind to a2 fi 6
linked sialic acids, whereas avian-adapted subtypes
bind a2 fi 3-linked sialic acids [19–21].
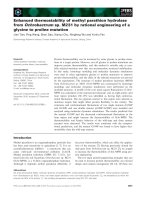
Fig. 1. MALDI-TOF mass spectra of free, nonreduced N-glycans isolated from cRBCs. Peaks appeared in the mass range 2000–3600, with
the most prominent peaks at m ⁄ z 2589.1 and 2880.5. Each peak was calibrated as a nonsodiated species using external N-glycan standards
as mass calibrants. Proposed glycan structures for each peak using MS annotation software are shown along with their observed m ⁄ z value.
The number in the bracket for each glycan indicates the percentage of each corresponding glycan within the total glycan pool as estimated
by semi-quantitative MALDI-MS. Some of the peaks m ⁄ z 1932.0 (*), m ⁄ z 1972.0 (**), m ⁄ z 2546.0 (#) and m ⁄ z 2662.8 (##) are shown by
symbol to accommodate the annotation for these four peaks.
U. Aich et al. Glycan analysis of cRBCs
FEBS Journal 278 (2011) 1699–1712 ª 2011 The Authors Journal compilation ª 2011 FEBS 1701
To obtain quantitative information regarding the sia-
lic acid linkages in cRBCs, we used separate strategies
that together provide overlapping information. First,
two different glycosidases were used to digest glycans:
sialidase S, which cleaves a2 fi 3 and a2 fi 8 linked ter-
minal sialic acid moieties, leaving intact a2 fi 6 linked
sialic acid, and sialidase A [22], which cleaves a2 fi 3,
a2 fi 6, and a2 fi 8 linked sialic acids. In combination
with MALDI-MS analysis, enzymatic treatment was
used to obtain qualitative information about the overall
distribution of sialic acid linkages among the composi-
tions observed. Second, to obtain quantitative informa-
tion, NMR spectroscopy was carried out. As above,
N-linked glycans from fetuin were used as a standard
sample to assess method accuracy. With fetuin N-linked
glycans, treatment with sialidase A and sialidase S and
subsequent assessment by MALDI-MS indicates the
presence of a mixture of a2 fi 3 and a2 fi 6 linked sia-
lic acids (Fig. S3), which are evenly distributed across
the glycan species.
1
H-NMR spectra of this N-glycan
pool indicates the presence of peaks at 1.80 and
1.72 p.p.m. as a result of the H3 (axial) proton of
a2 fi 3 and a2 fi 6 linked sialic acid, respectively. Inte-
gration of these clearly resolved signals indicates that
the amount of a2 fi 3 and a2 fi 6 linked glycans is
approximately 56% and 44%, respectively (Fig. S4).
Figure 2A shows the MALDI-TOF-MS data of
sialidase S-treated cRBC samples. Overall, these results
demonstrate that cRBCs also contain a mixture of
a2 fi 3 and a2 fi 6 linked sialic acids. Three major
peaks appeared at 2134.7, 2296.9 and 2499.8 after
treatment of the cRBC N-glycan pool with sialidase S.
The m ⁄ z value of 2134.76, a biantennary glycan with
one sialic acid and one bisecting N-acetylglucosamine
(GlcNAc), is likely derived from the parental species at
2426.6 upon release of one sialic acid, suggesting both
a2 fi 3 and a2 fi 6 linked sialic acids are present on
the glycan. The m⁄ z value at 2296.9 is representative
of a triantennary glycan with one sialic acid and is
likely derived from a parental species with an m ⁄ z
value of 2880.5 through the release of two sialic acid
monosaccharides. Alternatively, the same species could
be obtained from m ⁄ z of 2589.1 upon release of one
sialic acid. In either case, partial release of sialic acid
suggests the presence of both a2 fi 3 and a2 fi 6
linked sialic acids on glycan species within the cRBC
pool. Finally, the species at m ⁄ z 2499.9, a triantennary
glycan with one sialic acid and with one bisecting
GlcNAc, is likely obtained from species at m ⁄ z of
2792.2 and 3083.8 by the release of one and two sialic
acids, respectively. Quantitative
1
H-NMR analysis of
this sample also indicates the presence of a mixture of
both a2 fi 3 and a2 fi 6 linkages, with the peaks at
1.80 and 1.76 p.p.m. as a result of the H3 (axial)
protons and peaks at 2.69 and 2.64 p.p.m. as a result
of H3 (equatorial) protons with a measured integral
ratio of 54 : 46 (Fig. 2B).
Additional
1
H-NMR and
1
H-
13
C HSQC
spectroscopic characterization of cRBCs
We also extended our NMR analysis to examine a
number of other features within the cRBC glycan pool
Fig. 2. Qualitative and quantitative linkage analysis of N-glycans
from cRBCs. (A) MALDI-MS spectra of sialidase S-treated,
unlabeled, N-glycans that were released from cRBCs by PNGase F.
(B)
1
H-NMR spectra of sialic acid linkage in the free nonreduced
N-glycans isolated from cRBCs.
Glycan analysis of cRBCs U. Aich et al.
1702 FEBS Journal 278 (2011) 1699–1712 ª 2011 The Authors Journal compilation ª 2011 FEBS
that are clearly resolved and can be used to assess
overall structure, including identifying and quantifying
the anomeric protons, the H-2 protons of mannose res-
idues, the H-5 and H-6 protons of fucose residues, the
N-acetyl protons of GlcNAc, and the H3-equitorial
and H3-axial protons of N-glycolylneuraminic acid
[23–26]. The
1
H-NMR spectrum of cRBCs within the
region of interest is shown in Fig. 3 and the list of
important chemical shifts, along with a schematic of
protons and probable assignments, is shown in
Table S1. Within the cRBC N-glycan pool, we detect
the presence of several important signatures, including
the H-1 anomeric protons, the H-2 protons of man-
nose (Man) (d 4.05–4.25 p.p.m.), and the methyl pro-
tons of the N-acetyl groups. In the spectrum, the
presence of sialic acid is confirmed by the detection of
a –CH
3
signal around 2.07, proximate to the –CH
3
sig-
nals for GlcNAc-2 and GlcNAc-7 (Table S1) [27–31].
Within this same region, the presence of two addi-
tional species at 2.03–2.06 p.p.m. are likely a result of
–CH
3
signals of GlcNAc-5 and GlcNAc-5¢ and point
to the presence of both bi- and triantennary glycan
structures within the cRBC pool. This interpretation
was confirmed by identifying the H-1 and H-2 chemi-
cal shifts of mannose monosaccharides within the spec-
trum. In this case, the fingerprint chemical shift of the
H-2 proton of Mana1 fi 6 at 4.13 arises from man-
nose in biantennary structures, whereas the peaks at
4.07 p.p.m. indicate the presence of H-2 protons of
Mana1 fi 6 within tri-antennary structures.
The chemical shifts of the anomeric protons of
GlcNAc-2, GlcNAc-5, GlcNAc-5¢, galactose (Gal)-6,
Gal-6¢ and Gal-8 appear in the range 4.40–4.75 p.p.m.
(Table S1). Specifically, the anomeric proton of
GlcNAc-2 appears at 4.62 p.p.m.; the GlcNAc-5 and
GlcNAc-5¢ anomeric protons appear at 4.56–4.59
p.p.m. The signal at 4.54 p.p.m. can be attributed to
the anomeric proton of GlcNAc-7; however, the
absence of a signal at 5.56 p.p.m. (which would be
assigned to GlcNAc-7¢, if present) indicates the relative
absence of tetraantennary structures. According to
previous studies [27–31], the presence of an extended
lactosamine repeat is characterized by signals for the
anomeric protons of the two monosaccharide units
(GlcNAc-b and Galb) at 4.70 and 4.56 p.p.m., respec-
tively. Although likely absent from the proton spectrum
of cRBC glycans, the presence of a prevalent proton sig-
nal from the anomeric position of Manb1 fi 4 necessi-
tated running an HSQC experiment to resolve this
region of the spectrum to determine the presence or
absence of signals (see below). Taken together, the
results from NMR indicate there are likely both bi-, and
triantennary structures within the cRBC N-glycan pool
with a mixture of a2 fi 3 and a2 fi 6 linked sialic acids,
as well as structures containing bisecting GlcNAc.
To resolve all signals and ensure accurate quantifi-
cation of the relative mol% of different monosaccha-
rides, 2D
1
H-
13
C HSQC was carried out. As above,
analysis was completed first on the N-glycan pool
from bovine fetuin to ensure the accuracy of analysis.
Fig. 3.
1
H-NMR (600 MHz, D
2
O) spectra of N-glycans from cRBCs. Landmark chemical shifts are identified for each region of interest. The
possible structural annotations of each monosaccharide fingerprint proton are labeled in the spectrum.
U. Aich et al. Glycan analysis of cRBCs
FEBS Journal 278 (2011) 1699–1712 ª 2011 The Authors Journal compilation ª 2011 FEBS 1703
The HSQC spectra with volume integration of the
anomeric region is shown in Fig. S5. The chemical
shift of H-1 of GlcNAc-1 at 5.18 p.p.m. showed a
cross peak with C-1 carbon at approximately
90 p.p.m., 2D volume integration of this signal was
set to 1.00 as this signal, within the chitobiose core
that is common to all N-linked glycans. A cross peak
at 4.62 and 94 p.p.m. is assigned to GlcNAc-2. Man
a1 fi 3 showed cross peaks at 5.11 and 99 p.p.m.,
whereas Mana1 fi 6 showed cross peaks at 4.8–4.9
and 97 p.p.m. for H1 ⁄ C1. Conversely, Manb1 fi 4
showed a cross peak at 4.73–4.77 and approximately
100 p.p.m. with a similar integration value. GlcNAc-5
and GlcNAc-5¢ had cross peaks at 4.57 and
99.2 p.p.m., with an integration value of approxi-
mately 2.00, confirm the presence of two protons.
Notably, there is no indication of presence of extra
cross peaks at 4.70, which would represent the Glc-
NAc portion of a lactosamine repeat.
Next, to obtain detailed structural information of
N-glycans from cRBCs, we performed HSQC analysis
of these N-glycans. Because the HSQC spectra of
cRBCs displayed a similar cross peak as discussed
above for bovine fetuin, analysis was effectively bench-
marked and simplified. In the case of the cRBC glycan
pool, cross peaks as a result of GlcNAc-1, GlcNAc-2,
GlcNAc-5, GlcNAc-5¢, Mana1 fi 3and Mana1 fi 6
(Fig. 4) appeared in a similar position with equal inte-
gration. The presence of bi-antennary and tri-anten-
nary was also confirmed by the detection of two
different cross peaks at 4.58 and 4.54 p.p.m. and
approximately 99 p.p.m. as a result the presence of
GlcNAc-5&5¢ and GlcNAc-7 respectively. The cross
peak at 4.68 and 99 p.p.m. is assigned to Manb1 fi 4.
Within the cRBC glycan pool, there are no detectable
cross peaks of either GlcNAcb or Galb, indicating the
absence of repeating lactosamine units.
HPLC profiling of 2-aminobenzamide (2-AB)
linked N-glycans mixture from cRBCs
To supplement the structural data obtained on the entire
N-glycan pool, we labeled cRBC glycans with 2AB, sep-
arated them into oligosaccharide pools and quantified
these pools using HPLC. N-glycans from fetuin were
labeled and used as a standard to ensure a standardized
analysis. Additionally, to ensure that the labeling
reaction did not result in introduction of sample bias,
both labeled and unlabeled cRBC glycans were
profiled on HPLC by pulsed amperometric detection.
Comparison of the profiles indicated no change in the
number of peaks, nor their relative area (data not
shown). Finally, to calibrate the column with the
solvent gradient system (Table S2), a glucose homopol-
ymer ladder is used for calibration. Each detected peak
within the ladder is labeled with a glucose unit (gu)
value as shown in Fig. 5A, similar to methods reported
previously [32]. Subsequently, a mixture of three 2AB-
labeled N-glycan standards (containing one, two or
three sialic acids) was used to benchmark the retention
times of acidic N-glycans from cRBCs in our system.
Peaks corresponding to these standards appeared
between the retention times of 120–200 min (Fig. 5B).
The areas under the curve for all three peaks are
equivalent to the amount of each glycan injected,
consistent with the fact that detection was largely
52 50 48 46 44
104 102 100 98 96 94 92
F1 (p.p.m.)
F2 (p.p.m.)
Fig. 4. HSQC-spectra of N-glycans from
cRBCs. The spectrum shows the cross
peaks between the anomeric protons
(5.25–4.30 p.p.m.) and carbon
(89–105 p.p.m.) signals. The cross peaks
confirm the presence of primarily bi- and
triantennary structures. Notably, there is no
cross peak detected at 4.68–4.71 p.p.m.,
indicating the absence of lactosamine repeat
units in the cRBC N-glycan pool.
Glycan analysis of cRBCs U. Aich et al.
1704 FEBS Journal 278 (2011) 1699–1712 ª 2011 The Authors Journal compilation ª 2011 FEBS
determined by the label and independent of the attri-
butes of the glycan to which it is attached. Accord-
ingly, we aimed to determine the amount of individual
cRBC glycans by HPLC through the use of a standard
curve created by injecting amounts of the three stan-
dards that encompass the ranges of glycans present in
the cRBC glycan pool (Fig. S6).
2AB-labeled N-glycans were qualitatively and quan-
titatively assessed using this normal phase HPLC
system. The 2AB-labeled glycans from fetuin appear at
retention times in the range 120–200 min and displayed
ten major peaks, which matched the ten major species
observed through the MALDI-MS profile. Profiling of
the cRBC N-glycans showed 12 major peaks at reten-
tion times in the range 120–200 min (Fig. 5C). The
detailed peak retention time of each peak including
annotation are shown in Table S3. On the basis of the
standard curve as shown in Fig. S6, the amount of gly-
can in each peak was calculated to estimate a percent
recovery. The total glycan isolated by HPLC was
calculated to be 91 pmol (Table S3; approximately
90% of the injected glycan of 102 pmol). Taken
together with the control experiments outlined above,
these results indicate that our quantitative measure-
ments can reasonably be correlated with quantitative
measurements on the glycan pool (i.e. NMR and
MALDI analysis). To complete the analysis of N-gly-
cans, three separate, but complementary, approaches
LU
1.2
1.4
1.6
5
6
Glucose unit (GU)
0.4
0.6
0.8
1
7
100
120 140
0.2
2AB-A1
150140130120
1.2
LU
0.8
0.6
0.4
0.2
1
LU
0.7
0.8
0.9
1
2
0.3
0.4
0.5
0.6
1
3
4
5
120 130 140 150
8
9
10
11
12
13
14
15
160 180
200
2AB-A2
2AB-A3
160 170 180 190 200
6
7
8
9
10
11
12
13
160 170 180 190
A
B
C
Fig. 5. HPLC profiling of 2AB-linked
N-glycan isolated from cRBCs. Glycans are
eluted using a normal phase column with a
50 m
M ammonium formate ⁄ acetonitrile
gradient as eluant. Total run time is
290 min. (A) HPLC profiling of glucose
homopolymer for calibration of the column.
(B) A mixture of three sialic acid containing
N-glycans standards, chosen based on their
polarity and molecular weight, are used as
benchmarks. Three different species
appeared at retention times in the range
120–200 min. (C) 2-AB labeled N-glycan pool
from cRBCs were analyzed within the
calibrated and standardized column system.
The acidic N-glycans from cRBCs eluted at
retention times in the range 120–200 min.
Glycan under each peak was determined
from the MALDI-MS data of the isolated
fraction of their corresponding peaks
(Table S3).
U. Aich et al. Glycan analysis of cRBCs
FEBS Journal 278 (2011) 1699–1712 ª 2011 The Authors Journal compilation ª 2011 FEBS 1705
were taken. First, pools were automatically col-
lected and subjected to MS analysis by MALDI-TOF.
Additionally, we completed sialidase treatment of the
collected pools to determine the distribution of sialic
acid. Next, we completed online MS ⁄ MS analysis of
the major species; some of these species were further
analyzed by TOF ⁄ TOF to ensure accurate structural
elucidation.
The various 2AB linked glycans in each peak are
shown in Table S3. To examine sialic acid content,
sialidase treatment of the 2-AB linked N-glycan pool
from cRBCs was performed (Fig. S7). HPLC analysis
of the sample after enzymatic treatment with sialidase
S showed that the retention time of some of the peaks
remained the same, indicating no sialic acid cleavage,
whereas there was the appearance of new peaks at
retention times in the range 5–55 min (indicating sialic
acid cleavage). Integration of the areas under the
curves for each window confirms the presence of a
mixture of a2 fi 3 and a2 fi 6 linked sialic acids, in a
ratio of approximately 50 : 50, within the cRBC glycan
pool.
There are 13 major N-glycan species that are
observed in the cRBC pool. On the basis of their mass
signature, NMR analysis and enzymatic treatment, the
most likely structure for two of these species
(i.e. 2135.3 and 2426.6) can be assigned (Table 1). For
the rest of the major species, LC-MS ⁄ MS was
completed to assign structure. LC-MS ⁄ MS of the spe-
cies with observed relative molecular masses of 2500.1,
2792.2, 2880.5 and 3083.8, in combination with the
constraints obtained from the analysis of the N-glycan
pool, enabled definitive assignment (Fig. 6A–D and
Table 1). For two of the species (i.e. with observed
relative molecular masses of 2297.6 and 2589.1), the
fragmentation patterns are consistent with two species:
one with a lactosamine extension and one without
(Fig. S8). On the basis of the fact that the NMR
analysis, both mono- and bidimesional, indicated the
absence of lactosamine repeats, the most likely struc-
ture for both is the first indicated. To confirm this,
TOF ⁄ TOF analysis of 2297.6 yielded a fragmentation
pattern consistent with this proposed structure. Taken
together, the data thus strongly supports the structural
assignment presented in Table 1.
Comparison of the glycans observed for human
bronchial epithelial cells with those present on cRBCs
(Table 1) indicates some similarities; for example, both
N-glycan pools have species with m ⁄ z signals at
approximately 2224.0, 2297.6, 2589.1 and 2880.5. By
contrast, many of the species observed for HBE’s
(m ⁄ z = approximately 2078.0, 2408.2, 2443.0, 2611.0,
2661.5, 2733.1, 2773.0, 2808.3, 2894.9, 2954.6, 3057.0
and 3097.0) [9] are either completely absent or are sig-
nificantly less prominent in cRBCs. Specifically, the
species with m ⁄ z signals at 2808.3, 3057.0 and 3097.0
were previously shown in HBEs to correspond to
structures with lactosamine repeats terminated by sialic
Table 1. Structural assignment of the major N-glycans from cRBCs
and a comparison with those observed in HBEs.
Theoretical
molecular
mass Molecular structure
N-glycan source
HBEs cRBCs
2077.7
Present Absent
2134.8
Absent Present
2296.8
Present Present
2422.8
Absent Present
2442.9
Present Absent
2499.9
Absent Present
2571.9
Present Minor
2587.9
Present Present
2734.0
Present Absent
2791.0
Absent Present
2808.0 or Present Absent
2879.0
Minor Present
2896.0
Present Absent
2953.0
Present Minor
3052.1
Present Absent
3082.1
Absent Present
Glycan analysis of cRBCs U. Aich et al.
1706 FEBS Journal 278 (2011) 1699–1712 ª 2011 The Authors Journal compilation ª 2011 FEBS
acid. Notably, such glycan motifs, polylactosamine
extensions terminated by a2 fi 6 sialic acid, can adopt
a distinct umbrella-like topology that governs high-
affinity binding to HA from human-adapted influenza
viruses [9]. The most intense peak in the analysis of
cRBCs (i.e. at 2880.9) is present in HBEs as a minor
component, and likely does not represent a structure
containing a lactosamine repeat unit. Finally, inspec-
tion of Table 1 indicates that several prominent mass
peaks present in cRBCs are absent or less abundant
for HBEs. For example, the peak at m ⁄ z 2135.3, repre-
sents a biantennary structure with a bisecting GlcNAc
and lack of lactosamine repeats. Thus, beyond the
presence of both a2 fi 3 and a2 fi 6 sialyation, the
N-glycans of cRBCs do not recapitulate key properties
of the physiological glycan species encountered by
viruses, such as influenza.
Discussion
The widespread use of cRBC agglutination in influenza
surveillance and research necessitates a complete
understanding of the structures of the glycan receptors
present on the surface of cRBCs. This is important
both for understanding the limitations of the assay
and for better interpretation of the hemagglutination
assay results. In the present study, distinct analytical
approaches including combining 2D-NMR, HPLC
profiling and MS ⁄ MS analysis were employed to
provide detailed structural information on cRBC
glycans. Notably, although we often employed fetuin
as a control, the quantitative analysis reported in the
present study goes beyond previous reports of glycans
moieties in bovine fetuin [17,33].
Fig. 6. LC-MS ⁄ MS data of selected MS peaks of N-glycans from cRBC. Shown are the MS ⁄ MS signals of 2-AB labeled structures:
(A) 2620, (B) 2911 and (C) 3000; and the unlabeled structure: (D) 3083.8. Fragment assignments are shown for each structure.
U. Aich et al. Glycan analysis of cRBCs
FEBS Journal 278 (2011) 1699–1712 ª 2011 The Authors Journal compilation ª 2011 FEBS 1707
A combination of these analytical techniques showed
that the glycan structures on cRBCs were found to
possess both a2 fi 3 and a2 fi 6 linked sialic acid.
Significantly, the analysis revealed an absence of lac-
tosamine repeats, and the presence of bi- and trianten-
nary structures. This is in contrast to the
predominance of a2 fi 6 sialylated glycans with lactos-
amine repeats on HBEs, including tetraantennary
structures (Table 1). Taken together, these results indi-
cate that the glycan repertoire of cRBCs is distinct
from that of human upper respiratory cells, which are
the targets for infection by human adapted influenza A
viruses. These results provide a context to possibly
explain why certain human-adapted influenza strains
do not agglutinate RBCs. We note that our analyses in
the present study focus on characterizing the N-linked
glycans extracted from cRBCs. In addition to the fact
that previous analysis of HBEs focused on the
N-glycan pool, we find that sialylated N-glycans repre-
sent a substantial percentage of total sialylated glycans
present on cRBCs. Apart from the predominantly
nonsialylated O-glycans that are a part of ABH blood
group antigens, cRBCs are known to have sialylated
O-glycans attached to glycoproteins such as glycopho-
rins [34]. Most of these sialylated O-linked glycans are
terminated by a2 fi 3-linked sialic acid (typically
terminating core 1-type structure) and hence are unli-
kely to comprise receptors for human-adapted influ-
enza A viruses, which require the presence of a2 fi 6
sialylation.
The difference in the N-linked glycan repertoire of
cRBC and human epithelial cells limits the ability of
agglutination assay to assess virus-host binding as
highlighted by the results presented in Fig. S1A. In
previous studies, SC18 HA has demonstrated specific
high-affinity binding only to 6¢ SLN-LN, an a2 fi 6
motif with a polylactosamine repeat that is able to
adopt an umbrella topology [10]. On the other hand,
although Alb58 also showed demonstrated high bind-
ing affinity to 6¢ SLN-LN (comparable to SC18 HA), it
also bound to 6¢ SLN and other a2 fi 3 sialylated
glycans (Fig. S1B). The observed difference in the
ability of SC18 and Alb58 HA to agglutinate cRBC is
explained by minimal presence of sialylated glycans
with poly-lactosamine repeats in the cRBCs. Alb58 on
the other hand binds to sialylated glycans with single
lactosamines on the cRBCs and hence shows aggluti-
nation.
In summary, our studies have important implications
with respect to improving the use of RBC agglutination
assays given that this assay still offers an easy readout
for rapid screening. Using the combination of analytical
techniques outlined in the present study, it is possible to
obtain fine structural characterization of sialylated gly-
cans expressed in RBCs from different sources. Such a
detailed characterization of glycans from different RBCs
would permit the selection of the appropriate RBCs to
screen avian-adapted and human-adapted viruses. Addi-
tionally, it would also allow for rational engineering of
glycan structures on the RBC surface such as introduc-
ing additional enzymes that can generate lactosamine
repeats before the terminal sialylation step instead of
simply desialylating and resialylated cRBCs.
In addition to improving the use and interpretation
of RBC agglutination assay, the present study also
offers new possibilities for developing focused plat-
forms to determine relative a2 fi 3 and a2 fi 6 sialy-
lated glycan receptor-binding specificity and affinity,
which has been shown to be associated with the
human adaptation of the influenza virus [10–12]. Spe-
cifically, knowledge of the fine structure of the sialylat-
ed glycans from different cell types would permit
generation of different glycan fractions from these cell
types where each fraction would be characterized in
terms of the predominance of a specific terminal sialic
acid linkage and other features, such as branch length
and extent of branching. These defined glycan fractions
can then be used for developing ‘natural’ glycan array
platforms [35], which can then be used to probe and
quantify the binding specificities of HA from avian-
and human-adapted viruses.
Materials and methods
PNGase F (glycerol free) was obtained from New England
Biolabs (Beverly, MA, USA). Signal 2-AB Labeling Kit,
sialidase-A and sialidase-S were obtained from Prozyme
(Hayward, CA, USA). Bovine fetuin, SDS, 2-mercapto
ethanol, acetonitrile, trifluro acetic acid, 6-aza-2-thiothy-
mine matrix, Nafion, SP20SS beads and H+ dowex
cation exchanger beads were obtained from Sigma-Aldrich
(St Louis, MO, USA). Calbiosorb beads (catalog number
206550) and protease inhibitor cocktail (catalog number
53914) were obtained from Calbiochem (San Diego, CA,
USA). Sep-Pak @ C18 columns were obtained from Waters
Corp. (Milford, MA, USA) and ENVÔ-Carb SPE tubes
were from Supelco (Bellefonte, PA, USA). C-RBCs
were obtained from Rockland Immunochemicals, Inc.
(Boyertown, PA, USA) and D
2
O was obtained from
Cambridge Isotope (Andover, MA, USA). All commercial
reagents were used without further purification.
N-glycan release by PNGase F from bovine fetuin
For many of the assays presented here, bovine fetuin was
used as a control, given that its glycan repertoire is well-
Glycan analysis of cRBCs U. Aich et al.
1708 FEBS Journal 278 (2011) 1699–1712 ª 2011 The Authors Journal compilation ª 2011 FEBS
characterized [17,34]. Approximately 1 mg of intact glyco-
protein was dried by lyophilization. To this, 300 lLof
purified water was added to make a protein solution of
approximately 3.3 mgÆmL
)1
. Next, 50 lLof10· denatur-
ing buffer was added to the vial and incubated in heat
block at 100 °C for approximately 10 min. After cooling,
50 lL of both 10 · G7 reaction buffer and 10% NP-40
were added to the denatured protein and mixed well. Then,
50 lL of PNGase F was added, after which, incubation at
37 °C was carried out for approximately 24 h. After degly-
cosylation, initial clean-up of the released glycans from the
protein was completed by adding 500 lL of Calbiosorb
beads to remove SDS. At this point, the sample was further
purified as described below.
RBC surface glycan extraction
Glycans were extracted from the surface of cRBCs accord-
ing to a modified version of a previously published protocol
[9]. cRBCs preparations were diluted in NaCl ⁄ P
i
to obtain
a concentration of approximately 400 million cellsÆmL
)1
.
The following steps were then repeated twice: cells were
spun down at 2000 g for 10 min at 4 °C, the supernatant
was aspirated, and the pellet was resuspended in 0.5 mL of
NaCl ⁄ P
i
+ 1% protease inhibitor. Cells were then lysed for
15 min under gentle agitation at room temperature in
500 lL of deionized water containing 1% protease inhi-
bitor. The suspension was then spun down at 2000 g for
10 min at 4 °C and resuspended in 500 lL of NaCl ⁄ P
i
+
1% protease inhibitor. An additional spin down cycle was
performed using the same buffer volume at 4000 g for
10 min at 4 °C. The supernatant was removed, and the pel-
let was resuspended in 20 lL of deionized water and
230 lL of an aqueous solution of 1% SDS + 20 mm
2-mercaptoethanol. The suspended pellets were boiled in a
hot water bath for 10 min, after which 40 lL of 10% NP40
(PNGase F Kit), 40 lL of G7 Buffer (PNGase F Kit) and
10 lL of PNGase F were added to the mixture. The pellets
were incubated for 24 h at 37 °C under gentle agitation.
After incubation, 100 lL of Calbiosorb beads were added
to the mixture to remove SDS, and this mixture was incu-
bated for 15 min under gentle agitation at room tempera-
ture. At this point, the sample was further purified as
described below.
Purification of glycans
After digestion with PNGase F, samples were treated with
prewashed Calbiosorb beads, centrifuged, and the superna-
tant was added to an equilibrated Sep-Pak C18 column, in
accordance with the manufacturer’s instructions. Then,
6 mL of 5% acetonitrile, 0.05% trifluoroacetic acid (TFA)
was used to elute the sample. After lyophilization and
drying, the sample was resuspended in 1 mL of water and
added to a preequilibrated ENVÔ-Carb SPE tube. After
washing with 0.05% TFA in water, and 5% acetonitrile,
0.05% TFA in water, N-glycans were eluted in 50% aceto-
nitrile ⁄ water with 0.1% TFA. The purified glycan prep was
lyophilized and reconstituted in 40 lL of water.
2AB labeling of N-glycans
Selected N-glycan reactions were fluorescently tagged using
the SignalÔ 2-AB labeling kit. Briefly, the reaction was
carried out in accordance with the manufacturers’ instruc-
tions at 65 °C for 3 h. After completion, the samples were
purified by using a preequilibrated GlykoClean G Cartridge
(Prozyme, Hayward, CA, USA). The labeling reaction was
added to the column and washed with 96% acetoni-
trile ⁄ milli-Q water (Millipore, Billerica, MA, USA).
Labeled glycans were eluted with milli-Q water (6 · 1 mL).
Glycan MS analysis by MALDI-MS spectroscopy
All glycans were analyzed using the Voyager DE-STR
MALDI-TOF (Applied Biosystems, Foster City, CA,
USA). The sample and matrix were combined in a ratio of
1 : 9, respectively. Nafion (1 lL) was spotted on the plate
and allowed to dry for approximately 5 min. The matrix-
sample mixture was then placed on top of the Nafion spot
and allowed to dry in a humidity-controlled chamber
(humidity 23%). The parameters used for analysis were:
negative and linear mode, 22 000 V accelerating Voltage,
93% grid voltage, 0.3% guide wire, 150 ns delay. Peaks
were calibrated as nonsodiated species using external glycan
standards. Proposed glycan compositions for each peak
were determined by imputing the peak masses into the
glycomod software ( />which calculates all mathematically possible glycan compo-
sitions for a given mass.
HPLC analysis of 2AB linked N-glycans using
GlycoSep N column
Labeled glycans were separated and quantified using a
GlycoSepÔ N HPLC column (Prozyme, Hayward, CA,
USA) and a two solvent, gradient system (solvent A is
100% acetonitrile; solvent B is 50 mm ammonium formate,
pH 4.4) with UV and fluorescence detection. The gradient
table for the elution of 2AB linked N-glycans from cRBCs
including glucose homopolymer and N-glycan standards is
shown in Table S2. Before the HPLC profiling of N-glycans
from cRBCs, the column and gradient system was verified
using glucose homopolymer. Furthermore, to obtain accu-
rate retention times for the various N-glycan species, a
standard mixture of known 2AB linked N-glycans (2AB-
A1, 2AB-A2 and 2AB-A3) was injected to the HPLC. Stan-
dard N-glycans and those from cRBCs typically eluted at
retention times in the range 120–200 min. The number of
U. Aich et al. Glycan analysis of cRBCs
FEBS Journal 278 (2011) 1699–1712 ª 2011 The Authors Journal compilation ª 2011 FEBS 1709
peaks and their area under the curve was used for qualita-
tive and quantitative estimation of N-linked structural
pools present in cRBCs. Additionally, during HPLC profil-
ing several fractions were collected. Subsequently, solvents
were removed by speed-vacuuming and resuspended with a
minimum amount of water, followed by structural charac-
terization of each individual peaks using MALDI-MS. The
mass peaks obtain from each fraction were also analyzed
based on the standard MALDI-MS glycomod software.
The possible 2AB linked glycans in each fraction were
assessed based on the N-glycan biosynthesis annotation.
NMR study of N-glycans
The isolated and purified N-glycans were deuterium
exchanged using 99% D
2
O (three times) and dried by
lyophilization. The dried substance were dissolved in
400 lLofD
2
O (100%) and transferred to a 5 mm NMR
tube.
1
H-NMR spectra were recorded in a Bruker
600 MHz NMR (Bruker, Ettlingen, Germany) with a cryo-
probe using topspins software. 2D-HSQC
1
H-
13
C-NMR
spectra were recorded without spinning with the standard-
ized water frequency O1, p1 (10 < P1 < 16) and D1 (for
N-glycans, D1 = 2) values.
Assessment of sialic acid linkages
To purified N-glycan samples, 10 lLof5· reaction buffer
and 7 lL of sialidase A from Arthrobacter ureafaciens or
sialidase S from Streptococcus pneumoniae (Prozyme) was
added and incubated at 37 °C for 18 h. The reaction mix-
ture was then heated to 100 °C on a heat block for 5 min
to inactivate the enzyme. Subsequently, before analysis, the
glycans were purified by micro columns using SP20SS from
Supelco (Bellefonte, PA, USA) and H+ Dowex Cation
Exchanger beads from Sigma-Aldrich (St Lewis, MO,
USA). Additionally, sialic acid quantification was per-
formed by conversion of the released sialic acid to pyruvic
acid. The released hydrogen peroxide was quantified using
standard UV ⁄ fluorescence detection methods. The assay
was carried out using the protocol supplied with the kit. A
standard curve obtained using a sialic acid standard was
used to quantify detected sialic acid.
LC-MS/MS analysis
Unlabeled or 2-AB labeled glycans were subjected to LC-
MS analysis. LC was carried out using an Ultimate 3000
LC system (Dionex Corp., Sunnyvale, CA, USA) using a
C-18 reverse phase column (1.8 lm; 2.1 · 50 mm). The
mobile phases employed included water ⁄ 0.1% acetic acid
(Solvent A) and 5% acetonitrile in water with 0.1% acetic
acid (Solvent B). A gradient of B over approximately
60 min was used for N-glycan analysis. The flow-rate used
was 250 lLÆmin
)1
from the LC system through a splitter
adjusted to obtain a 12 lLÆmin
)1
flow into the LTQ ion-
trap mass spectrometer (Thermo Fisher Scientific Inc.,
Waltham, MA, USA). The LTQ MS was operated in posi-
tive mode with ESI voltage of 3.9 kV and capillary temper-
ature of 200 °C. A triple play data dependent scanning
method was used where one MS scan (five microscans aver-
aged) was followed by a zoom scan and MS
n
on the top
eight most intense ions. Ions from m ⁄ z 480–2000 were
selected.
MALDI-TOF/TOF
In addition to LC-MS ⁄ MS analysis, we also completed
TOF ⁄ TOF analysis of selected peaks to confirm structure
using a MDS Sciex 4800 MALDI-TOF ⁄ TOFÔ instru-
ment (Applied Biosystems) controlled by 4000 series
explorerÔ software. TOF ⁄ TOF fragmentation spectra
were recorded using negative-ion linear mode with stan-
dardized MS ⁄ MS acquisition and processing methods after
tuning of the instrument. TOF ⁄ TOF spectra are obtained
in 1 kV operating mode with relative resolution of 50 full
width half maximum and a laser intensity of 5600 with 400
total shots.
Acknowledgements
This work was supported by the Singapore–MIT
Alliance for Research and Technology.
References
1 Boon AC, French AM, Fleming DM & Zambon MC
(2001) Detection of influenza a subtypes in community-
based surveillance. J Med Virol 65, 163–170.
2 Amano Y & Cheng Q (2005) Detection of influenza
virus: traditional approaches and development of
biosensors. Anal Bioanal Chem 381, 156–164.
3 Zhang WD & Evans DH (1991) Detection and identifi-
cation of human influenza viruses by the polymerase
chain reaction. J Virol Methods 33, 165–189.
4 Killian ML (2008) Hemagglutination assay for the
avian influenza virus. Methods Mol Biol 436, 47–52.
5 Gamblin SJ, Haire LF, Russell RJ, Stevens DJ, Xiao B,
Ha Y, Vasisht N, Steinhauer DA, Daniels RS, Elliot A
et al. (2004) The structure and receptor binding proper-
ties of the 1918 influenza hemagglutinin. Science 303,
1838–1842.
6 Lu B, Zhou H, Ye D, Kemble G & Jin H (2005)
Improvement of influenza A ⁄ Fujian ⁄ 411 ⁄ 02 (H3N2)
virus growth in embryonated chicken eggs by balancing
the hemagglutinin and neuraminidase activities, using
reverse genetics. J Virol 79, 6763–6771.
7 Medeiros R, Escriou N, Naffakh N, Manuguerra JC &
van der Werf S (2001) Hemagglutinin residues of recent
Glycan analysis of cRBCs U. Aich et al.
1710 FEBS Journal 278 (2011) 1699–1712 ª 2011 The Authors Journal compilation ª 2011 FEBS
human A(H3N2) influenza viruses that contribute to
the inability to agglutinate chicken erythrocytes.
Virology 289, 74–85.
8 Nobusawa E, Ishihara H, Morishita T, Sato K &
Nakajima K (2000) Change in receptor-binding specific-
ity of recent human influenza A viruses (H3N2): a single
amino acid change in hemagglutinin altered its recogni-
tion of sialyloligosaccharides. Virology 278, 587–596.
9 Chandrasekaran A, Srinivasan A, Raman R, Viswana-
than K, Raguram S, Tumpey TM, Sasisekharan V &
Sasisekharan R (2008) Glycan topology determines
human adaptation of avian H5N1 virus hemagglutinin.
Nat Biotechnol 26, 107–113.
10 Srinivasan A, Viswanathan K, Raman R, Chandraseka-
ran A, Raguram S, Tumpey TM, Sasisekharan V &
Sasisekharan R (2008) Quantitative biochemical ratio-
nale for differences in transmissibility of 1918 pandemic
influenza A viruses. Proc Natl Acad Sci USA 105,
2800–2805.
11 Maines TR, Jayaraman A, Belser JA, Wadford DA,
Pappas C, Zeng H, Gustin KM, Pearce MB, Viswa-
nathan K, Shriver ZH et al. (2009) Transmission and
pathogenesis of swine-origin 2009 A(H1N1) influenza
viruses in ferrets and mice. Science 325, 484–487.
12 Viswanathan K, Koh X, Chandrasekharan A, Pappas
C, Raman R, Srinivasan A, Shriver Z, Tumpey TM &
Sasisekharan R (2010) Determinants of glycan receptor
specificity of H2N2 influenza A virus hemagglutinin.
PLoS ONE 5, e13768.
13 Shriver Z, Raman R, Viswanathan K & Sasisekharan R
(2009) Context-specific target definition in influenza a
virus hemagglutinin-glycan receptor interactions. Chem
Biol 16, 803–814.
14 Tretter V, Altmann F & Marz L (1991) Peptide-N4-(N-
acetyl-beta-glucosaminyl)asparagine amidase F cannot
release glycans with fucose attached alpha 1–3 to the
asparagine-linked N-acetylglucosamine residue. Eur J
Biochem 199, 647–652.
15 Zaia J (2008) Mass spectrometry and the emerging field
of glycomics. Chem Biol 15, 881–892.
16 Zaikin VG & Halket JM (2006) Derivatization in mass
spectrometry – 8. Soft ionization mass spectrometry of
small molecules. Eur J Mass Spectrom (Chichester,
Eng) 12, 79–115.
17 Mechref Y & Novotny MV (1998) Matrix-assisted laser
desorption ⁄ ionization mass spectrometry of acidic
glycoconjugates facilitated by the use of spermine as a
co-matrix. J Am Soc Mass Spectrom 9, 1293–1302.
18 Ito T, Suzuki Y, Mitnaul L, Vines A, Kida H & Ka-
waoka Y (1997) Receptor specificity of influenza A
viruses correlates with the agglutination of erythro-
cytes from different animal species. Virology 227,
493–499.
19 Stevens J, Blixt O, Paulson JC & Wilson IA (2006)
Glycan microarray technologies: tools to survey host
specificity of influenza viruses. Nat Rev Microbiol 4,
857–864.
20 Rogers GN & D’Souza BL (1989) Receptor binding
properties of human and animal H1 influenza virus iso-
lates. Virology 173, 317–322.
21 Connor RJ, Kawaoka Y, Webster RG & Paulson JC
(1994) Receptor specificity in human, avian, and equine
H2 and H3 influenza virus isolates. Virology 205, 17–23.
22 Uchida Y, Tsukada Y & Sugimori T (1979) Enzymatic
properties of neuraminidases from Arthrobacter
ureafaciens. J Biochem 86
, 1573–1585.
23 Fournet B, Montreuil J, Strecker G, Dorland L,
Haverkamp J, Vliegenthart FG, Binette JP & Schmid K
(1978) Determination of the primary structures of 16
asialo-carbohydrate units derived from human plasma
alpha 1-acid glycoprotein by 360-MHZ 1H NMR
spectroscopy and permethylation analysis. Biochemistry
17, 5206–5214.
24 Dorland L, Haverkamp J & Vliegenthart JF (1978)
Determination by 360 MHz 1H NMR spectroscopy of
the type of branching in complex asparagine-linked gly-
can chains of glycoproteins. FEBS Lett 89, 149–152.
25 Dorland L, Haverkamp J, Viliegenthart JF, Strecker G,
Michalski JC, Fournet B, Spik G & Montreuil J (1978)
360-MHz 1H nuclear-magnetic-resonance spectroscopy
of sialyl-oligosaccharides from patients with sialidosis
(mucolipidosis I and II). Eur J Biochem 87, 323–329.
26 Strecker G, Fournet B & Montreuil J (1978) Structure
of the three major fucosyl-glycoasparagines accumulat-
ing in the urine of a patient with fucosidosis. Biochimie
60, 725–734.
27 Halbeek H (1993) Structural characterization of the car-
bohydrate moieties of glycoproteins by high-resolution
1
H-NMR spectroscopy. Methods Mol Biol 17, 115–148.
28 Di Patrizi L, Rosati F, Guerranti R, Pagani R, Gerwig
GJ & Kamerling JP (2006) Structural characterization
of the N-glycans of gpMuc from Mucuna pruriens seeds.
Glycoconj J 23, 599–609.
29 Koles K, van Berkel PH, Pieper FR, Nuijens JH,
Mannesse ML, Vliegenthart JF & Kamerling JP (2004)
N- and O-glycans of recombinant human C1 inhibitor
expressed in the milk of transgenic rabbits. Glycobiology,
14, 51–64.
30 Di Patrizi L, Capone A, Focarelli R, Rosati F, Gallego
RG, Gerwig GJ & Vliegenthart JF (2001) Structural
characterization of the N-glycans of gp273, the ligand
for sperm-egg interaction in the mollusc bivalve Unio
elongatulus. Glycoconj J 18, 511–518.
31 Leeflang BR, Faber EJ, Erbel P & Vliegenthart JF
(2000) Structure elucidation of glycoprotein glycans and
of polysaccharides by NMR spectroscopy. J Biotechnol
77, 115–122.
32 Guile GR, Rudd PM, Wing DR, Prime SB & Dwek
RA (1996) A rapid high-resolution high-performance
liquid chromatographic method for separating glycan
U. Aich et al. Glycan analysis of cRBCs
FEBS Journal 278 (2011) 1699–1712 ª 2011 The Authors Journal compilation ª 2011 FEBS 1711
mixtures and analyzing oligosaccharide profiles. Anal
Biochem 240, 210–226.
33 Green ED & Baenziger JU (1988) Asparagine-linked
oligosaccharides on lutropin, follitropin, and thyrotro-
pin. I. Structural elucidation of the sulfated and
sialylated oligosaccharides on bovine, ovine, and human
pituitary glycoprotein hormones. J Biol Chem 263,
25–35.
34 Duk M, Krotkiewski H, Stasyk TV, Lutsik-Kordovsky
M, Syper D & Lisowska E (2000) Isolation and charac-
terization of glycophorin from nucleated (chicken)
erythrocytes. Arch Biochem Biophys 375, 111–118.
35 Song X, Lasanajak Y, Xia B, Smith DF & Cummings
RD (2009) Fluorescent glycosylamides produced by
microscale derivatization of free glycans for natural
glycan microarrays. ACS Chem Biol 4, 741–750.
Supporting information
The following supplementary material is available:
Fig. S1. In a quantitative glycan binding assay, SC18
HA showed specific high-affinity binding only to
6¢ SLN-LN, an a2 fi 6 motif with a polylactosamine
extension (red bars).
Fig. S2. (A) Agglutination of Alb58 proteins with
cRBCs. (B) Agglutination of Sc18 proteins with cRBCs.
Fig. S3. Qualitative sialic acid linkage analysis of bovine
fetuin by MALDI-MS after enzymatic treatment.
Fig. S4. Quantitative sialic acid linkage analysis of
bovine fetuin by
1
H-NMR spectroscopy.
Fig. S5. HSQC-spectra of N-glycan from fetuin with
volume integration.
Fig. S6. Standard curve for 2AB glycans based on the
pmol of glycan injected versus area under the curve
obtained by HPLC.
Fig. S7. HPLC profiling of sialidase S treated 2AB
linked N-glycans from cRBCs.
Fig. S8. LC-MS ⁄ MS data of selected MS peaks of N-
glycans from cRBC.
Table S1. Chemical shift list for representative N-gly-
can structures from from CRBCs.
Table S2. HPLC solvent gradient for elution using two
solvent system of A with 50 mm ammonium formate
(pH 4.4) and solvent B with 100% acetonitrile.
Table S3. HPLC profile of 2AB linked N-glycans from
cRBCs.
This supplementary material can be found in the
online version of this article.
Please note: As a service to our authors and readers,
this journal provides supporting information supplied
by the authors. Such materials are peer-reviewed and
may be re-organized for online delivery, but are not
copy-edited or typeset. Technical support issues arising
from supporting information (other than missing files)
should be addressed to the authors.
Glycan analysis of cRBCs U. Aich et al.
1712 FEBS Journal 278 (2011) 1699–1712 ª 2011 The Authors Journal compilation ª 2011 FEBS