Tài liệu Central bank rates, market rates and retail bank rates in the euro area in the context of the recent crisis docx
Bạn đang xem bản rút gọn của tài liệu. Xem và tải ngay bản đầy đủ của tài liệu tại đây (1.1 MB, 26 trang )
27
Central bank rates, market rates and retail bank rates in
the euro area in the Context of the reCent Crisis
Central bank rates, market rates and
retail bank rates in the euro area in
the context of the recent crisis
N. Cordemans
M. de Sola Perea
(1) Trichet (2009).
Introduction
The economic and financial crisis that arose in summer
2007 led to a significant increase in perceptions of risk
in the economy, resulting in a sizeable rise in risk and
liquidity premia on credit markets. Given the nature of
the crisis, the financial sector was particularly affected,
with respect to its financing via both the money market
and the bond market, which may have had an impact
on the retail interest rates offered by banks to busi-
nesses and households. Similarly, the sovereign debt crisis
that appeared in late 2009 may have had an impact on
financing costs in the private sector, insofar as sovereign
bond yields are often used as a reference for other inter-
est rates in the economy. The financial crisis, along with
the contagion effects of the sovereign debt crisis on the
banking sector, has also affected bank balance sheets and
weighed on their liquidity and solvency ratios. This may
have led banks to restrict the supply of credit or increase
their rate margins.
Against this backdrop, this article addresses recent trends
in the financing costs of various public and private sectors
in the euro area and Belgium. It pays particular attention
to the monetary policy transmission process via the inter-
est rate channel during the crisis and notably examines
the extent to which the process was affected by tensions
on sovereign debt markets. Furthermore, this article
looks at certain unconventional monetary policy decisions
adopted in the euro area (full liquidity allotment, longer-
term refinancing operations, covered bond purchases
and, more recently, the Securities Markets Programme).
Whereas some of these measures caused interest rates
to fall further, they were implemented primarily to keep
the monetary policy transmission mechanism functioning
properly
(1)
.
The first part of the article deals with the relation-
ship between Eurosystem monetary policy decisions and
market interest rates. It looks, on the one hand, at the
links between central bank rates and money market rates
and, on the other hand, at the trend during the crisis of
the risk-free yield curve, i.e. that of AAA-rated euro area
government bonds. The second section addresses the
question of long-term market rates harbouring credit risk.
We examine the financing costs of the public sector and
the financial and non-financial private sector, as well as
the relationship between the two, at both the euro area
and national levels. Lastly, part three is devoted to retail
bank interest rates. Using an econometric analysis, it seeks
to evaluate the impact of the financial crisis and the sover-
eign debt crisis on lending and deposit rates, at the level
of the euro area in general and in Belgium in particular.
The final section presents our conclusions.
We have used data available up to the end of May 2011
throughout the article, with the exception of the last part,
for which the data used are those available at the time
the econometric estimations were carried out, i.e. end of
April 2011.
28
(1) Aucremanne, Boeckx, Vergote (2007).
1. Monetary policy and market interest
rates
1.1 Central bank rates and money market rates
The Eurosystem is only able to directly influence very short-
term money market interest rates. It does so by adjusting
its injection of liquidity so that the Eonia rate – the over-
night interbank rate in the euro area – moves as close as
possible to the minimum bid rate on main refinancing
operations
(1)
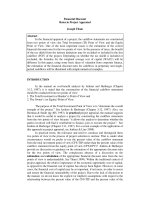
. In the wake of the tensions that arose from
9 August 2007 on interbank markets, the Eonia overnight
rate became more volatile. However, by adjusting the time
profile for supplying liquidity – notably by offering banks
the possibility of front loading – the Eurosystem managed
to stabilise Eonia around the main refinancing rate in the
first phase of the crisis. During this period, the cycle of
interest rate increases was temporarily interrupted, after
the central key rate had been raised to 4 % in June 2007.
It was not until July 2008 that it was raised to 4.25 %, in
a climate marked by surging inflation and the emergence
of potential second-round effects.
The morning after Lehman Brothers declared bankruptcy,
on 15 September 2008, the money market crashed.
Because the financial crisis represented a threat to the real
economy and price stability, the ECB decided to cut interest
rates substantially – by a total of 325 basis points between
October 2008 and May 2009 – and to take exceptional
monetary policy measures, including the adoption of a
fixed-rate, full-allotment policy. These actions contributed
heavily to the steep drop in the Eonia rate to a level below
the ECB’s main refinancing rate. In particular, the ECB’s
execution of a series of three one-year refinancing opera-
tions, respectively in July, September and December 2009,
generated an unprecedented increase in excess liquidity,
which notably resulted in massive use of deposit facilities
and a drop in Eonia to a level close to the deposit facil-
ity rate. As a result, Eonia stood at an average of 0.35 %
between July 2009 and June 2010, whereas the key inter-
est rate was only lowered to 1 %. The adaptation of the
process for issuing liquidity during the crisis profoundly
altered the relationship between the central key rate and
the overnight interbank market rate, which moved closer
in line with the deposit facility rate due to the significant
increase in excess liquidity. With the arrival at maturity of
the one-year financing operations in July, September and
December 2010, the level of excess liquidity fell sharply,
triggering not only an increase of, but also greater volatil-
ity in Eonia, which averaged 0.67 % in the first quarter
of 2011. In early April, the Governing Council decided to
raise its interest rates by 25 basis points, given the upside
risks to price stability. The decision was attributed to the
acceleration in inflation in early 2011, against a backdrop
of rising commodity prices, along with signals confirming
the euro area’s economic recovery. Considering the high
level of uncertainty still surrounding the health of financial
institutions, however, the Governing Council did not alter
its liquidity provision policy. In accordance with what was
announced in March, it was intended that refinancing
operations would continue in the form of fixed-rate ten-
ders with full allotment at least until the start of the third
quarter of 2011. The increase in key interest rates spurred
the Eonia rate higher, even though the full-allotment
liquidity policy was maintained.
Reflecting credit institutions’ reluctance to lend to one
another, the risk premium between three-month Euribor
and the Overnight Index Swap (OIS) climbed signifi-
cantly from the first signs of money market disruptions
in summer 2007. It subsequently moved in line with
the intensity of the turbulences, before peaking in early
October 2008. Since then, despite the fact that the ECB
has no direct control over the money market beyond the
immediate term, the rate cuts that it orchestrated and
the various steps that it took to provide liquidity made it
possible to considerably lower the three-month risk-free
rate and the three-month Euribor rate at which banks
lend to each other on the unsecured interbank market.
Given the reference role that Euribor plays in short-term
lending to the non-financial private sector, this decline
passed through to the financing costs of businesses and
households, and thus helped preserve efficient transmis-
sion of monetary policy. Since the end of 2009, the risk
premium appears to have moved largely as a function of
tensions on sovereign debt markets. In the first quarter
of 2011, it trended downwards, but the decline was
nevertheless more than offset by the increase in the risk-
free rate related to the rise in the Eonia rate. As a result,
the three-month Euribor averaged 1.2 % in the first five
months of 2011, compared with just 0.67 % on average
in the first half of 2010.
1.2 Monetary policy and long-term risk-free rates
Monetary policy only has a direct impact on very short-
term interest rates, whereas longer-term rates, at least
under normal conditions, are shaped largely indepen-
dently by the market. Monetary policy expectations,
which depend notably on central bank communication,
nevertheless play a significant role. During the crisis, the
Eurosystem did not actively communicate on future rate
trends, unlike, for example, the US Federal Reserve. After
29
Central bank rates, market rates and retail bank rates in
the euro area in the Context of the reCent Crisis
Chart 1 USE OF THE DEPOSIT FACILITY AND EURO AREA MONEY MARKET INTEREST RATE
(daily data)
0
50
100
150
200
250
300
350
400
0
1
2
3
4
5
6
7
8
2007 2008 2009 2010 2011
16/1
13/2
13/3
17/4
14/5
12/6
10/7
7/8
11/9
9/10
13 /11
11/12
15/1
12/2
11/ 3
15/4
13/5
10/6
8/7
12/8
9/9
7/10
11/11
9/12
20/1
10/2
10/3
7/4
12/5
9/6
7/7
11/8
8/9
13/10
10/11
7/12
19/1
9/2
9/3
13/4
11/5
15/6
13/7
10/8
7/9
12/10
9/11
7/12
18/1
9/2
9/3
13/4
11/5
KEY INTEREST RATES, EONIA AND USE OF THE DEPOSIT FACILITY
Use of the deposit facility (€ billion) (left-hand scale)
Marginal lending facility rate
Deposit facility rate
Central reference rate
Eonia
(right-hand scale)
Maintenance periods
0
1
2
3
4
5
6
0
1
2
3
4
5
6
2007 2008 2009 2010 2011
Three-month OIS
Three-month Euribor-OIS spread
Three-month Euribor
THREE-MONTH MONEY MARKET INTEREST RATE
:
EURIBOR AND OVERNIGHT INDEX SWAP (OIS)
Sources : Thomson Reuters Datastream, ECB.
lowering its interest rate as far as it could go, the Fed
announced that it intended to keep rates at that level
for a prolonged period. However, the Eurosystem’s com-
munication regarding the economic outlook and the lack
30
Chart 2 RISK-FREE YIELD CURVE
(yield on AAA-rated euro area government bonds at various maturities, in percentage points)
(1)
(2)
(3)
(4)
(5)
(6)
1 year
2
3
4
5 year
6
7
8
9
10 year
11
12
13
14
15 year
16
17
18
19
20 year
0.0
0.5
1.0
1.5
2.0
2.5
3.0
3.5
4.0
4.5
5.0
0.0
0.5
1.0
1.5
2.0
2.5
3.0
3.5
4.0
4.5
5.0
2 July 2007 12 September 2008
13 May 2009 8 June 2010
3 months
1 year
2
3
4
5 year
6
7
8
9
10 year
11
12
13
14
15 year
16
17
18
19
20 year
0.0
0.5
1.0
1.5
2.0
2.5
3.0
3.5
4.0
4.5
5.0
0.0
0.5
1.0
1.5
2.0
2.5
3.0
3.5
4.0
4.5
5.0
8 June 2010
17 February 2011
25 August 2010
31 May 2011
3 months
Source : ECB.
– at least initially – of an upside risk to price stability led
to a succession of downward revisions in expectations
regarding the direction of monetary policy, resulting in a
decline in long-term interest rates. The Fed also initiated
a significant programme of Treasury bond purchases to
lower longer-term rates. The Eurosystem did not adopt
an equivalent unconventional policy. However, by provid-
ing longer-term liquidity – up to one year – it was able to
put significant downward pressure on longer-term rates.
Under these conditions, it is interesting to examine move-
ments in the risk-free yield curve, measured in this case
by the yield on AAA-rated euro area government bonds,
during the crisis.
In early July 2007, the yield curve was relatively flat and
slightly positive, principally reflecting expectations that
the cycle of rate rises initiated by the ECB in 2005 – the
rate had been raised from 2 % to 4 % between December
2005 and June 2007 – would continue. Since then, the
curve’s principal movements can be split into six stages :
1. Despite the rise in short-term rates that followed the
Eurosystem’s July 2008 decision to raise its rates by
25 basis points, slightly longer-term rates dropped,
attesting to expectations of slower economic growth
and a downward revision in expectations regarding
short-term rates, no doubt linked in part to financial
market turmoil.
2. At the same time as the ECB cut rates and adopted
a first round of non-standard measures, short-term
rates plunged, causing the yield curve to steepen
considerably. Such a steepening is normal during a
phase of monetary policy easing, but the move was
particularly pronounced during the present crisis due
to the speed and size of the monetary easing that
took place. Already by 13 May 2009 – when the first
operations at 1 % were carried out – the three-month
yield on risk-free government bonds was 0.67 %, or
slightly lower than the secured interbank market rate,
reflecting a “flight to quality” that benefited the safest
government securities.
3. Following the three one-year operations and the
resulting strong growth in excess liquidity, three-month
yields and those with intermediate maturities contin-
ued to decline. With the persistence of a high degree
of uncertainty and intensification of the sovereign debt
crisis, they exerted downward pressure on longer-term
yields.
4. After the first one-year operation reached maturity,
which resulted in a steep drop in excess liquidity, short-
term rates rose slightly. With conditions still marked
by tremendous uncertainty regarding the speed of the
global economic recovery and deflationary risks across
the Atlantic, longer-term rates nevertheless continued
31
Central bank rates, market rates and retail bank rates in
the euro area in the Context of the reCent Crisis
Chart 3 YIELD SPREADS ON EURO AREA PUBLIC AND
PRIVATE SECTOR BONDS RELATIVE TO THE
GERMAN BUND
(all maturities combined, indices weighted by outstanding
amounts, daily data, in percentage points)
0
1
2
3
4
5
6
7
0
1
2
3
4
5
6
7
2007 2008 2009 2010 2011
Financial sector
Non-financial sector
Public sector
First stage
of the crisis
Second stage
of the crisis
Sovereign
debt crisis
Source : Thomson Reuters Datastream.
to decline, reaching a floor during the Jackson Hole
Conference in late August 2010. The ten-year yield
on risk-free euro area government debt bottomed out
at 2.5 %.
5. Signalling a better growth outlook and the disappear-
ance of deflationary fears, long-term rates bounced
back strongly in early 2011. In line with the rise in
very short-term money market rates, short-term risk-
free yields on government borrowings also rose. The
fairly pronounced increase in yields on intermediate
maturities reflects a considerable upward revision in
monetary policy expectations, partly related to the
change in short- and medium-term inflation risks. It
is also interesting to note that the yield curve became
concave again in early 2011.
6. Following the ECB’s decision to raise its key interest
rates by 25 basis points in April, the rise in short-term
rates continued into the early part of the second quar-
ter. On the other hand, the renewed climate of uncer-
tainty on the financial markets exerted downward
pressure on longer-term risk-free rates.
2. Long-term market interest rates with
credit risk
The economic and financial crisis caused an increase
in risk perceptions on the part of financial market par-
ticipants and resulted in a significant increase in risk and
liquidity premia in every segment of the credit market.
As a result, we saw a very clear differentiation in financ-
ing costs among borrowers, both public and private. In
this section, we look specifically at the trend in spreads
between the financing costs of various sectors through-
out the crisis. After a quick review of the situation at the
euro area level, we examine the situations of individual
countries, moving from the public sector to the financial
private sector and the non-financial private sector. We
focus in particular on the extent to which the widening
gap in financing costs among public sectors from end-
2009 was passed on in the financing costs of the two
other sectors, and thereby attempt to gauge the impact
of the sovereign debt crisis on private sector financing
costs in the euro area.
2.1 Euro area level
From the first signs of money market tensions in summer
2007, yield spreads relative to the German Bund of the
same maturity
(1)
widened for bonds issued by every sector
and in particular the financial sector, whose institutions
(1) The “Bund” is the abbreviation for the long-term bonds issued by the German
government. They are rated AAA by all rating agencies and their yields generally
serve as a benchmark for the entire euro area bond market.
were hit with heavy losses stemming from the subprime
mortgage crisis in the US. The day after the Lehman
Brothers bankruptcy in autumn 2008, they skyrocketed,
ultimately narrowing considerably from March 2009 in
the midst of a broad financial market recovery.
In the early stages of the crisis, the various sectors’ yield
spreads versus the Bund moved more or less in the
same direction, albeit in varying proportions. In autumn
2009, however, the emergence of the public debt crisis
marked the start of a partial decoupling of public sector
borrowing costs from those of the non-financial private
sector, as the trend in the bond yield spread of the two
sectors shows. As public sector borrowing costs rose, the
spread was whittled down to nothing, and even became
negative temporarily in 2010, whereas the same yield
spread between public sector and financial sector bonds
remained substantially positive.
These developments tend to show that the public debt
crisis had a definite impact on the financing costs of the
financial sector, but only a limited impact on the rest of
the private sector at the aggregate level. Similar conclu-
sions emerge from a comparison of the yield spreads
32
Chart 4 YIELD SPREAD OF PRIVATE SECTOR BONDS IN THE EURO AREA AND US
(all maturities combined, indices weighted by outstanding amounts, daily data, in percentage points)
0
2
4
6
8
10
0
2
4
6
8
10
2007 2008 2009 2010 2011
0
2
4
6
8
10
0
2
4
6
8
10
2007 2008 2009 2010 2011
Euro area
US
FINANCIAL SECTOR YIELD SPREAD
(1)
NON-FINANCIAL SECTOR YIELD SPREAD
(1)
Source : Thomson Reuters Datastream.
(1) Respectively versus the German Bund (euro area) and US Treasury Bill (US).
Chart 5 YIELD SPREAD ON 10-YEAR GOVERNMENT
BONDS VERSUS THE GERMAN BUND IN EURO
AREA COUNTRIES
(indices weighted by outstanding amounts, daily data,
in percentage points)
2009
2011
2007
2005
2003
2001
1997
1999
–2
0
2
4
6
8
10
12
14
16
–2
0
2
4
6
8
10
12
14
16
LLLLLLLLLLLLLL
FranceBelgium Greece
Ireland Italy Portugal
Spain
Source : Thomson Reuters Datastream.
for the euro area and the US. For example, the risk and
liquidity premia demanded of US financial corporations
relative to the Treasury bill fell substantially from late
2009, whereas the premia demanded of European finan-
cial companies vis-à-vis the Bund held fast. In the case
of non-financial corporations, differences in interest rate
movements compared to risk-free rates between the euro
area and the United States are much less pronounced.
As relevant as they are, these aggregate results are never-
theless biased by the significant weight of large countries
– which benefited from the debt crisis – in indices, and
they may obscure very different situations in individual
countries. The next section will study the latter and, after
an overview of the financing costs of euro area public
sectors, examine the repercussions of the debt crisis on
the cost of borrowing on the market for financial and
non-financial private sectors at the country level.
2.2 Country level
2.2.1 Public sector
Whereas immediately prior to the third stage of Economic
and Monetary Union, in January 1999, the government
bond yields of each of the participating countries rapidly
converged toward that of the German Bund, significant
yield spreads emerged as early as summer 2007. After
the fall of Lehman Brothers, divergences increased sig-
nificantly, and, as macroeconomic conditions worsened,
33
Central bank rates, market rates and retail bank rates in
the euro area in the Context of the reCent Crisis
Box 1 –
The Securities Markets Programme (SMP) and other ECB actions
intended to limit the impact of the sovereign debt crisis on the
monetary policy transmission mechanism
Given the reference role played by government bond yields in determining interest rates for private sector lending
(asset price channel), the use of sovereign bonds as collateral in bank refinancing operations (liquidity channel) and
their weight on the balance sheets of credit institutions (balance sheet channel), an efficiently functioning public
debt market plays a key role in the mechanism for the transmission of monetary policy to the real economy in the
euro area. This is why, amid a climate of growing investor concern over the viability of public finances in numerous
countries and the rapid rise in the borrowing costs of numerous governments, in spring 2010 the Governing
Council adopted a series of measures to maintain efficient policy transmission.
In particular, on 10 May 2010, the Governing Council decided to intervene in bond markets by creating the
Securities Markets Programme (SMP). Under the SMP, the Eurosystem may conduct interventions in the euro
area’s public and private debt securities secondary markets in order to ensure the stability and liquidity of market
segments that have experienced severe disruptions. Like the other non-standard monetary policy measures, the
programme is temporary and is carried out in pursuit of the Eurosystem’s primary objective : medium-term price
stability. Its goal is to ensure that adequate transmission of monetary policy continues, but without affecting its
direction. To this end, purchases made under the programme are systematically sterilised through operations
specifically designed to reabsorb the liquidity injected. Most purchases under the SMP were made in the first few
weeks after the programme was implemented.
Furthermore, in order to insulate banking institutions against the effects of additional weakening of sovereign
bond ratings, the Governing Council suspended the minimum eligibility requirements for debt instruments issued
or backed by the Greek government (in May 2010) and the Irish government (in March 2011) used as collateral.
This means that Greek and Irish government debt is currently accepted as collateral for refinancing operations
regardless of rating. These decisions were taken following the Governing Council’s backing for the economic
and financial adjustment programmes adopted by the countries in question, which formed the basis for the
rescue plans put together by the European Commission and the IMF. This also implies that any suspension of the
minimum eligibility threshold is conditional on correct implementation of the adjustment programmes.
Lastly, to ensure broad access to liquidity for credit institutions in the euro area in the face of a risk of paralysis
on the interbank market, in May 2010 the Governing Council reintroduced a certain number of measures that it
had previously abandoned. These included offering banks the possibility of obtaining liquidity in US dollars, and
a six-month operation was carried out, while three-month operations were conducted again with full allotment.
factors specific to each economy gained in importance.
Starting in late 2009 with the emergence of the sovereign
debt crisis, the credit risk factors of individual countries
became a determining factor. To begin with, Greek woes
weighed principally on the yields of its own government
bonds, but a contagion effect swiftly appeared and a gen-
eral wariness took hold. Investors retreated to the least
risky securities and the most liquid markets, driving yield
spreads to record highs.
Since autumn 2010, uncertainty linked to the cost of the
Irish bank sector bail-out, fears related to the political or
macroeconomic situation in numerous other countries,
the lack of detail regarding the future mechanism for
resolving euro area crises and speculation about a possible
Greek debt restructuring continued to fuel the widening of
yield spreads, which became particularly pronounced. For
example, at end-May 2011, the unweighted average yield
spread versus the ten-year German Bund was around 340
basis points (compared with 13 on average over the period
1 January 1999 to 31 July 2007). Moreover, there were sig-
nificant disparities within that figure, including a spread of
more than 1 320 basis points for Greece, but only 41 points
for France and 32 points for the Netherlands. The spread
for Belgium was around 120 basis points at end-May 2011,
after reaching nearly 140 points at end-November 2010.
34
Chart 6 YIELD ON EURO AREA FINANCIAL SECTOR BONDS
(all maturities combined, indices weighted by outstanding amounts, monthly data, in percentage points)
0
2
4
6
8
10
12
14
16
0
2
4
6
8
10
12
14
16
2008
2009 2010
2011
0
2
4
6
8
10
12
14
16
0
2
4
6
8
10
12
14
16
2008 2009 2010
2011
IMPLIED YIELD TO MATURITY
YIELD SPREAD VERSUS GOVERNMENT BONDS OF
THE SAME MATURITY
(1)
FranceBelgium Germany Ireland Italy Portugal Spain
Source : Barclays Capital.
(1) So as not to introduce maturity bias, the yields on government debt used here were selected so as to ensure optimal correspondence between the maturities on public and
private bonds.
2.2.2 Private sector
In the early stages of the crisis, the trend in financial and
non-financial private sector financing costs
(1)
tended to
reflect their intrinsic weaknesses. For example, Irish finan-
cial sector bond yields were particularly high due to the
bursting of the country’s real estate bubble. To a lesser
extent, the Belgian financial sector experienced a sharp
increase in its bond yields in autumn 2008 and early 2009
against the backdrop of the difficulties experienced by the
main banking groups. As for the non-financial sector, it is
striking to observe that the differences in financing costs
between countries remain much less pronounced than
in the financial sector. Only the Irish non-financial sector
stood out noticeably from the early part of 2009, which is
in keeping with the country’s particularly severe economic
slowdown.
With the arrival of the sovereign debt crisis, however, bor-
rowing costs began to better reflect the financial health
of individual countries, particularly for the financial sector.
In general, the borrowing costs of financial companies
in troubled countries rose substantially, whereas those
in financially healthier countries proved quite resilient.
For example, the cost of borrowing via the market in the
Spanish financial sector, which was one of the lowest
in the euro area at end-2009, climbed sharply over the
(1) The data considered here are averages, weighted for outstanding amounts, of the
implied yields on baskets of the uncovered bonds of financial and non-financial
corporations. They reflect the market financing costs of the private sector in each
country. However, they are not a perfect indicator because only a handful of
companies are represented and the data are influenced by bonds issued during
the reference period. The conclusions drawn from this analysis must therefore be
interpreted with caution, particularly with respect to smaller countries, where few
companies have access to financial markets for their financing. This is why we
have excluded Greece from this analysis.
course of 2010, whereas that of the German financial
sector remained stable. The direct link between the
financing costs of the public and financial sectors can
also be illustrated by the relative stability of yield spreads
between financial sector and public sector bonds from
autumn 2009 onwards.
However, these close relationships do not in any way
indicate a causal link, which, in the context of a financial
crisis, must be considered in both directions. It is evident,
for example, that in Ireland the financial sector bail-out
was more of a burden on government financing costs,
whereas in Greece, it was the banking institutions that
fell victim to the country’s poor management of its public
finances.
35
Central bank rates, market rates and retail bank rates in
the euro area in the Context of the reCent Crisis
Box 2 – ECB Covered Bond Purchase Programme
Alongside conventional bonds, covered bonds are an important financing tool for banks in several euro area
countries. The yield on these instruments shot up following the Lehman Brothers failure, potentially disrupting
the financing of many credit institutions. Under these conditions, and to give a shot in the arm to a market
that had grown sluggish, the ECB announced on 7 May 2009 that it would launch a Covered Bond Purchase
Programme (CBPP). This programme, which sought to bolster the supply of bank credit to non-financial sectors
of the economy, ran from 6 July 2009 to 30 June 2010 and resulted in asset purchases for a nominal amount of
€ 60 billion. Yield spreads narrowed after the programme was launched. Certain markets also saw a significant
increase in the number of issuers and amounts outstanding, and thus a deepening and broadening of their covered
bond markets.
With tensions on public debt markets intensifying in spring 2010, the yield on covered bonds in the most hard-hit
countries (Ireland and Spain) again began to spike, whereas the French and German markets were mostly spared.
The ECB’s purchase programme was justified in the early stages of the crisis by intrinsic problems experienced by
covered bond markets throughout the euro area – all countries had been affected. By contrast, such a programme
was not justified in the context of the sovereign debt crisis, when covered bond market disruptions were essentially
due to individual governments’ public financing woes. In this case, the measures described in Box 1 are more
appropriate.
COVERED BOND YIELD SPREAD
(1- to 3-year maturities, yield spreads with the German Bund of the same maturity,
indices weighted by outstanding amounts, daily data, in percentage points)
–1
0
1
2
3
4
5
6
7
8
9
–1
0
1
2
3
4
5
6
7
8
9
2007 2008 2009 2010 2011
France
Ireland
Italy
Germany
Spain
ECB announcement
of its covered bond
purchase programme
Start of
the programme
End of the
programme
Source : Thomson Reuters Datastream.
36
Chart 7 YIELDS ON NON-FINANCIAL SECTOR BONDS IN THE EURO AREA
(all maturities combined, indices weighted by outstanding amounts, monthly data, in percentage points)
0
2
4
6
8
10
0
2
4
6
8
10
2008
2009 2010
2011
–5
–4
–3
–2
–1
0
1
2
3
4
5
–5
–4
–3
–2
–1
0
1
2
3
4
5
2008 2009 2010 2011
–6 –6
IMPLIED YIELD TO MATURITY
FranceBelgium Germany Ireland Italy Portugal Spain
YIELD SPREAD VERSUS GOVERNMENT BONDS OF
THE SAME MATURITY
(1)
Source : Barclays Capital.
(1) So as not to introduce maturity bias, the yields on government debt used here were selected so as to ensure optimal correspondence between the maturities on public
and private bonds.
As for the non-financial sector, the spread in financing
costs relative to the public sector tended to diminish. In
many countries, in fact, there was a decoupling of financ-
ing costs between the non-financial and public sectors.
This decoupling is particularly evident in the cases of the
most troubled countries, and it is interesting to note that
a certain number of Portuguese and Irish companies are
currently obtaining financing at a lower interest rate than
their respective governments. However, it is important
to note that the indices sometimes include only a small
number of companies, some of which are the subsidiar-
ies of large international corporations, and thus do not
necessarily reflect the borrowing costs of all companies
in the country.
The analysis of financing costs via the market of the
national private sectors thus amply confirms the conclu-
sions of the analysis at the euro area level, i.e. that the
sovereign debt crisis has had a significant impact on the
borrowing costs of the financial sector, but a limited
impact on those of the non-financial sector. Furthermore,
it highlights the close link at the national level between
the borrowing costs of the public sector and those of the
financial sector.
3. Retail interest rates
Trends in money market interest rates and bond yields
reflect both monetary policy decisions and the impact of
the financial crisis and, more recently, the sovereign debt
crisis on banks’ financing costs. These trends in turn can
influence the interest rates that banks offer to households
and businesses. This section looks specifically at the trans-
mission of changes in interest rates between the market
interest rates and the retail interest rates. Following a brief
description of retail interest rate trends during the crisis,
we seek to determine the most relevant market rate for
the formation of each retail interest rate analysed and
examine what this relationship implied in terms of mon-
etary transmission during the crisis.
3.1 Retail interest rate trends in the euro area
during the crisis
Retail bank interest rates on both deposits and loans in
the euro area have converged strongly since the establish-
ment of the Economic and Monetary Union. However,
they were affected to different degrees by the effects of
the financial crisis and the turmoil on sovereign debt mar-
kets. Moreover, they have moved in different ways follow-
ing the changes in key interest rates decided by the ECB.
This section analyses their trends since the start of 2008.
37
Central bank rates, market rates and retail bank rates in
the euro area in the Context of the reCent Crisis
Chart 8 SHORT-TERM AND LONG-TERM DEPOSIT INTEREST RATES IN EURO AREA COUNTRIES
(monthly data)
2008
2009
2010
2011
0
1
2
3
4
5
6
2008
2009
2010
2011
0
1
2
3
4
5
6
Greece
Countries unaffected by the sovereign debt crisis
(1)
Belgium
IrelandPortugal
Spain
INTEREST RATES ON SHORT-TERM DEPOSITS
INTEREST RATES ON LONG-TERM DEPOSITS
Sources : NBB, ECB.
(1) Germany, Austria, Finland, France and the Netherlands.
The retail interest rates presented in this article come from
the harmonised survey of monetary financial institution
interest rates in the euro area (MIR). The data are avail-
able at monthly intervals since January 2003. This survey
took the place of the retail interest rate (RIR) survey,
which supplied non-harmonised statistics on bank inter-
est rates
(1)
. In the framework of this analysis, we use the
rates applied to new business in order to accurately gauge
changes over time. These are synthetic interest rates
which correspond to the average interest rates, weighted
by outstanding amounts, applied by the monetary and
financial institutions in each country. Their levels are thus
influenced by the relative weight of the maturities of their
components : given the positive slope of the yield curve
during the crisis, the greater the amounts at short maturi-
ties, the lower the average interest rate level, and vice
versa. As a result, to a certain extent the differences in
level reflect country preferences with respect to maturity
and, thus, must be interpreted somewhat cautiously. The
series relative to countries unaffected by the sovereign
debt crisis (Germany, Austria, Finland, France and the
Netherlands) is the average of bank interest rates applied
in those countries, weighted by the amounts on new
contracts. This article covers the period from January 2008
to March 2011, the last month for which the data were
available at the end of May 2011.
In general, in keeping with the trend in market interest
rates, short-term rates moved more substantially than
did long-term rates, reacting more notably to both the
increase in central bank rates in June 2008 and the suc-
cessive rate cuts decided by the ECB from October 2008.
In the case of deposit rates, the interest rate on short-term
deposits corresponds to the average rate, weighted by
outstanding amounts, of deposits of less than one year
made by households and businesses, whereas the long-
term interest rate is equal to the average interest rate on
deposits of more than one year. The general downward
trend that began in autumn 2008 was in keeping with
the trend in market interest rates. However, the trans-
mission was not uniform among countries. For exam-
ple, it appears that from autumn 2008, the dispersion
of interest rates increased substantially, particularly for
short-term rates. Furthermore, the dispersion intensified
(1) For a detailed description of the differences between the two surveys, see
Baugnet and Hradisky (2004).
38
Chart 9 SHORT-TERM LENDING INTEREST RATES IN EURO AREA COUNTRIES
(monthly data)
2008
2009
2010
2011
0
1
2
3
4
5
6
7
8
2008
2009
2010
2011
0
1
2
3
4
5
6
7
8
Greece
Countries unaffected by the sovereign debt crisis
(1)
Belgium
IrelandPortugal
Spain
INTEREST RATES ON LOANS TO NON-FINANCIAL CORPORATIONS INTEREST RATES ON LOANS FOR HOUSE PURCHASE
Sources : NBB, ECB.
(1) Germany, Austria, Finland, France and the Netherlands.
starting in 2010 against the backdrop of the sovereign
debt crisis : from early 2010, short-term interest rates
increased in the countries most affected by financial dif-
ficulties (particularly Greece, Spain and Portugal), whereas
in the least affected countries, the rise in interest rates
on short-term deposits has been more recent and much
less pronounced. This may be because credit institutions
in the countries hit hardest by the crisis wanted to limit
fund withdrawals in order to hold on to a vital source of
financing and thus prevent further weakening of their
balance sheets.
With respect to lending rates, interest rates on short-
term loans to non-financial corporations include rates
on loans of less than one year for amounts above and
below € 1 million. As with short-term deposit rates, they
rose over the course of 2008 before plunging abruptly
following the interest rate cuts orchestrated by the ECB.
Furthermore, during the downward movement, dispari-
ties between countries increased. Initially, these disparities
were relatively limited and appear to be largely attribut-
able to varying trends in the average maturity of loans
between countries. However, they increased significantly
starting in late 2009 and especially early 2010, when the
credit institutions in the countries hit hardest by the sover-
eign debt crisis raised their interest rates more vigorously
than those in other countries, thereby passing on the
increase in their financing costs.
Interest rates on floating-rate loans for house purchase
with an initial rate fixation period of up to one year
(treated here as short-term rates) also reflected the
upward trend through October 2008 and the decrease
in central bank rates thereafter. However, the dispersion
between the interest rates of various countries remained
relatively limited, although it also increased towards the
end of 2009. As with loans to non-financial corporations,
the banks in the countries hit hardest by the sovereign
debt crisis appear to have raised their interest rates more
than institutions in other countries, but the upward move-
ment is much less pronounced than in short-term loans to
non-financial corporations.
Long-term lending rates correspond to the interest rates
on loans of more than one year. In general, the same
observations can be made as for short-term lending rates.
These rates followed the trend in market interest rates,
although to a lesser extent because long-term interest
39
Central bank rates, market rates and retail bank rates in
the euro area in the Context of the reCent Crisis
Chart 10 LONG-TERM LENDING INTEREST RATES IN EURO AREA COUNTRIES
(monthly data)
2008
2009
2010
2011
0
1
2
3
4
5
6
7
8
9
10
2008
2009
2010
2011
0
1
2
3
4
5
6
7
8
9
10
Greece
Countries unaffected by the sovereign debt crisis
(1)
Belgium
IrelandPortugal
Spain
INTEREST RATES ON LOANS TO NON-FINANCIAL CORPORATIONS
INTEREST RATES ON LOANS FOR HOUSE PURCHASE
Sources : NBB, ECB.
(1) Germany, Austria, Finland, France and the Netherlands.
rates are relatively more stable, and dispersion increased
in the context of the sovereign debt crisis. The significant
volatility observed in several countries with respect to
interest rates on loans to non-financial corporations can
be explained by the relative weakness and volatility of the
amounts of this type of loan. In the countries hit hard-
est by the sovereign debt crisis, the weight of long-term
loans is fairly small compared with short-term loans. More
generally, short-term lending plays a preponderant role in
these countries, and the importance of short-term interest
rates is much greater in these countries compared with
the euro area average.
Overall, retail interest rates in Belgium are similar to those
in the countries unaffected by the sovereign debt crisis,
and in some cases are lower. The particularly moderate
level of short-term interest rates offered to non-financial
corporations is attributable to the relatively high level
of very short-term maturities for loans to and deposits
of non-financial corporations : deposits of less than one
month of non-financial corporations represent approxi-
mately 40 % of all deposits of less than one year, and
because they are based on the Euribor of the correspond-
ing maturity, they negatively affect the aggregate interest
rate level for all deposits of less than one year. Similarly,
between 40 % and 50 % of short-term loans to non-
financial corporations have a maturity of less than one
month. As for long-term business loans, shorter maturities
are also relatively more important, which explains the low
level of the synthetic interest rate.
The moderate increase in Belgian interest rates since the
start of 2010 corroborates the conclusion cited above, i.e.
that the repercussions of the sovereign debt crisis on the
financing costs of Belgian banks have so far been limited,
although they have tended to increase since the end of
2010.
3.2 Analysis of the transmission mechanism to
retail interest rates during the crisis
To analyse the question of monetary policy transmis-
sion during the crisis, first of all we must determine if
the relationship between market interest rates and retail
interest rates was stable over the period, while also trying
to determine the market interest rates most relevant for
explaining the formation of retail interest rates.
40
Chart 11 SHORT- AND LONG-TERM MARKET INTEREST RATES
(monthly data)
1997
1999
2001
2003
2005
2007
2009
2011
0
1
2
3
4
5
6
0
1
2
3
4
5
6
1997
1999
2001
2003
2005
2007
2009
2011
0
1
2
3
4
5
6
7
0
1
2
3
4
5
6
7
Three-month OIS
SHORT-TERM RATES LONG-TERM RATES
Seven-year swap rate
Seven-year government bond yield (euro area)
Seven-year government linear bond yield (Belgium, OLO)
Three-month Euribor
Sources : NBB, ECB.
Box 3 – Market interest rates used in this article
Eonia (Euro OverNight Index Average) : the reference rate for unsecured overnight interbank lending in the
euro area. Under normal circumstances, this is the rate that the ECB seeks to influence.
In the years preceding the crisis, the market interest rates
likely to be the reference rates for retail rate formation
followed very similar trends. This made it difficult to deter-
mine unambiguously which rate was used to set retail
rates. However, one of the consequences of the financial
crisis has been a widening of spreads between market
rates with similar maturities, which makes it possible to
determine with greater precision the most relevant rate
for the formation of retail interest rates. This exercise can
be applied both to short-term interest rates and longer-
term maturities. Since August 2007, there has been a con-
siderable spread between Euribor and OIS rates, whereas
long-term swap rates and government bond yields did not
diverge until late 2009 (and especially since 2010), when
the sovereign debt crisis intensified.
Divergences between market interest rates during the
crisis will thus allow us to examine this question, but also
to observe possible disruptions in the monetary policy
transmission mechanism attributable to the crisis, as well
as the possible transmission of risk premia related to the
crisis. Thus, if the analysis shows that the relevant short-
term interest rate is Euribor, this indicates that the spread
relative to OIS was transmitted to retail interest rates,
which may be considered a disruption of the transmission
mechanism. As for long-term interest rates, if the relevant
rate is the rate at which the government borrows, the sov-
ereign debt crisis might also represent a disrupting factor
in the transmission mechanism.
41
Central bank rates, market rates and retail bank rates in
the euro area in the Context of the reCent Crisis
3.2.1 Methodology
The theory suggests that there is a stable relationship
between the market interest rate and the retail interest
rate, and that causality moves from market rates towards
retail rates. In practice, this assumption can be tested
using a vector error correction model (VECM), which
Three-month Euribor (Euro Interbank Offered Rate) : the reference rate for three-month unsecured inter-
bank loans. The three-month Euribor rate is often used as a reference for setting interest rates on loans to
households and non-financial corporations. Euribor is also calculated for other maturities ranging from one
week to twelve months. This article also uses the six-month Euribor.
Three-month OIS rate (Overnight Indexed Swap rate) : this is the fixed rate paid in exchange for a stream
of payments based on the Eonia overnight rate over a three-month period. It mainly reflects market expecta-
tions regarding the overnight rate over the coming three months. The three-month Euribor-OIS spread provides
a measure of credit and liquidity risk on the unsecured money market. As such, it is a good indicator of the
tensions affecting it. This article also uses the six-month OIS.
Seven-year swap rate : fixed interest rate paid in exchange for a stream of payments based on six-month
Euribor over a period of seven years. This rate is not affected by credit risk, but rather by the risk of default of
the parties. Swap rates also exist for other maturities.
Seven-year government bond yield : a long-term yield on sovereign debt. The spread between the seven-
year swap rate and the seven-year government bond yield provides a measure of credit and liquidity risk on the
sovereign debt market.
Δbr
t
= α
br
(br
t–1
– ßmr
t–1
– γ) + ∑ �
br,t–i
Δbr
t –i
+∑ θ
br,t–i
Δmr
t–i
+ u
br,t
n
i=
1
n
i=
1
Δmr
t
= α
mr
(br
t–1
– ßmr
t–1
– γ) + ∑ �
mr,t–i
Δbr
t –i
+∑ θ
mr,t–i
Δmr
t–i
+ u
mr,t
n
i=
1
n
i=
1
The estimated formal relationship is as follows :
assumes a stable relationship between the two rates over
the long term. This method is commonly used to analyse
monetary policy transmission
(1)
, because this type of
model makes it possible to estimate the long-term rela-
tionship, the direction of the causality, and the short-term
dynamic for the two variables in question.
where br is the retail bank interest rate, mr is the market
interest rate used as a reference, the coefficients
α rep-
resent the speeds of adjustment towards the long-term
equilibrium,
β measures the degree of transmission over
the long term, the coefficients
θ and δ measure the short-
term dynamic, and u are the error terms. The term in the
parentheses is the cointegration vector and represents
the long-term relationship between the interest rates,
whereas the rest of each of the equations shows the
short-term dynamic. The constant (
γ) included in the error
correction term makes it possible, in this basic model, to
account for other factors that influence the determination
of the interest rates and that are not specified in our anal-
ysis (such as the effects of competition among banks). The
number of lags used in each model (n) is chosen accord-
ing to the Schwarz information criterion. There is a stable
long-term relationship – the so-called cointegration rela-
tionship – between the market interest rate and the retail
interest rate, and the causality of this relationship goes in
(1) See, for example, Mojon (2000); Toolsema, Sturm and Haan (2002) ; Baugnet and
Hradisky (2004) ; Sorensen and Werner (2006); and ECB (2009).
42
(1) A Choleski decomposition (Enders (2003)) was used for this purpose. In choosing
the order of the variables, the market interest rate was treated as the most
exogenous rate (no contemporary impact of the retail interest rate on the market
interest rate).
(2) While the use of these non-homogeneous series is not ideal, it is warranted in
cases such as this one where the alternative is to resign oneself to using a smaller
amount of data. We follow an approach used by the ECB (ECB (2009)).
the right direction – i.e. from the market interest rate to
the retail interest rate – if α
br
is significantly negative (the
more negative it is, the faster the adjustment towards
the long-term relationship) and if, by contrast, α
mr
is not
significantly different from zero. Consequently, estimating
the complete system, and not just the retail interest rate
equation, enables us to verify the robustness of the initial
assumption. The degree of transmission over the long
term, for its part, indicates the extent to which the retail
interest rate incorporates changes in the market interest
rate over the long run. A unitary degree of transmission (
β
=1) indicates a complete pass-through. Furthermore, deal-
ing with both interest rates in an integrated system makes
it possible – through an orthogonal transformation of the
error terms u
(1)
– to break down the variation in the two
variables as being the result of two structural shocks : one
affecting the market interest rate and the other affecting
the retail interest rate.
Each retail interest rate studied is set against two refer-
ence market interest rates, with the goal of determining
which rate is the most relevant to the formation of retail
interest rates. The short-term market interest rates are
OIS and Euribor. The long-term market interest rates are
the swap rate and the government bond yield for the cor-
responding maturity. Each model is, moreover, estimated
using two samples to test the stability of the relationship
between each of the market rates and the retail rate. The
first sample covers the period leading up to the crisis ; it
begins in January 1997 and ends in July 2007. The second
sample includes the crisis period and ends in February
2011, last month for which data were available at the
time of running the estimations. The results of these esti-
mations are summarised in a table in the annex.
For each of the estimated models, the analysis of the
impulse response functions and the historical decomposi-
tions will provide a response to the questions posed.
The impulse response functions will show how the retail
interest rate reacts to a shock to the market interest rate.
Observing this reaction before and after the crisis, consid-
ering each of the market interest rates, will indicate the
stability of the relationships between the retail interest
rate and each of the market interest rates, which will help
determine the most relevant market rate. The rate whose
relationship with the retail interest rate is characterised
by a significant degree of stability can be considered the
most relevant market interest rate.
The technique of historical decomposition enables us to
determine the extent to which the retail interest rate is
explained by :
– a reference level (forecast of the variable in the absence
of a shock to the market interest rate or to the retail
interest rate) ;
– the contribution of a shock to the market interest rate
(dynamic effect on the retail interest rate of a normal
transmission of variations in the market interest rate) ;
– the contribution of a shock to the retail interest rate
itself (which explains the specific movements in the
retail interest rate not attributable to the second factor).
If the model corresponds to the initial hypothesis, i.e.
that the market interest determines movements in the
retail interest rate, the portion attributable to shocks to
the market interest rate will be larger than the portion
due to shocks to the retail interest rate itself. If, however,
the financial crisis affects retail interest rates and the
transmission mechanism (beyond the influence linked to
the choice of relevant market interest rate), this impact
will show up in the presence of the contribution of this
second shock. Furthermore, the sign of the contribution
of this shock during the financial crisis is an important
part of the analysis : in principle, we can expect that
possible distortions of the transmission due to the crisis
translate into a positive and relatively persistent contribu-
tion from this shock. This would indicate that the retail
interest rate is too high relative to the market interest
rate in the context of a normal transmission, and that
it thus incorporated an additional risk premium due to
the crisis.
The time series of bank interest rates were constructed
using retail interest rates (RIR) from the old survey of
credit institutions, available up until September 2003, and
monetary financial institution interest rates (MIR), avail-
able from January 2003, taken from the new harmonised
survey of euro area interest rates. For each of the interest
rates, the two statistical series were combined by system-
atically carrying over the difference in interest rates for the
month of January 2003, while retaining the dynamic of
each of the series. It was verified that the two series were
strongly correlated during the nine months for which data
from both of them overlap
(2)
.
The market interest rates used are, for the short term,
Euribor (as well as BIBOR when analysing Belgian rates,
through December 1998) and OIS. For the long term,
we used three- and seven-year Euribor swap rates, and
three- and seven-year euro area government bond yields
(synthetic) ; we also used the interest rate on seven-year
Belgian government linear bonds (OLOs) to analyse long-
term retail interest rates in Belgium.
43
Central bank rates, market rates and retail bank rates in
the euro area in the Context of the reCent Crisis
(1) The bootstrap method supplies a certain number of indications regarding the
estimates obtained from a sample by using “new samples” drawn from the initial
sample. Here we use Hall intervals constructed on 1,000 drawings.
3.2.2 Results
The goal of this analysis is not to perform an exhaustive
study of the crisis’s effects on monetary policy transmis-
sion in the euro area and Belgium, but to illustrate a cer-
tain number of transmission problems associated with the
crisis. As a result, the study covers a sample of short- and
long-term lending and deposit rates offered by banks in
the euro area and Belgium.
3.2.2.1 Euro area
The analysis of the euro area includes both deposit and
lending rates. Among deposit rates, we analyse the over-
night deposit rate and the savings deposit rate. As for
lending rates, we analyse the rates on short- and long-
term loans to non-financial corporations and on consumer
loans. A cointegration relationship has been identified for
all of the estimated models but one. The results for the
two samples are detailed in the annex.
Initially, the comparison of impulse response functions
makes it possible to visualise the extent to which the
models are stable over the period analysed, and relative to
the two market interest rates considered. The charts illus-
trating the impulse response functions measure the effects
of a shock the size of one standard deviation (that occurs
at period 0) over the course of the following 36 periods
(months), and indicate whether it is permanent or tem-
porary. They include confidence intervals estimated using
Hall’s bootstrap method
(1)
, with a probability of 95 %.
The cases in which the conclusion is the most evident are
those of short-term interest rates, for which the market
rates used began to diverge in the second half of 2007.
In the case of both the rate on short-term loans to NFCs
and overnight deposits, for the models estimated using
Euribor, the shock to the market rate had a fairly stable
and permanent impact on the retail interest rate for the
two samples considered. Conversely, the models esti-
mated using the three-month OIS become problematic
when the crisis period is included in the analysis. In the
case of the interest rate on short-term loans to non-
financial corporations, when the analysis is performed on
a long series, the shock to the OIS rate no longer has a
permanent impact on the retail interest rate, whereas the
impact of Euribor was similar both before and during the
crisis (which testifies to the stability of the relationship).
A similar result was obtained for overnight deposits (not
illustrated). In the case of savings deposits (not illustrated),
the impulse response functions do not clearly indicate a
relevant interest rate.
This indicates that, during the crisis, short-term retail
interest rates moved in step with Euribor rather than
OIS. These interest rates can thus be considered “con-
taminated” by the widening spread between the two
market interest rates ; at the same time, the ECB’s adop-
tion of unconventional measures made it possible, as we
explained above, to counteract this effect by reducing OIS
Chart 12 IMPULSE RESPONSE FUNCTIONS OF THE INTEREST RATE ON SHORT-TERM LOANS TO NON-FINANCIAL CORPORATIONS IN
THE EURO AREA AFTER A SHOCK TO THE MARKET INTEREST RATE
0
2
4
6
8
10
12
14
16
18
20
22
24
26
28
30
32
34
36
0
2
4
6
8
10
12
14
16
18
20
22
24
26
28
30
32
34
36
–0.3
–0.2
– 0.1
0
0.1
0.2
0.3
0.4
0.5
0.6
–0.3
–0.2
– 0.1
0
0.1
0.2
0.3
0.4
0.5
0.6
Impact before the crisis
Impact including the crisis
MODEL USING EURIBOR
–0.3
–0.2
– 0.1
0
0.1
0.2
0.3
0.4
0.5
0.6
–0.3
–0.2
– 0.1
0
0.1
0.2
0.3
0.4
0.5
0.6
MODEL USING OIS
Source : NBB.
44
Chart 13 IMPULSE RESPONSE FUNCTIONS OF THE INTEREST RATE ON LONG-TERM LOANS TO NON-FINANCIAL CORPORATIONS IN
THE EURO AREA AFTER A SHOCK TO THE MARKET INTEREST RATE
0
2
4
6
8
10
12
14
16
18
20
22
24
26
28
30
32
34
36
0
2
4
6
8
10
12
14
16
18
20
22
24
26
28
30
32
34
36
0
0.1
0.2
0.3
0.4
0.5
0
0.1
0.2
0.3
0.4
0.5
Impact before the crisis
Impact including the crisis
MODEL USING SWAP RATE
0
0.1
0.2
0.3
0.4
0.5
0
0.1
0.2
0.3
0.4
0.5
MODEL USING GOVERNMENT BOND YIELD
Source : NBB.
Chart 14 HISTORICAL DECOMPOSITION OF THE INTEREST
RATE ON SHORT-TERM LOANS TO NON-FINANCIAL
CORPORATIONS IN THE EURO AREA
2007
2008
2009
2010
2011
–3
–2
–1
0
1
2
3
4
5
6
7
–3
–2
–1
0
1
2
3
4
5
6
7
Rate on short-term loans to non-financial corporations
Deviation from the constant,
contribution from
:
Constant
Market interest rate shock
Retail interest rate shock
MODEL USING EURIBOR
Source : NBB.
(which fell to a level below the ECB’s central key rate) and,
subsequently, Euribor.
The analysis of longer-term interest rates enables us to
observe whether the sovereign debt crisis has had (or may
have) a material impact on the cost of lending to busi-
nesses and households in the euro area, on the basis of
the spreads recorded between government bond yields
and swap rates. In the case of long-term loans to non-
financial corporations, the relationship with each of the
market interest rates remains very stable after the crisis.
Unlike in the previous exercise, it thus appears too early
to draw firm conclusions regarding the impact of the
sovereign debt crisis on this interest rate. This is almost
certainly due to the small amount of data that reflect a
widening spread between the market interest rates con-
sidered in this analysis (the widening of spreads between
the two market interest rates was relatively brief in 2009
and began relatively late in 2010). In the case of the inter-
est rate on consumer loans (not illustrated), the models
(estimated using the three-year swap rate and the govern-
ment bond yield of the same maturity) again do not allow
us to firmly conclude that the former interest rate grew
less relevant as a result of the crisis.
Consideration of the historical decomposition of the rela-
tionship becomes important especially in cases where the
analysis of patterns of impulse response functions is not
decisive. It allows us to observe the impact of each of the
two shocks.
Regarding the short-term interest rates analysed, this his-
torical decomposition appears to confirm the hypothesis
45
Central bank rates, market rates and retail bank rates in
the euro area in the Context of the reCent Crisis
Chart 15 HISTORICAL DECOMPOSITION OF THE INTEREST
RATE ON SAVINGS DEPOSITS IN THE EURO AREA
2007
2008
2009
2010
2011
–2
–1
0
1
2
3
4
–2
–1
0
1
2
3
4
Rate on savings deposits
Constant
Market interest rate shock
Retail interest rate shock
Deviation from the constant,
contribution from
:
MODEL USING EURIBOR
Source : NBB.
cited earlier, that the reference interest rate is three-month
Euribor. Interest rates on short-term loans to non-financial
corporations, as well as the interest rates on savings
deposits and overnight deposits (not illustrated) in the
euro area, were determined to a large extent by shocks to
the market interest rate. This indicates that the risk premia
that have widened the Euribor-OIS spread since summer
2007 were transmitted to the interest rates on both loans
to NFCs and deposits.
Furthermore, in the two cases illustrated, a moderately
positive contribution from the shock to the retail interest
rate itself appears late in the period. This may reflect an
additional increase in the financing costs of banks not
integrated into Euribor, which, given the growing mistrust
vis-à-vis a number of banks, has become less representa-
tive of the marginal financing costs of those banks.
The historical decomposition of the interest rate on long-
term loans to non-financial corporations appears to indicate
that the reference market interest rate is the swap rate.
However, this result is tenuous. In the case of the model
estimated using the swap rate, the contribution of the
shock to the retail interest rate becomes positive at the end
of the period. This could be interpreted as the upwards
influence of the sovereign debt crisis and the increase in
Chart 16 HISTORICAL DECOMPOSITION OF THE INTEREST RATE ON LONG-TERM LOANS TO NON-FINANCIAL CORPORATIONS IN
THE EURO AREA
2007
2008
2009
2010
2011
–4
–2
0
2
4
6
8
–4
–2
0
2
4
6
8
2007
2008
2009
2010
2011
–4
–2
0
2
4
6
8
–4
–2
0
2
4
6
8
Rate on long-term loans to non-financial corporations
Constant
Market interest rate shock
Retail interest rate shock
MODEL USING SWAP RATE MODEL USING GOVERNMENT BOND YIELD
Deviation from the constant,
contribution from
:
Source : NBB.
46
Chart 17 IMPULSE RESPONSE FUNCTIONS FOR THE INTEREST RATE ON SHORT-TERM LOANS TO NON-FINANCIAL CORPORATIONS
IN BELGIUM FOLLOWING A SHOCK TO THE MARKET INTEREST RATE
0
2
4
6
8
10
12
14
16
18
20
22
24
26
28
30
32
34
36
0
2
4
6
8
10
12
14
16
18
20
22
24
26
28
30
32
34
36
0
0.1
0.2
0.3
0.4
0.5
0.6
0.7
0
0.1
0.2
0.3
0.4
0.5
0.6
0.7
Impact before the crisis
Impact including the crisis
MODEL USING EURIBOR
0
0.1
0.2
0.3
0.4
0.5
0.6
0.7
0.8
0.9
0
0.1
0.2
0.3
0.4
0.5
0.6
0.7
0.8
0.9
MODEL USING OIS
Source : NBB.
bank financing costs, but the impact is relatively weak
(some 50 basis points for the euro area as a whole). In the
case of the model estimated with government bond yields,
which are clearly contaminated by the sovereign debt crisis,
the retail interest rate is subject to a significant negative
shock to itself, apparently to offset the additional upwards
effect of this alternative reference rate. Overall, for the euro
area as a whole, the sovereign debt crisis thus does not yet
appear to be materially reflected in the trend in retail inter-
est rates on long-term loans to non-financial corporations.
The conclusion is roughly the same for the interest rate on
consumer loans (not illustrated). However, this does not
prevent the sovereign debt crisis from affecting the retail
interest rates of certain countries, notably those hit hardest
by the crisis. This is in substance what emerged from the
descriptive analysis presented in the previous section.
3.2.2.2. Belgium
The Belgian retail interest rates analysed include both
lending rates (interest rates on short- and long-term loans
to non-financial corporations, and loans for house pur-
chase) and deposit rates (savings deposits). The cointegra-
tion relationships are less evident than in the case of euro
area interest rates, especially for the short-term sample
(up to July 2007), but barring that, the models produce
results compatible with the initial hypotheses.
Analysis of the estimated models’ impulse response
functions indicates, as with the euro area, a high degree
of stability for the long-term interest rate models (not
illustrated), even though for long-term loans to non-
financial corporations, government bond yields appear to
gain in importance for the sample that includes the crisis
period.
Regarding short-term interest rates, the impulse response
functions do a good job of showing the relevance of
Euribor during the crisis period for savings deposit rates
and the instability of the model estimated using the OIS,
as was the case for the euro area. However, the conclu-
sion is much less clear in the case of short-term loans to
non-financial corporations. For the latter, the model esti-
mated using the OIS even seems to improve if the crisis
period is included in the sample, whereas the correspond-
ing model using Euribor produces the opposite result.
For the deposit rate analysed, the historical decomposi-
tions also indicate that Euribor is the most relevant market
interest rate. The shocks to Euribor explain virtually all of
the movement in savings deposit rates during the crisis.
As a result, it must have incorporated the increase in the
risk premium that widened the Euribor-OIS spread since
the start of the crisis. Conversely, in the case of the model
estimated using the OIS, both the increase and decrease
in the retail interest rate are principally due to the shock
to the retail rate, which indicates that this model is insuf-
ficient for explaining the events during the crisis. The
savings deposit interest rate is particularly important in
Belgium, because it includes the interest rate applied to
savings accounts, the type of deposit most frequently
used by Belgian households.
47
Central bank rates, market rates and retail bank rates in
the euro area in the Context of the reCent Crisis
Chart 18 HISTORICAL DECOMPOSITION OF THE INTEREST RATE ON SAVINGS DEPOSITS IN BELGIUM
2007
2008
2009
2010
2011
2007
2008
2009
2010
2011
–1.0
–0.5
0.0
0.5
1.0
1.5
2.0
2.5
3.0
–1.0
–0.5
0.0
0.5
1.0
1.5
2.0
2.5
3.0
Rate on savings deposits
Constant
Market interest rate shock
Retail interest rate shock
MODEL USING EURIBOR
–1.0
–0.5
0.0
0.5
1.0
1.5
2.0
2.5
3.0
–1.0
–0.5
0.0
0.5
1.0
1.5
2.0
2.5
3.0
MODEL USING OIS
Deviation from the constant,
contribution from
:
Source : NBB.
Chart 19 HISTORICAL DECOMPOSITION OF THE INTEREST RATE ON SHORT-TERM LOANS TO NON-FINANCIAL CORPORATIONS
IN BELGIUM
2007
2008
2009
2010
2011
–4
–2
0
2
4
6
8
–4
–2
0
2
4
6
8
2007
2008
2009
2010
2011
–4
–2
0
2
4
6
8
–4
–2
0
2
4
6
8
Rate on short-term loans to non-financial corporations
Constant
Market interest rate shock
Retail interest rate shock
MODEL USING EURIBOR MODEL USING OIS
Deviation from the constant,
contribution from
:
Source : NBB.
48
Chart 20 HISTORICAL DECOMPOSITION OF THE INTEREST RATE ON LONG-TERM LOANS TO NON-FINANCIAL CORPORATIONS
IN BELGIUM
2007
2008
2009
2010
2011
–4
–2
0
2
4
6
8
–4
–2
0
2
4
6
8
2007
2008
2009
2010
2011
–4
–2
0
2
4
6
8
–4
–2
0
2
4
6
8
Rate on long-term loans to non-financial corporations
Constant
Market interest rate shock
Retail interest rate shock
MODEL USING SWAP RATE MODEL USING OLO
Deviation from the constant,
contribution from
:
Source : NBB.
As for the interest rate on short-term loans to non-
financial corporations, the historical decompositions, like
the impulse responses, appear to indicate that it was
unaffected by the Euribor-OIS spread, which is in contrast
to the results for the euro area. The relevant rate for
determining the retail interest rate appears to be the OIS
rate, which does not incorporate the risk premia associ-
ated with unsecured interbank loans. This result could be
linked to a composition effect, as a consequence of the
high percentage of loans with very short-term maturities
in Belgium, given that the risk premium on rates with very
short maturities is generally quite low. In the model esti-
mated using the OIS, the shock to the market interest rate
explains virtually all of the variation in the interest rate on
short-term loans to non-financial corporations. However,
this model indicates a slight positive contribution from the
shock to the retail interest rate at the end of the period
(of around 37 basis points in February 2011), which prob-
ably reflects the recent increase in the financing costs of
Belgian banks.
The interest rate on long-term loans to non-financial cor-
porations is analysed in relation to that of the seven-year
swap rate and the seven-year OLO. The swap rate had a
considerably negative effect on the interest rate on loans
to non-financial corporations in Belgium, but the latter
was affected by the positive contribution of the shock
to the retail interest rate early in the rate-cutting period
(late 2008 and 2009). This seems to indicate that the
interest rate on long-term business loans initially fell less
quickly than usual, specifically during the period during
which the financial crisis seriously affected the Belgian
banking sector. However, this positive contribution dis-
appeared towards the end of 2010, with the shocks to
the retail interest rate on itself contributing to its decline,
which strengthens the hypothesis that the increase in
government bond yields did not pass through to this
interest rate. In the case of the model estimated with the
OLO, the impact of the retail interest rate on itself is less
significant in 2009, but more important in 2010. At the
end of the period, this impact is moreover clearly nega-
tive, as in the euro area. This seems to indicate that the
recent increases in the OLO yield due to the sovereign
debt crisis have not been incorporated into the trend in
the interest rate on loans to non-financial corporations
in Belgium.
The final lending rate analysed is the interest rate on loans
for house purchase, which in Belgium has a long average
maturity. The impact of the shock to the mortgage rate
49
Central bank rates, market rates and retail bank rates in
the euro area in the Context of the reCent Crisis
Chart 21 HISTORICAL DECOMPOSITION OF THE INTEREST RATE ON LOANS FOR HOUSE PURCHASE IN BELGIUM
2007
2008
2009
2010
2011
–4
–2
0
2
4
6
8
–4
–2
0
2
4
6
8
2007
2008
2009
2010
2011
–4
–2
0
2
4
6
8
–4
–2
0
2
4
6
8
Rate on loans for house purchase
Constant
Market interest rate shock
Retail interest rate shock
MODEL USING SWAP RATE MODEL USING OLO
Deviation from the constant,
contribution from
:
Source : NBB.
itself is relatively weak, but with a positive contribution
at the end of the period in both the swap rate and the
OLO models. It is difficult to draw firm conclusions at
this stage. However, the positive contributions late in the
period point to a certain transmission of the increase in
government bond yields and, thus, of the sovereign debt
crisis.
Like the other interest rates analysed here, the interest
rate on loans for house purchase corresponds to new
business and is not influenced by the periodic revision of
interest rates on mortgage loans issued earlier. The trans-
mission to the interest charges paid on mortgage loans,
however, takes place via rates on new loans and interest
rate revisions, which are based on the interest rate on
government debt (OLO). Thus, it appears that the Belgian
mortgage loan market is relatively vulnerable in the event
of an aggravation of tensions on the public debt market.
For both Belgium and the euro area, the transmission of
monetary policy appears to have been more disrupted in
the case of short-term than of long-term interest rates.
In general, the former were affected by the widening of
the Euribor-OIS spread, and have thus incorporated the
increase in risk and liquidity premia. The only exception is
the rate on short-term loans to non-financial corporations
in Belgium, which has rather followed the OIS. However,
this phenomenon is likely attributable to the preponder-
ance of loans at very short-term maturities in the aggre-
gate of short-term loans to non-financial corporations in
Belgium.
As for long-term interest rates, the pass-through appears,
on the contrary, to have remained largely stable, for
both Belgium and the euro area as a whole. The analysis
shows, however, a certain influence of the sovereign debt
crisis on several lending interest rates towards the end of
the period. Notably, it appears that the rate on loans for
house purchase in Belgium has been slightly affected by
the widening of the spread between Belgian government
bond yields and the swap rate.
Conclusions
The economic and financial crisis that emerged in summer
2007 and the sovereign debt crisis that erupted in late
2009 generated considerable pressure on financing costs
in the euro area and presented major monetary policy
challenges. However, the cuts in key interest rates orches-
trated by the ECB and the adoption of several exceptional
monetary policy measures amply offset the increase in
50
risk premia on both the interbank and bond markets, and
helped maintain efficient monetary policy transmission.
Thus, while tensions on the market for government debt
securities had a certain impact on business and house-
hold borrowing costs, their effects were relatively limited
at the euro area level, even though, due to its direct
involvement in public financing, the financial sector
was materially affected. The same conclusions apply to
Belgium, where only interest rates on loans for house
purchase appear to have been slightly influenced by
the increase in sovereign debt yields. Conversely, in the
countries that bore the brunt of the sovereign debt crisis,
both businesses and households saw their borrowing
costs rise significantly. In general, it appears that at the
national level, private sector borrowing costs moved in
step with government financing costs, although some
decoupling has also been observed, basically at the level
of the non-financial sector.
These results are reassuring in that they demonstrate the
relative effectiveness of the monetary policies adopted
during the crisis and the relatively limited repercussions
of the sovereign debt crisis on the rest of the euro area
economy. Even so, in the countries hit hardest, the private
sector has been deeply affected by the rise in public sector
borrowing costs, and measures to clean up the fiscal posi-
tions of those countries must remain a top priority.
51
Central bank rates, market rates and retail bank rates in
the euro area in the Context of the reCent Crisis
MAIN RESULTS OF THE ECONOMETRIC ANALYSIS
Retail interest rate
Market interest rate
Cointegration
Long-term pass-
through
b
Speed of adjustment
a
br
Speed of adjustment
a
mr
from
1997-01
to
2007-07
from
1997-01
to
2011-02
from
1997-01
to
2007-07
from
1997-01
to
2011-02
from
1997-01
to
2007-07
from
1997-01
to
2011-02
from
1997-01
to
2007-07
from
1997-01
to
2011-02
Euro area
Overnight deposits 3-month Euribor Yes*** Yes*** 0.27 0.29 –0.07 –0.06 Not significant Not significant
3-month OIS Yes*** Yes** 0.24 0.20 –0.13 –0.05 Not significant Significant
Savings deposits 3-month Euribor Yes*** Yes*** 0.38 0.38 –0.09 –0.13 Not significant Not significant
3-month OIS Yes*** Yes*** 0.29 0.31 –0.25 –0.18 Significant Significant
Short-term loans to NFCs . 3-month Euribor Yes*** Yes*** 0.83 0.76 –0.11 –0.12 Not significant Not significant
3-month OIS Yes*** No 0.81 0.57 –0.15 0.00 Not significant Significant
Consumer loans 3-year swap Yes*** Yes*** 0.55 0.59 –0.12 –0.16 Not significant Not significant
3-year government
bond yield Yes*** Yes*** 0.52 0.56 –0.18 –0.17 Not significant Not significant
Long-term loans to NFCs . 7-year swap Yes*** Yes*** 0.95 0.89 –0.18 –0.18 Not significant Not significant
7-year government
bond yield Yes*** Yes*** 0.89 0.98 –0.22 –0.16 Significant Significant
Belgium
Savings deposits 3-month Euribor No Yes* 0.44 0.45 –0.03 –0.03 Not significant Not significant
3-month OIS No Yes** 0.44 0.19 –0.03 –0.04 Not significant Significant
Short-term loans to NFCs . 6-month Euribor No No 1.07 1.06 –0.14 –0.02 Not significant Significant
6-month OIS Yes*** Yes*** 1.01 0.94 –0.03 –0.11 Not significant Not significant
Long-term loans to NFCs . 7-year swap Yes** Yes*** 0.72 0.65 –0.21 –0.17 Not significant Significant
7-year OLO Yes* Yes*** 0.69 0.74 –0.18 –0.17 Significant Not significant
Loans for house purchase . 7-year swap Yes*** Yes*** 1.42 1.23 –0.12 –0.11 Not significant Not significant
7-year OLO Yes*** Yes*** 1.51 1.39 –0.08 –0.09 Not significant Not significant
* Indicates the presence of a cointegration vector at 15 % (*), at 10 % (**), at 5 % (***) (trace test : probability threshold for which the hypothesis that there is no cointegration vector
can be rejected).
Annex