Tài liệu A COMPREHENSIVE QUANTITATIVE MODEL FOR ANALYZING BOND REFUNDING DECISIONS pptx
Bạn đang xem bản rút gọn của tài liệu. Xem và tải ngay bản đầy đủ của tài liệu tại đây (57.31 KB, 9 trang )
Journal of Financial and Strategic Decisions
Volume 11 Number 2 Fall 1998
19
A COMPREHENSIVE QUANTITATIVE MODEL FOR
ANALYZING BOND REFUNDING DECISIONS
Lawrence S. Tai
*
and Zbigniew H. Przasnyski
*
Abstract
When a corporation refunds a bond issue, choices have to be made between fixed-rate and floating-rate bonds
based on expectations of future interest rates. Whether it is financially viable to refund a bond issue depends
on many factors, including the magnitude of the decline in interest rates, the call premium, flotation costs,
overlapping interest and the corporate tax rate, and all of these factors should be considered in the decision
making process. This paper presents a comprehensive quantitative model that will assist the corporation to
decide whether to refund and to select the best refunding option. Unlike prior studies, the model developed in
this paper is capable of handling a variable overlap period, floating-rate bonds, and old and new bonds with
different terms to maturity.
INTRODUCTION
When interest rates fall steadily and continuously, corporations may be able to save money by refunding their
existing bond issues. According to Boyce and Kalotay [2], the accepted wisdom is to refund a bond issue when interest
rates fall 1% below the coupon rate on the existing bond. However, the refunding decision is in reality a complicated
one. Whether it is financially viable to refund a bond issue depends on many factors, including the magnitude of the
decline in interest rates, the call premium, flotation costs, overlapping interest and the corporate tax rate, and all of these
factors should be considered in the decision making process.
There are basically two types of bonds available to corporations: fixed and floating. For fixed-rate bonds, interest
rates are fixed over the life of the bond. For floating-rate bonds, the index used to determine the interest rate includes
LIBOR (London Interbank Offer Rate), T-bill (Treasury bill) and T-bond (Treasury bond). Interest payments on these
bonds are usually made semiannually and they usually mature in 10 to 30 years.
The simplest form of refunding from the point of view of calculating the financial consequences (i.e., costs or
savings) is the replacement of a fixed-rate bond by another fixed-rate bond with a lower interest rate. However, other
options could be a fixed-rate bond replaced by a floating-rate bond, a floating-rate bond replaced by a fixed-rate bond,
and a floating-rate bond replaced by another floating-rate bond with a different index or a different margin.
MOTIVATION FOR THE STUDY
There are many factors to consider in a bond refunding decision. They are (1) the refunding costs, (2) the reduction in
interest payments, (3) the opportunity cost of refunding, and (4) the corporate tax rate. The costs of refunding include the
call premium, the flotation costs on the new issue, and the overlapping interest. Overlapping interest exists if the new
bond is sold prior to redeeming the old bond. Of these costs, the call premium is a tax-deductible expense in the year the
call is made. Flotation costs on the new issue must be amortized over its life for tax purposes, but the unamortized
flotation costs on the old issue create immediate tax savings. The overlapping interest, like any interest expense, is tax
deductible.
Much has been written on the subject of bond refunding. Most of the research concentrates on the optimal call
provision and refunding strategy for bonds (e.g., Barnea, Haugen and Senbet [1], Lewellen and Emery [5], Thatcher [8],
Robbins and Schatzberg [7], and Vu [10]). Some studies are concerned with the modeling of the timing of the bond
*Loyola Marymount University
Journal of Financial and Strategic Decisions
20
refunding decision (e.g., Brennan and Schwartz [3] and Kraus [4]). For example, Thatcher and Thatcher [9] empirically
tested the timing of bond refunding decisions by comparing the timing performance achieved on a sample of 161 public
utility bond refundings with the timing performance achieved by three benchmark models. They found that firms achieve
levels of timing performance significantly better than the random selection and 100-basis-point benchmark models, but
not significantly better than a stopping-time model based on present value analysis.
One aspect of bond refunding analysis that has not been adequately treated to date is the analysis of a bond refunding
proposal with overlapping interest. For example, although Maris [6] included overlapping interest in the evaluation of
bond refunding decisions, there are four problems with his study. Firstly, although he correctly pointed out that the
overlap period can vary from a few days to several months, his calculations were only applicable to a six-month overlap
period. Secondly, the refunding decision was evaluated at the time when the old bond issue was retired, rather than at the
time when the new bond issue was sold. In reality, the refunding decision would be made when the company issues new
bonds with the intention of calling the old bond. Thirdly, flotation costs were completely ignored. The old issue has an
unamortized flotation cost which may be recognized immediately as an expense, but the company will lose the tax
benefits on flotation costs on the old issue over its remaining life. Flotation costs on the new issue will be an initial
outlay, but will be amortized over the life of the new bond to generate tax savings. Finally, as in most of the previous
studies, Maris assumed that both bonds will mature on the same date and he did not consider the option of bonds with
floating interest rates.
Floating-rate bonds reduce the risk to the borrowing firm that interest rates will decline after funds have been
borrowed on a long-term basis. Despite the relative complexity of analyzing floating-rate bonds due to fluctuating
interest rates, an effort must be made to include them in any comprehensive bond refunding analysis.
This paper describes a quantitative model which allows a comprehensive analysis of bond refunding by including
both fixed-rate and floating-rate bonds and addresses the deficiencies of the work in the literature. The model is capable
of handling different interest rate assumptions and can be used as a decision support tool for determining the best
refunding decision.
DESCRIPTION OF THE MODEL
There are numerous interacting variables that affect the decision to refund a bond issue as mentioned above. In the
absence of any theoretical model, every decision to refund a bond issue would have to be evaluated on a case by case
basis to calculate the exact costs or savings produced by the various interacting variables. Consequently, there is a need
for an interactive computer model that could calculate precisely the savings obtained or costs incurred given any
refunding scenario. Specifically, the intention was to develop a general model that would calculate the net present value
(NPV) of the cash flows over any refunding period, given data on an existing bond issue and data regarding the
opportunity to issue new bonds to retire the old issue. The model would allow various alternative refunding options to be
readily compared by examining the associated NPV of cash flows and subsequently making the decision to refund or
not.
In constructing the refunding model, it is assumed that corporations will pay interest on their bonds semiannually and
that they realize the tax benefits of interest deduction semiannually.
Variables That Need To Be Considered In The Decision To Refund:
1. When refunding will take place (i.e., the number of periods that the existing bond issue has been outstanding).
2. The corporate tax rate.
3. The opportunity cost of alternative investments (i.e., the interest rate on the new bond, or the market interest
rate on bonds of similar characteristics if the original bond has a longer term to maturity than the new bond).
4. The behavior of the market interest rate (for floating-rate bonds only). For the purposes of the model, some
assumptions or forecasts have to be made about the future behavior of the market interest rate. Examples are
(a) a worst case scenario (where the market interest rate increases such that the new bond’s ceiling is exceeded
each year), or (b) extrapolation from historical market rates over the last 30 years, or (c) randomly generated
market rates. Other, customized, market interest rate assumptions can readily be made as appropriate.
5. Information about the old bond and the new bond. Specifically, for both bonds: the face value; the term to
maturity; the flotation costs; the interest rate; if the bond is floating-rate: the index (e.g., T-bill, T-bond,
LIBOR), the margin and the ceiling.
A Comprehensive Quantitative Model For Analyzing Bond Refunding Decisions
21
The Model
Specific values for each of the variables identified in 1-5 above are used as input data to the model to determine the
NPV of the cash flows obtained as a result of refunding. This is obtained in two steps.
(1) Payment schedule for old bond and new bond:
For a fixed-rate bond the semiannual payment is created by the standard procedure of calculating the interest
payment, based on the face value of the bond, term to maturity and interest rate. For a floating-rate bond the new interest
rate has to be recomputed every semiannual period based on the index, margin and ceiling, so that the new semiannual
interest payment can be calculated. The new interest rate for a floating-rate bond is computed as follows:
if index + margin > initial index + ceiling,
then new interest rate = initial index + ceiling,
else new interest rate = index + margin.
(2) NPV of Cash Flows:
at t = 0, cash inflow, CI = V
2
– F
2
at t = 0 + N, cash inflow,
( )
( )
( )
(
)
+
2D
TR2DF
T1N12IV + PTC = CO
1
11
011
−
−−− /
,
V
2
(I
2,0
/ 12)N(1 – T) – (V
2
– F
2
)(i / 12)N(1 – T)
at t = 1, S
1
= T
D2
F
T
D2
F
1
1
2
2
− + V
1
(I
1,1
/ 12)(6 – N)(1 – T) – V
2
(I
2,1
/ 12)(6 – N)(1 – T)
for t =2 to d, S
t
= T
D2
F
T
D2
F
1
1
2
2
− + V
1
(I
1,t
/ 2)(1 – T) – V
2
(I
2,t
/ 2)(1 – T) + V
1
δ
1
– V
2
δ
2
NPV of cash flows for a fixed-rate new bond
∑
+
+
−+
−
d
1=k
k
1-k2,
k
N
02
2] / T)-(1I[1
S
12T1I1
CO
CI =
]/)([
,
NPV of cash flows for a floating-rate new bond
∑
∏
=
+
+
−+
−
d
1=m
m
1k
1-k2,
m
N
02
2] / T)-(1I[1
1
S
12T1I1
CO
CI =
]/)([
,
where:
C = call price of old bond
D
1
= term to maturity of old bond
D
2
= term to maturity of new bond
d = number of periods for calculating savings
[= max {(2D
1
- R), 2D
2
} ]
F
1
= flotation costs of old bond
F
2
= flotation costs of new bond
I
1,k
= coupon interest rate on old bond in period k
I
2,k
= coupon interest rate on new bond in period k
i = interest rate on short-term investment
N = number of months of overlap
P = call premium on old bond
R = period number when refunding will take place
S
i
= savings at the end of period i
T = corporate tax rate
V
1
= face value of old bond
V
2
= face value of new bond
δ
1
= 1 when t = 2D
1
- R, = 0 otherwise
δ
2
= 1 when t = d, = 0 otherwise
Journal of Financial and Strategic Decisions
22
Implementation
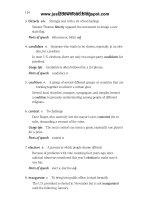
The general refunding model described above was implemented in a spreadsheet. Figure I depicts the organization of
the model. Entering data values for all input variables concerning old bond and new bond yields the NPV of cash flows
resulting from the refunding. The spreadsheet medium not only provides a familiar interface for data input but also
facilitates evaluation of alternatives and “what-if” analyses. Questions such as: “Should the firm refund an existing bond
issue?”; “When is the best time to refund?”; “How far should the interest rate drop before it is worthwhile to refund?”
and “Is it advantageous to refund to a fixed-rate or to a floating-rate bond?” can readily be answered with a few
keystrokes. The model is comprehensive in that all variables impacting the refunding decision are considered.
FIGURE 1
Organization of the Bond Refunding Model
OLD BOND
Refunding
Period
Per
Period
NEW BOND Savings
t
0
New Bond Issued
N months N months
6 months Refunding Occurs
t
1
S
1
6 months
t
2
S
2
Old Bond
Maturity*
6 months
t
d
S
d
New Bond Maturity*
*The term to maturity of the new bond can be different to the remaining term to maturity of the old bold.
Overlapping Interest
A Comprehensive Quantitative Model For Analyzing Bond Refunding Decisions
23
The model will cope with both fixed- and floating-rate bonds of any term to maturity up to 30 years. The corporate
tax rate, term to maturity, period when the refunding will take place, face values, flotation costs, ceiling and (fixed)
interest rates are entered by simply typing values into suitably labeled spreadsheet cells. The index used to determine the
interest rate on the new bond is entered as a series of forecasted values. The type of refunding (fixed to fixed, fixed to
floating, floating to fixed and floating to floating) is selected from a menu under macro control which creates and lays
out the output, as determined by the input data.
USE OF THE MODEL
The following examples will illustrate the use of the model as a decision support system for the refunding decision.
Assume Firm A has a $50 million fixed-rate bond issue outstanding that has a 10% coupon interest rate paid
semiannually and 25 years remaining to maturity. This issue, which was sold five years ago, had flotation costs of $2.5
million. The bond has a call provision which makes it possible for the firm to retire the issue at this time by calling the
bonds at a 2% call premium. The firm can sell new 30-year bonds at a coupon interest rate of 8% (also paid
semiannually) in an amount sufficient to retire the existing bond issue (including the call premium) and to pay for the
flotation costs on the new bond issue. The new bonds will be sold two months before the old issue is expected to be
redeemed and current short-term interest rates are 6%. Flotation costs on the new bond issue will amount to $3 million
and Firm A’s corporate tax rate is 40%. Should the firm refund the $50 million of 10% bonds? Table 1 presents an
abbreviated output from the model showing that over the next 30 years the NPV of cash flows is $4,689,744. Therefore,
it would be advantageous for Firm A to refund the existing bond issue.
TABLE 1
Abbreviated Calculations For Firm A's Fixed-Rate To Fixed-Rate Refunding
PANEL A: OLD BOND
Period (t) Coupon
Interest Rate
Call Price
Less Call
Premium
Overlapping
Interest
Unamortized
Flotation Costs
10
10+N
10.00% $50,600,000 $500,000 $800,000
Period (t) Lost Benefit from
Flotation Costs
Interest Payment MaturityValue
10
11 $20,000 $1,000,000
12 $20,000 $1,500,000
13 $20,000 $1,500,000
14 $20,000 $1,500,000
15 $20,000 $1,500,000
. . .
. . .
. . .
45 $20,000 $1,500,000
46 $20,000 $1,500,000
47 $20,000 $1,500,000
48 $20,000 $1,500,000
49 $20,000 $1,500,000
50 $20,000 $1,500,000 $50,000,000
Journal of Financial and Strategic Decisions
24
TABLE 1
Abbreviated Calculations For Firm A's Fixed-Rate To Fixed-Rate Refunding
PANEL B: NEW BOND
Period (t) Coupon
Interest Rate
Interest on
Short-term
Investment
Overlapping
Interest
Per Period
Savings
0
0+N
8.00% $306,000 $432,000 $50,426,000
Period (t) Benefit from
Flotation
Costs
Interest
Payment
Maturity
Value
Per Period
Savings
NPV of
Cash Flows
0 $4,689,744
1 $20,000 $864,000 $136,000
2 $20,000 $1,296,000 $204,000
3 $20,000 $1,296,000 $204,000
4 $20,000 $1,296,000 $204,000
5 $20,000 $1,296,000 $204,000
. . . .
. . . .
. . . .
35 $20,000 $1,296,000 $204,000
36 $20,000 $1,296,000 $204,000
37 $20,000 $1,296,000 $204,000
38 $20,000 $1,296,000 $204,000
39 $20,000 $1,296,000 $204,000
40 $20,000 $1,296,000 $50,204,000
41 $20,000 $1,296,000 ($1,276,000)
42 $20,000 $1,296,000 ($1,276,000)
43 $20,000 $1,296,000 ($1,276,000)
44 $20,000 $1,296,000 ($1,276,000)
45 $20,000 $1,296,000 ($1,276,000)
. . . .
. . . .
. . . .
57 $20,000 $1,296,000 ($1,276,000)
58 $20,000 $1,296,000 ($1,276,000)
59 $20,000 $1,296,000 ($1,276,000)
60 $20,000 $1,296,000 $54,000,000 ($55,276,000)
The model presented in the paper allows for changes to all of the input variables so that further what-if analyses can
be performed in investigating the refunding decision. For example, Firm A, holding the original bond issue as described
above, may be tempted (also after five years) to refund to a 20-year floating-rate bond. The firm intends to use the 6-
month LIBOR as the index, which is currently at 6.75%. The interest on the bond will be adjusted semiannually with a
1% semiannual margin and a life-time ceiling of 4% above the initial index. Other information about this bond issue is
exactly as described above. In this case the NPV of cash flows over 25 years is determined to be $947,200 (displayed in
Table 2), so it is still worthwhile for Firm A to refund the existing bond issue, but with much less savings.
A Comprehensive Quantitative Model For Analyzing Bond Refunding Decisions
25
Other Applications of the Model:
If a firm’s original bond issue is a floating-rate one, refunding to other fixed-rate or floating-rate bonds can similarly
be investigated by suitably amending the appropriate input variables. Several what-if scenarios can be investigated (or
simulated) to determine breakeven values for a particular firm’s situation. The model can handle old bonds and new
bonds of different terms to maturity.
CONCLUSION
This paper describes a comprehensive quantitative model that will assist in decision making when a firm is
confronted with the choice of fixed- or floating-rate bonds. This is the first attempt to include floating-rate bonds in
refunding analysis and to provide a comprehensive model for determining the best decision.
TABLE 2
Abbreviated Calculations For Firm A's Fixed-Rate To Fixed-Rate Refunding
PANEL A: OLD BOND
Period (t) Coupon
Interest Rate
Call Price
Less Call
Premium
Overlapping
Interest
Unamortized
Flotation Costs
10
10+N
10.00% $50,600,000 $500,000 $800,000
Period (t) Lost Benefit from
Flotation Costs
Interest Payment MaturityValue
10
11 $20,000 $1,000,000
12 $20,000 $1,500,000
13 $20,000 $1,500,000
14 $20,000 $1,500,000
15 $20,000 $1,500,000
. . .
. . .
. . .
40 $20,000 $1,500,000
41 $20,000 $1,500,000
42 $20,000 $1,500,000
43 $20,000 $1,500,000
44 $20,000 $1,500,000
45 $20,000 $1,500,000
46 $20,000 $1,500,000
47 $20,000 $1,500,000
48 $20,000 $1,500,000
49 $20,000 $1,500,000
50 $20,000 $1,500,000 $50,000,000
Journal of Financial and Strategic Decisions
26
TABLE 2
Abbreviated Calculations For Firm A's Fixed-Rate To Fixed-Rate Refunding
PANEL B: NEW BOND
Period (t) Coupon
Interest
Rate
Interest on
Short-term
Investment
Overlapping
Interest
Per Period
Savings
0
0+N
7.75% $306,000 $418,500 $50,412,500
Period (t) Coupon
Interest
Rate
Benefit From
Flotation Costs
Interest Payment Maturity
Value
Per Period
Savings
NPV of
Cash
Flows
0 $50,412,500 $947,200
1 7.8750% $30,000 $850,500 $159,500
2 6.3750% $30,000 $1,032,750 $477,250
3 7.1250% $30,000 $1,154,250 $355,750
4 8.5625% $30,000 $1,387,125 $122,875
5 10.2500% $30,000 $1,660,500 ($150,500)
. . . . .
. . . . .
. . . . .
30 8.5625% $30,000 $1,387,125 $122,875
31 7.5625% $30,000 $1,225,125 $284,875
32 5.1875% $30,000 $840,375 $669,625
33 5.0625% $30,000 $820,125 $689,875
34 4.6250% $30,000 $749,250 $760,750
35 4.5000% $30,000 $729,000 $781,000
36 4.5000% $30,000 $729,000 $781,000
37 6.2500% $30,000 $1,012,500 $497,500
38 8.0000% $30,000 $1,296,000 $214,000
39 7.0000% $30,000 $1,134,000 $376,000
40 6.7188% $30,000 $1,088,438 $54,000,000 ($3,578,438)
REFERENCES
1. Barnea, A., R.A. Haugen and L.W. Senbet, “A Rationale for Debt Maturity Structure and Call Provisions in the Agency Theoretic
Framework,” Journal of Finance 35, 1980, pp. 1223-1234.
2. Boyce, W.M. and A.J. Kalotay, “Optimal Bond Calling and Refunding,” Interfaces 9, 1979, pp. 36-49.
3. Brennan, M.J. and E.S. Schwartz, “Savings Bonds, Retractable Bonds and Callable Bonds,” Journal of Financial Economics 4,
1977, pp. 67-88.
4. Kraus, A., “An Analysis of Call Provisions and the Corporate Refunding Decision,” Midland Corporate Finance Journal 1, 1983,
pp. 46-60.
5. Lewellen, W.G. and D.R. Emery, “On the Matter of Parity Among Financial Obligations,” Journal of Finance 36, 1981, pp. 97-
111.
A Comprehensive Quantitative Model For Analyzing Bond Refunding Decisions
27
6. Maris, B.A., “Analysis of Bond Refunding with Overlapping Interest,” Journal of Business Finance & Accounting 16, 1989, pp.
587-591.
7. Robbins, E.H. and J.D. Schatzberg, “Callable Bonds: A Risk-reducing Signaling Mechanism,” Journal of Finance 41, 1986, pp.
935-949.
8. Thatcher, J.S., “The Choice of Call Provision Terms: Evidence of the Existence of Agency Costs of Debt,” Journal of Finance 40,
1985, pp. 549-561.
9. Thatcher, J.S. and J.G. Thatcher, “An Empirical Test of the Timing of Bond-refunding Decisions,” Journal of Financial Research
15, 1992, pp. 219-230.
10. Vu, J.D., “An Empirical Investigation of Calls of Non-convertible Bonds,” Journal of Financial Economics 15, 1986, pp. 235-
265.