Tài liệu Means-Tested Transfer Programs in the United States docx
Bạn đang xem bản rút gọn của tài liệu. Xem và tải ngay bản đầy đủ của tài liệu tại đây (283.26 KB, 59 trang )
This PDF is a selection from a published volume from the
National Bureau of Economic Research
Volume Title: Means-Tested Transfer Programs in the United
States
Volume Author/Editor: Robert A. Moffitt, editor
Volume Publisher: University of Chicago Press
Volume ISBN: 0-226-53356-5
Volume URL: />Conference Date: May 11-12, 2000
Publication Date: January 2003
Title: The Earned Income Tax Credit
Author: V. Joseph Hotz
URL: />3.1 Introduction
The Earned Income Tax Credit (EITC) grew from $3.9 billion in 1975 (in
1999 dollars), the first year it was part of the tax code, to $31.5 billion in
2000. No other federal antipoverty program has grown at a comparable
rate. In 2000 EITC spending was within $4 billion of the combined federal
spending on Temporary Assistance for Needy Families (TANF) and food
stamps.
1
The growth of the EITC has been even more striking given the antipathy
most Americans express toward welfare, at least prior to welfare reform
in 1996, and the rhetoric of both political parties about recognizing the
limitations of government programs.
2
The EITC’s popularity relative to
means-tested cash transfers like the former Aid to Families with Depen-
141
3
The Earned Income Tax Credit
V. J oseph Hotz and John Karl Scholz
V. J oseph Hotz is professor of economics at the University of California—Los Angeles
and a research associate of the National Bureau of Economic Research. John Karl Scholz
is professor of economics and director of the Institute for Research on Poverty at the Uni-
versity of Wisconsin–Madison and a research associate of the National Bureau of Economic
Research.
The authors thank Robert Moffitt for guidance; Janet Holtzblatt for comments and for
teaching them a lot about the earned income tax credit over the years; Dan Feenberg and the
National Bureau of Economic Research for putting TAXSIM on the Web; and Janet Mc-
Cubbin, Bruce Meyer, Jeffrey Liebman, John Wolf, and conference participants for helpful
suggestions.
1. The fiscal year (FY) 2002 budget showed total food stamp spending in 2000 at $18.3 bil-
lion and total TANF spending at $18.4 billion.
2. Views on welfare are illuminated by questions on the General Social Survey, which asks,
“A re we spending too much money, too little money, or about the right amount on welfare?”
In the 1972–82 surveys, 54.8 percent of the respondents replied “too much.” In the 1996 sur-
vey, 57.7 percent replied “too much,” although the percentage giving this response had fallen
to 45.8 percent in 1998 and to 38.9 percent in 2000.
dent Children (AFDC) and new TANF programs stems, at least in part,
from the perception that the EITC rewards work.
The credit began as part of a broader effort by Senator Russell Long
(Dem La.) to derail congressional and presidential interest in a negative
income tax (NIT) in the late 1960s and early 1970s. The initial debates
highlighted a tension that exists to this day. The attraction of the NIT was
that—as a universal antipoverty program—it would provide a guaranteed
minimal standard of living to all in an administratively efficient way
(through the tax system) without having the notches and high cumulative
marginal tax rates that characterize a patchwork system of narrower pro-
grams. Senator Long’s primary objection to the NIT was that it provided
its largest benefits to those without any earnings, and hence would dull the
labor market attachment of poor families. His alternative, initially called
the “work bonus,” would phase in and thus increase with earnings up to a
point.
Over the years, the EITC has played different tax policy, labor market,
and antipoverty roles. In section 3.2, we review the political history of the
EITC, its rules, and its goals, and we provide a broad set of program sta-
tistics that summarize its growth and coverage. Various goals of the pro-
gram occasionally come into conflict. For example, when the EITC was in-
creased as part of the 1993 budget bill, it was singled out as an important
antipoverty program that has positive (relative to alternatives) labor mar-
ket incentives. Around the same time, however, studies of EITC noncom-
pliance suggested that the credit was difficult for the Internal Revenue
Service (IRS) to administer. One’s view of the credit will be influenced
significantly by the weight one places on its antipoverty effects, its labor
market effects, and the ability of the IRS to administer the credit.
The core of this chapter is a discussion of EITC-related behavioral issues
and research. Section 3.3 provides EITC program statistics. As would be
expected with a program that has more than tripled in size (in real dollars)
in the 1990s, a considerable amount of attention has been paid to the EITC
in recent years. In section 3.4, we outline the conceptual underpinnings of
much of this recent work and discuss EITC participation and compliance,
its effects on labor force participation and hours of work, marriage and fer-
tility, skill formation, and consumption. In this overview, we show that
there are theoretical reasons to prefer the EITC to other antipoverty pro-
grams if the objective is to encourage work among the poor. At the same
time, the predicted effects of the EITC are not all prowork, especially with
respect to hours and its labor market incentives for two-earner couples.
But a policy focus only on labor markets would be overly narrow, since it is
clear that the EITC has the potential to affect a much broader set of eco-
nomic behaviors.
Section 3.5 reviews the evidence to date on these behavioral issues.
Given the design and size of the credit, it is not surprising that it delivers
142 V. Joseph Hotz and John Karl Scholz
significant resources to working poor families. A large set of studies exam-
ine the credit’s labor market effects, as would be expected given that a cen-
tral distinction between the EITC and NIT approach to antipoverty policy
is the likely superiority of the EITC in encouraging labor force participa-
tion. Recent studies have also focused on the degree to which expansions
of the EITC over the last twenty years can account for trends in labor force
participation for single women with children in the United States.
As highlighted in Moffitt (1998), many studies over the last ten years
have examined the effects of programs like AFDC, Medicaid, and food
stamps on family structure and children’s well-being. These studies have
been motivated by a growing concern that public assistance programs con-
tributed to the rise in out-of-wedlock childbearing and female headship,
two behaviors associated with the incidence of poverty, especially among
children. Until very recently, however, little attention has been paid to
the effects of the EITC expansions on these behaviors. We discuss recent
EITC-related studies of this issue. We also discuss recent studies of the
EITC’s effect on consumption patterns of the poor. Because the credit is
administered through the nation’s (and, in some cases, state’s) income tax
systems, EITC payments to low-income households are typically received
once a year, as an adjustment to tax liabilities or refunds. This payment
pattern contrasts with the monthly payments typically associated with
AFDC/TANF and food stamps, and it may provide a way to gain addi-
tional insight into the nature of credit markets and consumption behavior
for low-income families.
Our goal in section 3.5 is to summarize succinctly what has been done,
to evaluate the strengths of this work, and to identify areas where addi-
tional work could be useful to either verify existing conjectures or alter
what we thought was known.
In the final sections, we briefly discuss EITC-related policy debates and
highlight what, if any, critical economic issues underlie these debates. We
also briefly identify issues on which future research is needed.
3.2 Program History, Rules, and Goals
It is not surprising that fundamental tensions in the design of the safety
net emerge at different points in the program’s history, given the EITC’s
status as the largest cash or near-cash antipoverty program.
3
In the mid-
1960s and early 1970s there was a great deal of discussion about the ap-
propriate design of antipoverty policy. At the risk of oversimplifying, one
part of the policy debate focused on either direct earnings subsidies (of
which the EITC is one) or on subsidies paid to employers to hire disad-
The Earned Income Tax Credit 143
3. Our discussion of the EITC’s political history comes directly from Liebman’s (1997a) and
Ventry’s (2000) interesting accounts.
vantaged workers. Remnants of the latter approach are found in the cur-
rent, modest Work Opportunity and Welfare-to-Work tax credits that are
part of the federal income tax.
4
A problem with earnings or employment
subsidies is that they do nothing for adults (and the children that live with
them) who are unable or unwilling to work. Consequently, they must be
matched with programs that help provide food, housing, health care, and
other basic needs to those not in the labor market.
The EITC was established amid the political debate over the NIT that
occurred in the 1960s and 1970s. The NIT held great promise to the early
designers of the war on poverty since it would solve the difficult integration
issues that arise with categorical antipoverty programs—the need for bu-
reaucracies to administer and enforce eligibility and benefit rules and the
need to mitigate potentially high marginal tax rates that recipients face as
earnings increase. Partly for these reasons, in 1966 an NIT was the cap-
stone of the Office of Economic Opportunity’s (the federal agency in
charge of conducting the war on poverty) plan to eradicate poverty. Presi-
dent Johnson, however, opposed the NIT and a leading alternative pro-
posal at the time, a guaranteed annual income, on the grounds that both
proposals undermined work effort. Without the support of the president,
an NIT was not adopted. Nevertheless, in the late 1960s and early 1970s,
the government launched the first widespread social experiments, the Gary
(Indiana), New Jersey, Iowa, and Seattle-Denver Income Maintenance Ex-
periments, to examine the effects of an NIT.
In 1969 President Nixon introduced an NIT called the Family Assis-
tance Plan (FAP) that would have replaced the AFDC program. Although
it enjoyed widespread initial support, the FAP was subsequently attacked
by liberals as being insufficiently generous and by conservatives as being
overly expensive and having insufficiently stringent work requirements.
Russell Long, then chair of the Senate Finance Committee, opposed the
FAP and, as an alternative, designed a proposal targeted at those willing to
work. His 1972 proposal included a large public service jobs component
and a “work bonus” equal to 10 percent of wages subject to Social Secu-
rity taxation. The FAP was defeated in 1972, but Senator Long aggres-
sively pushed his work bonus scheme over the next three years. His efforts
were aided by the confluence of three events. First, from 1960 to 1970 the
payroll tax rate increased to 4.8 percent from 3.0 percent (on both employ-
ers and employees), and it increased further to 5.8 percent in 1973, which
focused attention on the rising tax burdens of low-income families. Sec-
ond, fostered in part by the income maintenance experiments, there con-
tinued to be a great deal of intellectual attention paid to the NIT and NIT
alternatives in think tanks, universities, and government agencies. Third, a
144 V. Joseph Hotz and John Karl Scholz
4. For further discussion of employment subsidies and a broader treatment of employment
strategies for low-wage labor markets, see Bishop and Haveman (1978) and Haveman (1996).
recession started in 1974. This prompted members of Congress in 1975 to
try to stimulate aggregate demand by refunding $8.1 billion in 1974 income
taxes and cutting 1975 income taxes by an additional $10 billion. With the
passage of a tax bill in 1975, Senator Long was able to enact a variant of his
work bonus, called the EITC, on a temporary, eighteen-month basis. The
provision added a 10 percent supplement to wages up to $4,000 ($12,387 in
1999 dollars) for taxpayers with children, and it phased out at a 10 percent
rate over the $4,000 to $8,000 income range.
Senator Long undoubtedly understood that once a provision is in the tax
code, it is likely to remain. Indeed, the EITC remained in the tax code each
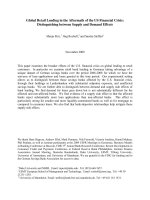
subsequent year until it was made permanent in 1978. Legislation in 1978
also added a flat range to the EITC’s phase-in and phaseout ranges, as
shown in figure 3.1.
5
An “advance payment” option was also added to the
credit in 1978, so that workers would be able, if they desired, to receive the
credit incrementally throughout the year.
Spending on the safety net slowed in the late 1970s and shrank in the
1980s. Between 1978 and the Tax Reform Act of 1986 (TRA86), the fact
that the tax credit (and tax code) was not indexed for inflation caused a
substantial erosion of the EITC’s real value. The TRA86, as part of its
provisions to eliminate income taxes on families with incomes below the
The Earned Income Tax Credit 145
Fig. 3.1 The Earned Income Tax Credit for a family with two or more children in
1979 and 2001
Notes: 1 ϭ subsidy rate; 2 ϭ maximum benefit for two or more children; 3 ϭ benefit reduc-
tion (implicit tax) rate.
5. The phase-in rate for the credit was 10 percent on earnings up to $5,000, for a maximum
credit of $500. The maximum credit was available for taxpayers with earnings between $5,000
and $6,000. The phaseout rate for the credit was 12.5 percent on incomes between $6,000 and
$10,000.
poverty line, increased the EITC to the point where the maximum credit in
1987 equaled the real value of the credit in 1975. The TRA86 also indexed
the credit for inflation. During this period the EITC continued to be sup-
ported by liberals and conservatives, both of whom were sympathetic to
the idea of reducing tax burdens on low-income families and rewarding
work.
Through much of the 1980s and into the 1990s, deficits were a dominant
topic in Washington economic policy discussions. By 1990, annual deficit
forecasts exceeding $300 billion—“as far as the eye can see”—were com-
mon, so that year President Bush agreed to abandon his “no new taxes”
pledge and meet with Democratic leaders of Congress to fashion deficit-
reduction legislation. The tortuous negotiations led to the 1990 tax bill,
which phased out exemptions and itemized deductions on high-income
taxpayers and raised the highest marginal tax rate from 28 percent to 31
percent. Whereas distributional issues have always played a role in tax pol-
icy, they played an exceptionally important role in 1990, perhaps because
of the antipathy of Democratic congressional leaders toward the Republi-
can president and the sense of those leaders that policy in the 1980s disfa-
vored low-income families.
6
The EITC proved to be a straightforward way
to alter the distributional characteristics of various deficit-reduction pack-
ages, and distributional tables became an important factor behind the 1990
EITC expansion that was phased in over three years. In 1991, the credit for
the first time was also made larger for taxpayers with two or more children
than for taxpayers with one child.
Another major change to the EITC occurred as part of the 1993 budget
bill. In his first State of the Union Address, President Clinton said, “The
new direction I propose will make this solemn, simple commitment: By ex-
panding the refundable earned income tax credit, we will make history; we
will reward the work of millions of working poor Americans by realizing
the principle that if you work forty hours a week and you’ve got a child in
the house, you will no longer be in poverty.” This declaration completed the
evolution of the EITC from Senator Long’s modest “work bonus” to a ma-
jor antipoverty initiative. President Clinton set a target for the EITC: full-
time work at the minimum wage plus the EITC (and any food stamps a
family is eligible for) should be enough to raise the family’s net-of-payroll-
tax income above the poverty line. To achieve this goal, the EITC was again
increased, and increased sharply for families with two or more children.
7
146 V. Joseph Hotz and John Karl Scholz
6. Many of the newspaper articles about 1990 budget talks emphasized distributional is-
sues. See, for example, “GOP’s Tax Proposal Said to Favor Wealthy; Budget Talks Proceed-
ing at ‘Glacial’ Pace,” Washington Post, 14 September 1990, A12, and “Budget Negotiations
Recess Amid Confusion on Progress; Officials Disagree on Extent of Disagreement,” Wash-
ington Post, 18 September 1990, A1.
7. The specific goal was achieved only for families with fewer than three children, and only
after the minimum wage was increased in 1996 and 1997.
The 1993 budget bill (and EITC expansion) passed by one vote in the
Senate and received not a single supporting Republican vote. This too
marked a transformation in the EITC’s political history. For the first time,
the EITC became a policy linked exclusively to Democrats. In subsequent
years, there have been highly partisan battles over EITC-related issues.
3.2.1 EITC Rules
To receive the earned income credit, taxpayers file their regular tax re-
turn and fill out the six-line Schedule EIC that gathers information about
qualifying children. The EITC is refundable, meaning that it is paid out by
the Treasury regardless of whether the taxpayer has any federal income tax
liability. There are several basic tests for EITC eligibility. The taxpayer
must have both earned and adjusted gross income below a threshold that
varies by year and by family size. Most EITC payments go to taxpayers
with at least one “qualifying child.” A qualifying child needs to meet age,
relationship, and residence tests. The age test requires the child to be
younger than nineteen, younger than twenty-four if a full-time student, or
any age if totally disabled. The relationship test requires the claimant to be
the parent or the grandparent of the child or for the child to be a foster
child.
8
Under the residence test the qualifying child must live with the tax-
payer at least six months during the year.
9
Another rule limits the sum of
taxable and tax-exempt interest, dividends, net capital gains, rents, royal-
ties, and “passive” income to less than $2,350 (indexed for inflation).
In 2001, taxpayers with two or more children could receive a credit of 40
percent of income up to $10,020, for a maximum credit of $4,008. Taxpay-
ers (with two or more children) with earnings between $10,020 and $13,090
received the maximum credit. Their credit was reduced by 21.06 percent of
earnings between $13,090 and $32,121. The EITC schedule in 2001 for
families with two or more children is shown in figure 3.1. A small credit
available for childless taxpayers between the ages of twenty-four and sixty-
five with very low incomes was added in 1994. The credit rate for these tax-
payers is 7.65 percent, and the maximum credit in 2001 was $364. Table 3.1
shows the complete evolution of income eligibility thresholds, credit rates,
and phaseout (or implicit tax) rates.
Panel A of figure 3.2 shows total tax payments and marginal tax rates for
two-parent, two-child families in Illinois (a state with relatively high tax
The Earned Income Tax Credit 147
8. Until late 1999, a foster child was any child for whom the claimant cared for “as if the
child is their own.” The caring stipulation still holds, but now the child must also be placed in
the home by an authorized placement agency. Prior to the 2001 tax legislation, EITC-eligible
foster children also needed to live with the taxpayer for twelve, rather than six, months.
9. In 1990 (tax year 1991) the residency and AGI tiebreaker (to be discussed) tests replaced
a support test, since in principle it is easier to verify where a child lives than it is to verify
who supports a child. Under the support test the taxpayer had to pay for at least half the
child’s support, where items like transfer payments (e.g., AFDC and housing subsidies) and
child support were not considered support provided by the taxpayer.
Table 3.1 Earned Income Tax Credit Parameters, 1979–2001 (in nominal dollars)
Phase-in Phase-in Max Phaseout Phaseout
Ye ar Rate (%) Range ($) Credit ($) Rate (%) Range ($)
1975–78 10.0 0–4,000 400 10.00 4,000–8,000
1979–84 10.0 0–5,000 500 12.50 6,000–10,000
1985–86 11.0 0–5,000 550 12.22 6,500–11,000
1987 14.0 0–6,080 851 10.00 6,920–15,432
1988 14.0 0–6,240 874 10.00 9,850–18,576
1989 14.0 0–6,500 910 10.00 10,240–19,340
1990 14.0 0–6,810 953 10.00 10,730–20,264
1991
a
16.7
b
0–7,140 1,192 11.93 11,250–21,250
17.3
c
1,235 12.36 11,250–21,250
1992
a
17.6
b
0–7,520 1,324 12.57 11,840–22,370
18.4
c
1,384 13.14 11,840–22,370
1993
a
18.5
b
0–7,750 1,434 13.21 12,200–23,050
19.5
c
1,511 13.93 12,200–23,050
1994 23.6
b
0–7,750 2,038 15.98 11,000–23,755
30.0
c
0–8,245 2,528 17.68 11,000–25,296
7.65
d
0–4,000 306 7.65 5,000–9,000
1995 34.0
b
0–6,160 2,094 15.98 11,290–24,396
36.0
c
0–8,640 3,110 20.22 11,290–26,673
7.65
d
0–4,100 314 7.65 5,130–9,230
1996 34.0
b
0–6,330 2,152 15.98 11,610–25,078
40.0
c
0–8,890 3,556 21.06 11,610–28,495
7.65
d
0–4,220 323 7.65 5,280–9,500
1997 34.0
b
0–6,500 2,210 15.98 11,930–25,750
40.0
c
0–9,140 3,656 21.06 11,930–29,290
7.65
d
0–4,340 332 7.65 5,430–9,770
1998 34.0
b
0–6,680 2,271 15.98 12,260–26,473
40.0
c
0–9,390 3,756 21.06 12,260–30,095
7.65
d
0–4,460 341 7.65 5,570–10,030
1999 34.0
b
0–6,800 2,312 15.98 12,460–26,928
40.0
c
0–9,540 3,816 21.06 12,460–30,580
7.65
d
0–4,530 347 7.65 5,670–10,200
2000 34.0
b
0–6,920 2,353 15.98 12,690–27,413
40.0
c
0–9,720 3,888 21.06 12,690–31,152
7.65
d
0–4,610 353 7.65 5,770–10,380
2001 34.0
b
0–7,140 2,428 15.98 13,090–28,281
40.0
c
0–10,020 4,008 21.06 13,090–32,131
7.65
d
0–4,760 364 7.65 5,950–10,708
Source: U. S. House of Representatives, Committee on Ways and Means (1998, p. 867). 1998 through
2001 parameters come from Internal Revenue Service Publication 596.
a
Basic credit only. Does not include supplemental young child or health insurance credits.
b
Taxpayers with one qualifying child.
c
Taxpayers with more than one qualifying child.
d
Childless taxpayers.
The Earned Income Tax Credit 149
A
B
Fig. 3.2 A, Taxes and marginal rates, family of four, Illinois, 1998; B, Taxes and
marginal rates, family of four, Illinois, 1984 (in $ 1998)
Notes: Calculations only reflect the effects of the state and federal tax system and do not in-
clude the effects of transfer programs. See Feenberg and Coutts (1993) for details of the
NBER’s TAXSIM model used for these calculations.
rates on low-income families) in 1998.
10
We assume workers bear the full
burden of payroll taxes, so the employer and employee share of payroll
taxes is 14.2 percent.
11
The marginal tax rate line is initially at –25.8 per-
cent, reflecting the sum of the 14.2 percent effective payroll tax rate and
10. Nineteen states impose positive (but typically small) state income taxes on families of
four with incomes below the poverty line (Johnson 2001).
11. Employers and employees both contribute 7.65 percent of earnings as payroll taxes, but
the standard incidence assumption for payroll taxes implies that after-tax earnings would be
7.65 percent larger in the absence of payroll taxes, so the effective payroll tax rate is (0.153/
1.0765) or 14.2 percent.
the –40 percent EITC rate. The flat portion of the EITC occurs around
$10,000, where the Illinois household would face a 3 percent marginal
state tax rate. Effective rates are 38.3 percent over much of the phaseout
range, reflecting the sum of the 14.2 percent payroll tax, the 21.1 percent
EITC phaseout, and the 3 percent Illinois state income tax. Rates jump to
53.3 percent between $25,000 and $29,000 as this family enters the 15 per-
cent bracket of the federal income tax.
12
The corresponding average tax
burdens are shown in the bars. Two-parent, two-child Illinois families
would have negative combined income and payroll taxes up to roughly
$17,200.
13
Panel B of figure 3.2 shows the analogous situation for the same type of
family in 1984, before the 1986 tax reform, and the 1990 and 1993 EITC ex-
pansions, all of which reduced taxes on low-income families. The pattern
of marginal and average tax rates is strikingly different from what applied
in 1998. The payroll tax (7 percent on employers and employees) was al-
most as high as it is now, resulting in an effective rate of 13.1 percent. The
EITC was only 10 percent on incomes up to $7,844 (in 1998 dollars), so
even taxpayers with very low incomes faced positive marginal rates. The
EITC was phased out at a 12.5 percent rate beginning at $9,413 (again, in
1998 dollars). In addition, the 11 percent federal marginal tax bracket
started at around $9,413 of income. Thus, all but the lowest-income fami-
lies faced marginal tax rates of at least 28 percent, and some faced signifi-
cantly higher marginal rates.
In calendar year 2001, fourteen states and the District of Columbia had
EITCs as part of their state income tax systems.
14
The parameters of these
credits are summarized in table 3.2. Most are structured as percentages of
the federal credit and use the same eligibility definitions. In New York, for
example, the state EITC was 25 percent of the federal credit in 2001, rising
to 30 percent by 2003. Ten of the state EITCs (including D.C.) are refund-
able, and most make the credit available to workers without qualifying chil-
dren.
Two unusual features show up in state EITCs. Wisconsin’s state EITC
has a three-tiered schedule equaling 4 percent of the federal credit for tax-
payers with one child, 14 percent of the federal credit for taxpayers with
150 V. Joseph Hotz and John Karl Scholz
12. The EITC phaseout rate is lower for taxpayers with one child, but because they only re-
ceive one child credit and have one less personal exemption, one-child families in 2002 begin
to pay the federal 10 percent marginal income tax rate at an income of $22,850. Hence, EITC
recipients with one child and incomes between $22,850 and $29,201 have cumulative marginal
tax rates around 40 percent (including payroll taxes).
13. Low-income families would generally file returns because their incomes exceed filing
thresholds or to get back withheld taxes. With the $600 child credit along with exemptions of
$3,000 and the standard deduction of $7,850, a married couple with two children in 2002 will
not have a positive income tax liability until their earnings exceed $31,850, even without the
EITC.
14. This discussion is from Johnson (2001).
two children, and 43 percent of the federal credit for taxpayers with three
or more children. This schedule was developed with explicit reference to
the higher incomes needed to keep families with three or more children out
of poverty. The Minnesota schedule includes a second phase-in range to
combat the problem that increases in wages or hours for certain minimum-
wage workers made them no better off because of the loss of cash assis-
tance and food stamps and increases in taxes (see Johnson 2001, page 21,
for more details).
The state credits in combination with the federal credit can be substan-
tial. A family with three or more children earning $9,600 in Wisconsin, for
example, could receive a combined state and federal EITC of $5,457, or a
57 percent supplement to their earned income.
3.2.2 Interaction with Other Social Welfare Programs
The tax system operates independently of transfer programs, so there is
relatively little interaction between the EITC and other programs. In 1979
(as part of a technical corrections bill) Congress required both advance and
The Earned Income Tax Credit 151
Table 3.2 State Earned Income Tax Credits, Tax Year 2001
Percentage of Federal Credit
Refundable credits
Colorado (1999) 10
District of Columbia (2000) 25
Kansas (1998) 10
Maryland (1987)
a
16 (rising to 20 in 2003)
Massachusetts (1997) 15
Minnesota (1991) Averages 33%, varies by earnings
b
New Jersey (2000) 15 (20% by 2003), limited to families with
incomes below $20,000
New York (1994) 25 (30% by 2003)
Vermont (1988) 32
Wisconsin (1989) 4% one child; 14% 2 children; 43% 3 children
Nonrefundable credits
Illinois (2000) 5
Iowa (1990) 6.5
Maine (2000) 5
Oregon (1997) 5
Rhode Island (1975) 25.5
Source: Johnson (2001, particularly Table 4). Adoption years are from Dickert-Conlin and
Houser (2002), which in turn are from Johnson.
Note: State names are followed by year adopted (in parentheses).
a
A Maryland taxpayer may claim a refundable credit or a nonrefundable credit (equal to 50
percent of the federal credit), but not both.
b
Minnesota’s credit for families with children, unlike the other credits shown in the table, is
not expressly structured as a percentage of the federal credit. Depending on income levels, the
credit may range from 22 percent to 46 percent of the federal credit.
lump-sum EITC payments to be treated as earned income for AFDC, food
stamp, and Supplemental Security Income (SSI) recipients. The 1981 tax
legislation went even further in requiring welfare agencies to assume that
individuals eligible for both the EITC and AFDC received the EITC incre-
mentally through the year, thus likely lowering AFDC and food stamp ben-
efits. In 1984 this position was reversed and states were allowed to reduce
AFDC benefits only when they could verify that individuals actually re-
ceived the EITC. The 1990 tax legislation prohibited the counting of the
EITC as income or as a resource in the month received or in the following
month when determining eligibility for AFDC, Medicaid, food stamps,
SSI, and low-income housing benefits. Finally, the 1993 Mickey Leland
Hunger Act prohibited counting the EITC for the first twelve months after
receipt for food stamp eligibility and benefits. Beyond these time intervals,
the EITC could cause potential recipients to fail program asset tests.
Since the abolition of AFDC, it has not yet become clear how the EITC
will interact with state TANF programs. There are two major issues. First,
states now have the authority to count the EITC as income when deter-
mining eligibility for their welfare programs. Second, many TANF pro-
grams contain employer subsidies and other job-related activities, which
may or may not trigger tax obligations and potential EITC payments. The
1997 budget bill made clear that the EITC could not be claimed on income
resulting from “community service” and “work experience” jobs funded
under TANF. Other situations will be judged by their “facts and circum-
stances” under the general welfare doctrine.
15
The law is not yet well devel-
oped in this area.
3.2.3 Quality Control and Noncompliance
Relative to alternative delivery mechanisms, the EITC is inexpensive to
administer. Most EITC recipients would be required to file a tax return
even in the absence of the credit, so the marginal cost of obtaining the
EITC is simply the small cost of filling out Schedule EIC. The cost to the
IRS is also quite small. The IRS has a budget of roughly $8 billion to serve
some 120 million individual taxpayers and 15 million corporations. The in-
cremental cost of administering the EITC is surely a very small fraction of
this total. The costs of administering two other major income-support pro-
grams for low-income families are much higher. Administrative costs in fis-
cal year (FY) 1995 were $3.7 billion for food stamps and $3.5 billion for
AFDC, although a significant portion of those costs also paid for client
services.
A system based largely on self-assessment (like the U.S. income tax) will
152 V. Joseph Hotz and John Karl Scholz
15. A loose description of the general welfare doctrine is that if payments are made for the
general welfare, meaning that payments are public support for a disadvantaged family, they
are not taxable and do not trigger the EITC. If payments are more job-related, they are less
likely to be viewed as payments made to support the general welfare and more like compen-
sation for services rendered. In this case they would be taxable and trigger the EITC.
have lower administrative costs than a more bureaucratic approach, but it
will also have higher noncompliance. The most recent study of EITC non-
compliance examined returns filed in 2000 (for tax year 1999) and found
that of the $31.3 billion claimed in EITC, between $8.5 and $9.9 billion, or
27.0 to 31.7 percent of the total, exceeded the amount to which taxpayers
were eligible (IRS 2002a).
Of the errors the IRS was able to classify, roughly half involve qualify-
ing-child errors.
16
About half of these arose because the child claimed was
not the taxpayer’s qualifying child. Of these errors, the most common prob-
lem was that EITC-qualifying children failed to live for at least six months
(see footnote 8 for the rules applying to foster children) with the taxpayer
who was claiming the child. Reasons for mistakes of this type can run the
gamut from innocent taxpayers running afoul of complex IRS rules to
fraud. Consider, for example, a divorced couple whose divorce agreement
gives the dependency exemption to the noncustodial parent, who in turn is
regularly paying child support. Since the noncustodial parent receives the
dependency exemption, that parent could easily assume that he or she
could also claim the child to receive the EITC if he or she is otherwise qual-
ified. But in this case the claim would be inappropriate, since the child does
not live with the claimant for more than six months. In the category of clear
noncompliance, consider the situation described in the ethnographic study
of Romich and Weisner (2000). They write that “one woman relies on her
mother to baby-sit her younger daughter every weekend. The grandmother
also buys school clothes for the child. In return for this care, the grand-
mother ‘gets hers back at the end of the year’ by (illegally) filing the child
as her dependent and receiving an EITC” (p. 1256).
Two other sources of qualifying-child errors arise with the adjusted gross
income (AGI) tiebreaker and relationship rules. The AGI tiebreaker rule
stipulated that if two people could legitimately claim the same EITC-
qualifying child (such as a mother and grandmother in the same house),
the one with the greater income was supposed to. Something like a
tiebreaker rule is necessary to establish legitimacy in cases where more
than one taxpayer claims the credit based on the same child. But it led to
outcomes where, for example, a parent who lived and cared for a child
could not claim the child because the child’s grandparent also lived in the
house and had a higher income. The AGI tiebreaker rule was simplified be-
ginning in 2002 and now applies only if two taxpayers actually claim the
same EITC-qualifying child. This change should significantly reduce er-
rors related to the AGI tiebreaker rules, which accounted for 17.2 percent
of all errors in 1999. The relationship test is violated when the person
claiming the EITC-qualifying child is not the child’s parent (including the
parent of an adopted child, stepchild, or foster child) or grandparent.
The Earned Income Tax Credit 153
16. Also see McCubbin (2000), Scholz (1997), U.S. General Accounting Office (1998), and
Holtzblatt (1991) for discussions of earlier EITC compliance studies.
The IRS found that 21.4 percent of overclaims resulted from income-
reporting errors. These problems may arise from both underreporting and
overreporting income (including underreporting of investment income,
which could make a taxpayer ineligible for the EITC). This category also
includes situations where a married couple living together chooses to file
two separate tax returns (perhaps two head-of-household returns, or one
head-of-household and one single return), strategically splitting their in-
comes and children to maximize the EITC.
Another source of EITC errors arose in situations where the taxpayer
filed as single or head of household but should have used the married-
filing-separate status. Like other sources of error, these can range from the
innocent to blatant. For example, the custodial parent in a married couple
that separates but does not get a divorce should, in some cases, file a joint
or married-filing-separate return rather than file as a head of household,
where they may be more likely to be eligible for the credit.
17
Only the savvi-
est taxpayers would likely understand these rules.
Several EITC changes since the 1999 compliance study may have bene-
ficial effects on EITC compliance. One that has already been mentioned is
the change to the AGI tiebreaker test.
18
Another initiative was put in place
as part of the 1997 budget agreement, in which Congress directed the sec-
retaries of the Treasury and Health and Human Services to jointly use the
Federal Case Registry (FCR) of Child Support Orders to improve the ac-
curacy of EITC claims. The FCR typically identifies a child, the custodial
parent, and a noncustodial parent. Since a large fraction of EITC errors
arise in cases where someone other than the person living with the child is
claiming the child for EITC purposes, the FCR has the potential to allow
the IRS to identify a substantial number of noncompliant cases, where pre-
viously they had no useful information to scrutinize residence claims about
EITC-qualifying children. It is too early to know whether the FCR’s ap-
parent potential can be realized, although the system will be used by the
IRS to target prerefund audits in 2002 and Congress has given the IRS au-
thority to treat an EITC claim by a noncustodial parent as a “math error”
during return processing beginning in 2004.
19
The rate of EITC noncompliance appears higher than the overall U.S.
tax gap, where it is estimated that 17 percent of total taxes are not paid (In-
ternal Revenue Service 1996).
20
Although compliance appears to be very
154 V. Joseph Hotz and John Karl Scholz
17. See Holtzblatt and Rebelein (1999, p. 8) for a discussion of the “abandoned spouses”
rules.
18. Income and foster child definitions have also been simplified.
19. Whereas the FCR would appear to be a promising compliance tool, the data in the reg-
istry could be low quality; living arrangements could be fluid, making the FCR data insuffi-
ciently up-to-date; or it could be infeasible or inefficient (from a cost-benefit standpoint) to
use FCR data during processing to stop questionable refund claims before money is paid out.
Once inappropriate EITC claims are paid out, it is very difficult to get the money back.
20. There is some question about the reliability of the tax gap estimates since the underlying
data are from 1988.
high for wage and salary income, presumably because of third-party infor-
mation reporting, compliance rates on self-employment income, sales of
business property, certain types of capital income, and income earned in
the informal sector are comparable to and in some cases far worse than
EITC compliance rates.
3.3 Program Statistics
Table 3.3 provides information on the maximum real EITC benefit (in
1999 dollars) over time, real expenditures, and caseloads since the credit was
established in 1975. For the first sixteen years of the credit, the real value of
the maximum EITC never exceeded its 1975 value by more than $10. Real
spending on the credit increased sharply starting with the 1986 EITC ex-
The Earned Income Tax Credit 155
Table 3.3 Maximum Real EITC Credit, Real Spending, and Number of
Participants (in 1999 dollars)
Real Maximum Real EITC Spending Number of Claimants
Ye ar EITC ($) ($ millions) (thousands)
1975 1,239 3,871 6,215
1976 1,171 3,792 6,473
1977 1,100 3,098 5,627
1978 1,022 2,678 5,192
1979 1,147 4,709 7,135
1980 1,011 4,015 6,954
1981 916 3,504 6,717
1982 863 3,064 6,395
1983 836 3,002 7,368
1984 802 2,626 6,376
1985 852 3,233 7,432
1986 836 3,054 7,156
1987 1,248 4,973 8,738
1988 1,231 8,303 11,148
1989 1,223 8,861 11,696
1990 1,215 9,614 12,542
1991 1,511 13,584 13,665
1992 1,643 15,470 14,097
1993 1,742 17,913 15,117
1994 2,842 23,725 19,017
1995 3,400 28,374 19,334
1996 3,776 30,607 19,464
1997 3,795 31,800 19,490
1998 3,839 31,959 19,516
1999 3,816 32,270 19,419
2000 3,762 31,471 19,363
Source: U.S. House of Representatives (1998) and general IRS statistics of income data on in-
dividuals available at [ />Note: The data reflect claims (allowed through math error processing) and do not reflect sub-
sequent IRS enforcement actions after math error processing.
pansion. Prior to 1986, the EITC cost between $2.6 and $4.7 billion. The
1986 expansion roughly doubled total spending on the credit by increasing
the maximum credit (to make up for the loss in the value of the credit due to
inflation), indexing the credit, and extending its phaseout range. The credit
rate, maximum credit, and spending increased every year from 1990
through 1996 as a consequence of the three-year phase-ins of the 1990 and
1993 EITC increases. Real EITC spending more than tripled in the 1990s.
The evolution of the number of EITC claimants shown in table 3.3
closely mirrors the changes in EITC statutes and, to a lesser extent, busi-
ness cycle changes. Between 5.2 and 7.4 million taxpayers claimed the
credit between 1975 and 1986. By extending EITC eligibility to taxpayers
with incomes up to an indexed level of $18,576 in 1988, the 1986 EITC
changes increased the number of EITC recipients by roughly 50 percent.
The phased-in 1990 expansions also modestly increased the income thresh-
olds that determine EITC eligibility, so the number of recipients increased
by roughly 1 million per year from 1990 to 1993. The number of claimants
increased by roughly 4 million as a consequence of the childless-worker
credit that became available for the first time in 1994. Possibly due in part
to increased compliance efforts, the number of EITC claimants has been
constant since 1995, despite the increasing labor force participation rate of
single-parent families.
It appears that the EITC reaches a large percentage of its intended ben-
eficiaries. Scholz (1994) used matched data from tax returns and the Sur-
vey of Income and Program Participation (SIPP) to calculate that 80 to 86
percent of taxpayers eligible for the EITC appeared to receive it in 1990.
21
Developments since 1990 have an ambiguous effect on EITC participation
rates. The maximum credit has increased sharply since then, from $1,215
to around $3,800 in 1999 dollars, and the credit extends further up in the
income distribution, where filing propensities are high. The IRS, state
agencies, and nonprofit organizations have also expanded outreach efforts.
However, there has been a steady increase in labor force participation of
single women with children (Meyer and Rosenbaum 2000, 2001), and new
workers in this group presumably have lower filing propensities than typi-
cal workers in the population. Hill et al. (1999), for example, suggest that
EITC participation rates for single mothers who recently had been on
AFDC in California were in the range of 42 to 54 percent in 1993 and 1994.
In addition, the IRS no longer will intervene (as it did until the early 1990s)
and award the credit when taxpayers file and appear eligible but do not take
the credit. Instead, the IRS sends a letter to taxpayers encouraging them to
consider filing an amended return. EITC compliance efforts may also have
discouraged some eligible taxpayers from claiming the credit.
The IRS (2002b) used data from the Current Population Survey (CPS)
156 V. Joseph Hotz and John Karl Scholz
21. Blumenthal, Erard, and Ho (1999) present similar participation rates for 1988, making
use of detailed audit data from the 1988 Taxpayer Compliance Measurement Program.
matched to tax returns and data from the SIPP for calendar year 1996 to
estimate that, of the households that appeared to be eligible for the EITC,
between 82.2 and 87.2 percent filed tax returns and hence either claimed
the EITC or likely received a notice from the IRS telling them they may
have been eligible. These calculations suggest that the EITC changes be-
tween 1990 and 1996 had relatively little net effect on EITC participation.
Liebman (2000) uses matched data from the 1990 CPS and tax returns to
examine the characteristics of EITC-eligible taxpayers. He writes (p. 1178):
50 percent of eligible 1990 EITC taxpayers are married, while 30 percent
are formerly married, and 20 percent have never been married. A little
more than half are white, a quarter are Black, and 18 percent are His-
panic. Of eligible EITC recipients, 74 percent have a high school educa-
tion or less; 44 percent live in the South; and 36 percent live in a central
city. Fifty-eight percent work 1500 hours or more, though this average is
brought down by married couples in which one spouse does not work.
Sixteen percent of eligible EITC tax returns are filed by individuals in
households that receive welfare income during the year and 26 percent
are in households receiving food stamps.
It is difficult to predict how the characteristics of EITC participants have
evolved between 1990 and now. The income threshold at which the EITC is
fully phased out has increased from $20,000 to over $30,000 (nominal) dol-
lars since 1990. Many taxpayers have incomes in that range, so it is likely
that EITC recipients appear somewhat more affluent than what Liebman
found. At the same time, labor force participation rates of single women
with children have increased over this period, and many of these new work-
ers have low levels of human capital.
3.3.1 Antipoverty Effects, Target Efficiency, Distributional Impact
The EITC was available in 2001 only to taxpayers with earned income
and adjusted gross income less than $32,121 if they had more than one
qualifying child, $28,281 if they had one qualifying child, and $10,708 if
they had no qualifying children. Scholz and Levine (2001) calculate that in
April 1997 over 60 percent of EITC payments went to taxpayers with pre-
EITC incomes below the poverty line and roughly half of total payments
directly reduced the poverty gap.
22
Liebman (1997a) plots density func-
tions for EITC payments following the 1993 expansion that show a right-
skewed distribution, centered at roughly $13,000, with most payments go-
ing to families with incomes between $7,000 and $26,000.
23
Figure 3.3 presents data from 1999 tax returns on the distribution of
The Earned Income Tax Credit 157
22. The U.S. Department of Health and Human Services poverty guidelines for 2002 are
$8,860 for a one-person family, $11,940 for two-person families, $15,020 for three-person
families, and $18,100 for four-person families.
23. Burkhauser, Couch, and Glenn (1996) compare the distributional effects of the EITC
and minimum wage. They show the EITC is much more “target efficient” than minimum wage
increases, if the objective of policy is to increase incomes of low-income workers.
EITC returns and payments by adjusted gross income class for EITC
claimants with children. Roughly 23 percent of claimants are in the phase-
in range of the credit, and they receive 24 percent of total payments.
Roughly 19 percent are in the flat range, and they receive 26 percent of to-
tal payments. The remaining 58 percent of claimants are in the phaseout
range of the credit; they receive roughly half of total payments. Of the 19.3
million total EITC claims in 1999, 3.2 million had no qualifying children
and claimed $0.6 billion, 7.8 million had one qualifying child and claimed
$12.0 billion, and 8.2 million had two or more and claimed $19.3 billion.
Data are not available for the distribution of EITC claims by filing status.
Because the EITC is based on annual family income and not wages, it is
possible that people with high hourly wages who, for some reason or an-
other, choose to work relatively few annual hours could receive the credit.
In fact, the evidence suggests that in low-wage labor markets, incomes and
wages are tightly linked. Scholz (1996) describes tabulations from SIPP
showing that roughly two-thirds of EITC payments go to taxpayers with
wages in the bottom 25th percentile of all workers with children (below
$6.43 per hour) and more than 95 percent of all EITC benefits are paid to
workers with wages below the median of $9.42 per hour. Liebman (1997a)
reports that in 1990, 75 percent of EITC recipients worked at least 1,000
hours and 60 percent worked more than 1,500 hours per year. Incomes and
158 V. Joseph Hotz and John Karl Scholz
Fig. 3.3 Distribution of total EITC returns and EITC payments of families with
children, by AGI, 1999
Source: “Individual Income Tax Returns, 1999,” available at [ />display/0,,i1%3D40%26genericId%3D16882,00.html] (99INDTR.EXE, posted 28 January
2002), and authors’ calculations.
wages are now even more tightly linked for EITC recipients since EITC-
eligible taxpayers cannot have more than $2,350 of capital (and net capital
gains) income.
Liebman (1997a) also presents calculations that provide an interesting
perspective on the importance of the EITC in low-wage labor markets. Be-
tween 1976 and 1996, the share of income received by the lowest fifth of the
population fell from 4.4 percent to 3.7 percent. The share received by the
top 5 percent increased from 16.0 percent to 21.4 percent over that period.
Liebman’s calculations show that for households with children, the EITC
offsets 29 percent of the decline in incomes in the 1st quintile of the popu-
lation and 9 percent of the decline in the 2nd quintile.
A more direct measure of the EITC’s importance is that in 1997 and 1998
it removed 4.3 million persons from poverty (Council of Economic Advis-
ers 1998, 2000). Recalling President Clinton’s antipoverty goal for the
EITC, a full-time (2,000 hours) minimum-wage worker heading a single-
parent, two-child family would earn $10,300 in wages and be eligible for a
$3,656 EITC in 1997. The poverty line for this family was $12,802.
24
The
combination of full-time minimum wage work and the EITC for a family
of three in 1986 was $7,226, while the poverty line was $8,737. A full-time
minimum-wage worker receiving the EITC and heading a family of three
in 1975, the first year of the EITC, would have had an income of $107 above
the poverty line of $4,293.
3.4 Review of Behavioral Issues
In this section we consider several conceptual issues related to the be-
havioral effects of the EITC.
3.4.1 Program Participation: Claiming the EITC
Perhaps the most basic behavioral issue associated with the EITC is
whether eligible taxpayers actually file tax returns to receive it. At first
glance the analytic underpinnings of this decision appear straightforward:
The benefit of filing for the credit is the dollar value of the EITC. The costs
include the transactions costs associated with filing a return (for those who
would not otherwise file) and gathering the necessary information to claim
the EITC (or resources to pay a professional tax preparer). These cost-
benefit considerations lead to straightforward implications. Claiming the
credit becomes more likely in cases where the potential credit is larger and
where the filer’s familiarity with the program and the U.S. tax system is
greater.
The Earned Income Tax Credit 159
24. A married family with two children would have had an EITC and earnings of $13,956,
and the poverty line was $16,400. We look at 1997 since this is the most recent minimum wage
increase. Given the absence of minimum-wage indexing, full-time minimum-wage work sup-
plemented by the EITC after 1997 will be a smaller percentage of the poverty line than in 1997.
From the work of Holtzblatt (1991), McCubbin (2000), and others, how-
ever, we know that a significant fraction of taxpayers receive the EITC
when they are not technically eligible. Thus, a focus on participation
among eligibles may, in some circumstances, be too narrow. For policy-
makers and scholars interested in overall EITC participation, participa-
tion and compliance issues are intertwined. Even when thinking about par-
ticipation of eligibles, participation and compliance are linked, since
legitimate current-year claims, for example, may lead to scrutiny of past
tax returns or the possibility that funds may be garnished to cover de-
faulted student loans, past taxes, or child support.
Compliance issues can usefully be thought of in the classic tax evasion
framework of Allingham and Sandmo (1972). Taxpayers will adopt an op-
timal reporting strategy, weighing the trade-off between the return to mis-
reporting a dollar of income and the corresponding increased risks of de-
tection and penalty. Interestingly for the case of the EITC, some taxpayers
may gain by overreporting income, a situation the IRS has little experience
with.
25
Also, unlike the classic tax evasion model that focuses on income re-
porting, a central issue with EITC noncompliance has to do with the resi-
dence of the qualifying child. The IRS (until recently, perhaps) has had
little information with which to examine these claims.
3.4.2 The Decision to Work and Hours of Work
As noted in both the introduction and the political history of the EITC,
one of the arguments frequently given for the EITC is that it provides
stronger work incentives than the NIT or entitlement programs like
AFDC, food stamps, and Medicaid. This assessment, although true in a
comparative sense, obscures a complicated set of work and labor supply in-
centives created by the EITC for different household structures and indi-
viduals at different parts of the income distribution. As a result of these
complicated incentives, the overall effect of the EITC on hours of work is
ambiguous.
The simplest framework in which to consider the work incentive effects
of the EITC is the static labor-leisure model displayed in figure 3.4. In
this stylized setting, the EITC creates, for eligible households, an expanded
budget constraint, shifting out the constraint from ade to abcde. The
phase-in region is represented by the segment ab, the flat region by bc, and
the phaseout region by cd. Consider the implications for individuals who
do not work, whose well-being is indexed by utility level, U
I
0
, in the absence
of the EITC. As illustrated in figure 3.4, the introduction of the EITC in-
duces such individuals to enter the labor force and work, and their utility
increases to U
I
1
from U
I
0
. The EITC creates an incentive for these non-
workers to enter the labor force since it increases the marginal value of
160 V. Joseph Hotz and John Karl Scholz
25. Steuerle (1991) has referred to this phenomenon as the “superterranean economy.”
working by raising the effective wage. More formally, the rise in the effec-
tive wage rate due to the EITC for individuals initially out of the labor force
results in only a positive substitution effect and no income effect.
Figure 3.4 also displays preferences for two additional types of individ-
uals, indexed by II and III, who, in the absence of the EITC (or other so-
cial programs), would participate in the labor force. As can be seen, the in-
troduction of an EITC program does not alter their decision to work.
Thus, the incentive effects of the EITC with respect to labor force partici-
pation are unambiguously positive: The EITC will encourage some work-
ers to enter the labor force and should not induce individuals, low-skilled
or otherwise, to leave it. This result stands in contrast to the labor force
participation predictions that arise with programs related to the NIT (like
AFDC), where a guaranteed benefit at zero hours of work creates incen-
tives for some people to leave the labor force.
At the same time, the predicted effect of an EITC from the simple static
labor-leisure model on the extent of work (i.e., number of hours of work) is
ambiguous. As figure 3.4 illustrates, this is because of the differential
effects that the credit has in its flat and phaseout regions. The EITC struc-
ture implies different marginal returns to work (i.e., effective marginal
wage rates) for different parts of the preprogram income distribution. For
type II individuals, who would participate in the labor force in the absence
of the EITC, the introduction of the EITC does not change the value of
their time in the labor market and only alters the income they can receive
The Earned Income Tax Credit 161
Fig. 3.4 Effects of the EITC on labor force participation and hours of work
through the tax credit. Thus, there is only an income effect associated with
the introduction of the EITC for type II individuals. Whether this income
effect is negative (leisure is a normal good) or positive is not clear a priori.
The empirical evidence on income effects associated with labor supply de-
cisions suggests that leisure is a normal good, so, as illustrated in figure 3.4,
the EITC may result in a reduction of hours of work for this type of indi-
vidual.
The phaseout region of the EITC is relevant for the type III individuals
in figure 3.4. These individuals, as drawn, have an incentive to reduce their
hours of work enough so that they actually receive a credit. This final case
illustrates the potentially negative effect on hours that is generated in the
phaseout region of the EITC. There the EITC implies a lower effective wage
rate relative to the absence of the EITC, which, by itself, results in a nega-
tive substitution effect. In addition, there is an income effect that, if nega-
tive, will lead to a further reduction in hours of work.
The above considerations suggest that the consequences of the EITC ex-
pansions for affecting the work behavior of low-income workers are more
complicated than the commonly held view that the EITC is prowork. In
particular, the labor market effects of the credit depend on the distribution
of taxpayers within the credit’s ranges and the degree to which people in
and out of the labor market respond to incentives. On the former issue, as
noted earlier, around 77 percent of EITC recipients will have incomes that
fall in the flat or phaseout range of the credit, which raises the concern that
the EITC may lead to a net reduction in the labor supplied by low-income
workers. The latter issue concerning the responsiveness to the “effective”
wage and income changes associated with the EITC expansions also can-
not be resolved a priori. It is an empirical matter. Below, we discuss the em-
pirical evidence to date on the magnitudes of these effects.
The simple model illustrated in figure 3.4 focuses on the behavioral
effects for individuals and ignores an important feature of the U.S. tax code
applicable to the EITC. Married couples generally file joint tax returns
and, thus, the AGI subject to taxes depends on their combined income and
not the separate incomes of each spouse. The fact that families, rather than
individuals, are the unit of analysis for the tax system has consequences for
the effective wage rates of secondary earners, which is an issue made even
more important by the EITC. To see this, consider the following example
discussed in Eissa and Hoynes (1998).
Suppose that the husband earns $11,650 (in 1997) and that the couple
makes its time allocation decisions sequentially, with the wife taking ac-
tions under the assumption that her husband’s income is given. In this case,
the family will receive the maximum credit of $3,656 (assuming the couple
has two children) if the wife does not participate in the labor force. If she
does participate, the family’s credit, at the margin, will be reduced by $0.21
and that dollar will be subject to the Social Security payroll tax of $0.142
162 V. Joseph Hotz and John Karl Scholz
percent and any state taxes. Consequently, her marginal tax rate is at least
35 percent; that is, her effective wage rate will be only 65 percent of her
gross wage rate.
This lowering of the wife’s effective wage provides an incentive for the
wife not to participate in the labor force, even though the presence of an
EITC might induce her husband to enter the labor force. Furthermore, if
she works, she has an incentive to reduce her hours of work in the presence
of the EITC (compared to no EITC) due to lowering of her effective wage
(inducing a substitution effect) and to the higher income the family re-
ceives from the EITC (inducing an income effect). Note that the ambigu-
ous effect of the EITC on the labor force participation choice of one of the
spouses does not hinge on the sequential decision-making assumption
noted above. Under a more general model of joint decision-making, the
greater the disparity in the gross wage rates and/or tastes for nonwork time
across spouses, the greater the incentive for an expansion of the EITC to
induce one of the spouses to not participate in the labor force. Again, the
importance of this potential work disincentive effect of the EITC depends
on the magnitudes of the labor supply and labor force participation wage
elasticities of husbands and wives, on the degree to which people correctly
perceive tax incentives, and on the distributions of their wage rates relative
to the phase-in, flat, and phaseout regions of the EITC. We examine em-
pirical evidence on the labor force participation and labor supply effects of
the EITC for married couples below.
3.4.3 Marriage and Fertility
The previous discussion of the potential for differential effects of the
EITC by marital status raises an important issue about the potential effects
of the EITC on family structure. As noted above, the tax treatment of mar-
ried couples is different from that of single parents or individuals, which
leads to situations where a married couple may face larger total tax liabili-
ties than they would pay if they separated. Similarly, two unmarried people
may pay lower taxes than they would if they got married. This is the well-
known “marriage penalty” that has been the focus of attention in the
public finance literature and policy circles.
26
In practice, marriage penalties
tend to accrue to two-earner couples if both partners have similar earnings,
and marriage bonuses tend to accrue to couples if the partners have dis-
parate earnings or only one earner. Two recent studies have suggested that
the EITC and its expansions over the last ten years are an important con-
tributing source of the marriage penalty (see Dickert-Conlin and Houser
1998 and Holtzblatt and Rebelein 1999). For example, Holtzblatt and
The Earned Income Tax Credit 163
26. See Feenberg and Rosen (1995), Alm and Whittington (1995), U.S. Congressional Bud-
get Office (1997), and Bull et al. (1999). The general statement of the problem is that the tax
system cannot simultaneously be progressive, treat the family as the unit of taxation, and be
neutral with respect to marriage.
Rebelein (1999) estimated that the EITC increased the net marriage penal-
ties in the individual income tax by between $3.6 and $9.9 billion in 2000,
depending on the specific assumptions, and that these EITC-related net
penalties accounted for 10.0 to 31.7 percent of the total net projected mar-
riage penalties.
A natural question to ask is whether changes in the EITC are likely to
affect rates of marriage and divorce among the poor. That is, the EITC may
decrease the incentive for single parents to marry by providing resources to
families with children. The credit also provides fairly substantial incentives
for some people to marry and others to separate or not marry. This poten-
tial for the EITC to influence marital status is reminiscent of the concerns
about the effects of other public assistance programs, most notably the
AFDC program, on marriage and the incidence of female headship.
27
To
date, much less attention has been paid in the literature to the impacts of
the EITC on marital status than to those of other assistance programs.
A related question arises as to whether the structure of the EITC also
may affect the fertility decisions of households. As noted in section 3.2, the
EITC was only available to families with children prior to 1994, and, even
now, the maximum credit available to families with children is much larger
than that available to childless taxpayers. In addition, households with two
or more children were able to claim a higher EITC than households with
only one child, starting in 1991. Both of these EITC features constitute a
modest pronatalist incentive for taxpayers. There is a substantial literature
that examines the effects of AFDC on fertility, especially on out-of-
wedlock births.
28
Furthermore, studies have found nonnegligible effects of
provisions of the tax code, namely the presence and generosity of the de-
pendent exemptions, on fertility and the timing of birth (see Whittington,
Alm, and Peters 1990 and Dickert-Conlin and Chandra 1999).
There is no direct empirical evidence on whether EITC fertility incen-
tives have actually influenced behavior. The question, however, is impor-
tant for two reasons. First, the effects of policy on fertility are of general
interest as part of an effort to assess the potential for unintended conse-
quences of tax policy. Second, many of the methods used by researchers to
isolate the effects of the EITC on other behaviors, especially labor supply,
hinge crucially on the assumption that the EITC expansions have had no
effects on the fertility of couples. We return to this issue below.
3.4.4 Consumption Behavior and Income Smoothing
The fundamental tenet of the life-cycle consumption model is that util-
ity-maximizing households will vary their consumption and saving so as to
164 V. Joseph Hotz and John Karl Scholz
27. See Moffitt (1998) for a discussion of this issue and a summary of the empirical evidence
on it.
28. Again, see Moffitt (1998) for a summary of that literature and its findings.