Tài liệu Credit Rating Methodology pptx
Bạn đang xem bản rút gọn của tài liệu. Xem và tải ngay bản đầy đủ của tài liệu tại đây (307.22 KB, 37 trang )
Credit Rating Methodology
November 2009
1
Contents
Contributors 3
Overview of Methodology 5
Business Risk Evaluation 5
Assessing Financial Risk 6
Modeling Cash Flows 7
The Morningstar Credit Rating 8
Components of our Credit Ratings 9
The Cash Flow Cushion™ 9
Debt Refinancing Assessment within the Cash Flow Cushion™ 12
Business Risk Factors 12
Country Risk 12
Company Risk 13
Morningstar Solvency Score
TM
16
Distance to Default 18
Structural Models
18
Assigning Long-Term Issuer Credit Ratings 22
Mapping Scores to Preliminary Credit Ratings 22
Procedures for Assigning Final Issuer Credit Ratings 24
Rating Assignment for Debt Issuers with Estimated Time to Default 24
Appendices 26
Appendix A: Morningstar Solvency Score
TM
Model Development 26
Appendix B: Backtesting 27
Appendix C: Regulatory Score for Utilities 33
Morningstar’s Standard Adjustments to Key Credit-Relevant Ratios for Non-Financial
Corporations 34
Introduction 34
Definition of Credit Ratios 35
Balance Sheet Strength 35
Profitability 36
Cash Generation 36
Liquidity and Coverage 37
2
Contributors
Joel Bloomer
Associate Director – Consumer
Heather Brilliant, CFA
Director – Securities Research
Vahid Fathi
Director – Quantitative Equity Research
Adam Fleck
Senior Analyst – Industrials
Brett Horn
Associate Director – Business Services
Haywood Kelly, CFA
Vice President, Securities Research
Travis Miller
Senior Analyst – Energy
Warren Miller
Senior Quantitative Analyst
Brian Nelson, CFA
Director of Methodology and Training
Catherine Odelbo
President, Securities Research
Josh Peters, CFA
Strategist
Dan Rohr, CFA
Senior Analyst
Matthew Warren
Associate Director - Banks
3
4
Overview of Methodology
By Heather Brilliant, CFA
Morningstar’s credit rating process builds upon the knowledge of companies we have amassed over the past
decade. Just as our equity research methodology is forward looking and based on fundamental company
research, our credit rating methodology is prospective and focuses on our expectations of future cash flows.
Four key components drive the Morningstar credit rating:
1. Business Risk, which encompasses country and industry risk factors, as well as Morningstar's
proprietary Economic Moat™ and Uncertainty Ratings.
2. Cash-Flow Cushion™, a set of proprietary, forward-looking measures based on our analysts'
forecasts of cash flows and financial obligations.
3. Solvency Score™, a proprietary scoring system that measures a firm's leverage, liquidity, and
profitability.
4. Distance to Default, a quantitative model that estimates the probability of a firm falling into financial
distress based on the market value and volatility of its assets.
A company's scores in each area culminate in our final credit rating. Underlying this rating is a fundamentally
focused methodology and a robust, standardized set of procedures and core financial risk and valuation tools
used by Morningstar’s securities analysts. In this document, we provide a detailed overview of how the
Morningstar Credit Rating is derived, and also outline the analytical work that feeds into our coverage of
companies.
Business Risk Evaluation
There are two key elements that comprise our assessment of a firm’s business risk: 1 – economic moat
analysis and 2 – uncertainty analysis.
Morningstar’s Economic Moat Rating
When it comes to company risk, our assessment of a firm’s economic moat is the most important factor. The
concept of an economic moat plays a vital role not only in our qualitative assessment of a firm’s long-term
cash generation potential, but also in the actual calculation and evaluation of the credit rating.
“Economic moat” is a term Warren Buffett uses to describe the sustainability of a company’s future
economic profits. We define economic profits as returns on invested capital, or ROICs, over and above our
estimate of a firm’s cost of capital, or WACC (Weighted Average Cost of Capital). Competitive forces in a
free-market economy tend to chip away at firms that earn economic profits, because eventually competitors
attracted to those profits will employ strategies to capture some of those excess returns. We see the
primary differentiating factor among firms as being how long they can hold competitors at bay. Only firms
with economic moats – something inherent in their business model that rivals cannot easily replicate – can
stave off competitive forces for a prolonged period.
We assign one of three Economic Moat™ ratings: none, narrow, or wide. There are two major requirements
for firms to earn either a narrow or wide rating: 1 – The prospect of earning above-average returns on capital;
and 2 – Some competitive edge that prevents these returns from quickly eroding. To assess the sustainability
5
of excess profits, analysts perform ongoing assessments of what we call the Moat Trend™. A firm’s Moat
Trend™ is positive in cases where we think its competitive advantage is growing stronger, stable where we
don’t anticipate changes to our moat rating over the next several years, and negative when we see signs of
deterioration. The assumptions that we make about a firm’s economic moat play a vital role in determining
the length of “economic outperformance” that we assume in our cash flow model.
Our analysts must vet any proposed changes to the Economic Moat ratings of their companies with senior
managers in Morningstar’s equity research department. This layer of accountability underscores the impact
our Economic Moat ratings have on our valuation and ratings processes, as well as on the many products and
services that Morningstar provides.
Evaluating the competitive dynamics and moats specific to the industry in which a firm operates is also
central to our methodology. Even the best operator in the auto parts industry, for example, would have a hard
time overcoming bankruptcies of its core clients. Our industry analyses are communicated across the analyst
department so we can consistently evaluate firms in similar industries.
Uncertainty Analysis
Morningstar’s Uncertainty Rating measures the predictability of future cash flows, based on the
characteristics of the business underlying the stock. Our framework decomposes the uncertainty around
company value into four simplified conceptual elements: range of sales, operating leverage, financial
leverage, and contingent events. Some industries require special adjustments to this formula, but the basic
framework remains focused on bounding the range of the long run cash generating value of the firm.
Assessing Financial Risk
In evaluating financial risk, we score companies on the following three metrics:
Cash Flow Cushion™
Our proprietary Cash Flow Cushion
TM
ratio gives us insight into whether a company can meet its capital
obligations well into the future. We make adjustments to the firm’s reported operating cash flow to derive its
cash available for servicing its obligations, and compare our forecasts for that cash to the company’s future
debt-related obligations, including interest and debt maturities.
Solvency Score™
We consider several ratios to assess a firm’s financial strength, including the size of a company’s obligations
relative to its assets, and the firm’s debt burden relative to its cash flow. In addition to examining these ratios
in past years, our analysts explicitly forecast the cash flows we think a company is likely to earn in the future,
and consider how these balance sheet ratios will change over time. In addition to industry-standard
measures of profitability (such as profit margins and returns on equity), we focus on return on invested
capital as a key metric in determining whether a company’s profits will benefit debt and equity holders. At
Morningstar, we have been focusing on returns on invested capital to evaluate companies for more than a
decade, and we think it is particularly important to understand a firm’s ability to generate returns on capital in
excess of its cost of capital in order to accurately assess its prospects for meeting debt obligations.
Distance to Default
6
Morningstar's quantitative Distance to Default measure ranks companies on the likelihood that they will
tumble into financial distress. The measure treats a company's equity as a call option on the company's
assets, with the total liabilities being the strike price. The more likely the company's asset value is to fall
below the value of the firm's liabilities, the greater the likelihood of financial distress. The Distance to Default
expresses how many standard deviations separate the current value of assets from the strike price. Our
proprietary metric is particularly conservative as we use 100% of total liabilities in calculating the Distance to
Default.
Modeling Cash Flows
Analyzing current and past financial statements is important, but a company's ability to meet its debt
obligation can't be determined by gazing in the rear-view mirror. That's why our analysts create a detailed
projection of a company’s future cash flows, based on their independent primary research. Analysts create
custom industry and company assumptions to feed income statement, balance sheet, and cash flow
assumptions into our standardized, proprietary discounted cash flow modeling templates. We use scenario
analysis and a variety of other analytical tools to augment this process. Analysts use a standard operating
company model to forecast the vast majority of our covered firms. But, we have also developed specialized
models for determining credit ratings and valuations for banks, insurance firms, and real estate investment
trusts (REITs).
As a result of our methodology, our model is divided into three distinct stages. Here is how the system works
in practice for operating companies:
First Stage
In the first stage of our model, analysts make numerous detailed assumptions about items such as revenue,
profit margins, tax rates, changes in working capital accounts, capital spending, financing requirements, and
potential cash flow generation. These assumptions span a period ranging from five to 10 years, and they
result in detailed forecasts of the company’s income statement, balance sheet and cash flow statement
during that time period. These projections are a key driver in determining our Credit Rating for a given
company.
Second Stage
The length of the second stage depends on the strength of the company’s economic moat. We define the
second stage of our model as the period it will take the company’s return on incremental invested capital to
decline (or rise) to its cost of capital. We forecast this period to last anywhere from 0 years (for companies
with no economic moat) to 25 years (for some wide-moat companies).
Third Stage: Perpetuity
In the final stage, we calculate a continuing value using a standard perpetuity formula. At perpetuity, the
return on new investment is set equal to the firm’s real WACC, which is our discount rate minus inflation, net
of assumed asset decay. At this point, we believe the firm will no longer be able to invest in new projects to
earn a profit greater than its cost of capital. Thus, the company could be generating significant free cash flow
– the more free cash flow, the higher the value – but any net new investment would destroy value for
stakeholders.
7
Analysts look for off balance-sheet assets and liabilities, and adjust their estimates of a firm’s value to
incorporate these impacts. The cash flows from all three stages are then discounted to the present value
using the WACC. By summing the discounted free cash flows from each period, we arrive at an enterprise
value for the firm. Then we can determine a firm’s long-run ability to meet its debt obligations as well as
calculate a fair value for the common stock. The calculations differ for financial firms, but the logic and
reasoning behind our valuation remains the same for these firms as it does for operating companies.
Scenario Analysis
A core part of our research process is to perform scenario analysis on each company we cover. Our analysts
typically model three to five different scenarios, stress-testing the model and examining the distribution of
resulting enterprise values. Such scenario analysis incorporates each analyst's assessment of both business
and financial risk.
The Morningstar Credit Rating
We use our assessment of a firm’s future cash flows, Economic
Moat, Uncertainty, and financial risk to arrive at an overall credit
rating for the firm. Our ratings are completely independent,
objective, and forward looking. We place considerable emphasis
on marrying qualitative and quantitative analysis to arrive at our
Credit Ratings. We apply weightings to each factor we consider,
placing particular emphasis on some of the proprietary metrics
we have honed over time, including Economic Moat. Using
these factors, we rate firms on an industry-standard scale, as
described in the table on the right.
AAA Extremely Low Default Risk
AA Very Low Default Risk
A Low Default Risk
BBB Moderate Default Risk
BB Above Average Default Risk
B High Default Risk
CCC Currently Very High Default Risk
CC Currently Extreme Default Risk
C Imminent Payment Default
D Payment Default
8
9
∑
∑
+
5
1
5
1
0
Yr
Yr
Yr
Yr
Yr
ommitmentsntractualCDebtlikeCo
eeCashFlowAdjustedFrdCashTotalLiqui
Components of our Credit Ratings
The Cash Flow Cushion™
By Brian Nelson, CFA
Morningstar's proprietary Cash Flow Cushion™ ratio is a fundamental indicator of a firm's future financial
health, and is a key component of the Morningstar Credit Rating. The measure reveals how many times a
company's internal cash generation plus total excess liquid cash will cover its debt-like contractual
commitments over the next 5 years. At its core, the Cash Flow Cushion™ acts as a predictor of financial
distress, bringing to light potential refinancing, operational, and/or liquidity risk inherent to the firm.
The advantage of the Cash Flow Cushion™ ratio relative to other fundamental indicators of credit health is
that the measure focuses on the future cash-generating performance of the firm via Morningstar's proprietary
discounted cash flow model. By reclassifying certain cash expenses as liabilities to reflect their debt-like
characteristics, our analysts compare future projected free cash flows with debt-like cash commitments
coming due in any particular year. The forward-looking nature of this metric allows the analyst to better
anticipate changes in a firm's financial health, and pinpoint periods where cash shortfalls are likely to occur.
Here is the formulaic representation of the Cash Flow Cushion™ ratio used as a component of the
Morningstar Credit Rating:
Nuts & Bolts
Typically, a bond default occurs as a result of any missed or delayed payment of interest or principal, resulting
in either bankruptcy or a distressed securities issuance. As such, the Cash Flow Cushion™ focuses on the
timing of interest and principal payments (including the debt of joint ventures, if necessary) and considers
other debt-like (off-balance sheet) mandatory cash contractual commitments including lease payments,
pension/post retirement contributions, guarantees, legal contingent obligations, etc. that, if left unpaid, may
ultimately lead to financial distress and/or bankruptcy. The sum of a firm's total cash obligations and
commitments over the next five years forms the denominator in the calculation of the firm's Cash Flow
Cushion.™
Let's walk through an assessment of a firm's debt-like commitments, using 3M as an example:
Dec-09 Dec-10 Dec-11 Dec-12 Dec-13
Contractual Obligations
(Debt Maturity Schedule) (892) (109) (899) (723) (849)
(Interest Expense)
(282) (239) (238) (202) (179)
(Cash Lease Payments)
(111) (73) (57) (32) (22)
(Cash Pension Contributions)
(725) (300) 0 0 0
(Capital Leases)
(8) (7) (7) (6) (5)
Total Cash Obligations and Commitments
(2,018) (728) (1,201) (963) (1,055)
10
As the table above reveals, 3M faces a manageable debt maturity schedule, with just over 10% of its total
debt ($6.1 billion) coming due in each year, on average, during the next five years. We see that 3M is also on
the hook for over $1 billion in cash pension contributions through 2010, as the firm's retirement plans were
severely underfunded at the end of 2008 due to declining global markets. However, we don't think the firm
will have any cash pension contributions beyond 2010 due to rebounding equity values, which should ease
that burden. We also consider 3M's cash interest payments, as well as cash outlays for capital leases in
arriving at the firm's total cash obligations and commitments.
After assessing the firm's debt profile and other cash needs, analysts then back out the cash components of
expense items included in net income from continuing operations that resemble debt-like contractual cash
commitments. This may include rent expense, pension expense, and other operating items, but not maturing
debt or other items that were not initially in net income. For example, if a cash debt-like expense item is
originally included in net income from continuing operations, analysts add the cash components of that item
back to net income from continuing operations before including it in total cash obligations and commitments
to avoid double counting. These adjusted items are then tax-effected to arrive at the firm's adjusted net
income from continuing operations.
Sticking with our 3M example, we consider the cash components of interest expense, rent expense, pension
expense (pension service cost), and capital lease expense in arriving at adjusted net income from continuing
operations for the company, per the following:
Our analyst's forecast of 3M's adjusted net income from continuing operations is then used to arrive at
adjusted cash flow from operations. In 3M's case, we expect accounts receivable and inventory two
components of net working capital to fall as a result of sharply declining sales, generating cash for the firm
during 2009. However, we forecast rebounding revenue beginning in 2010, which will likely require working-
capital investment a use of cash:
Dec-09 Dec-10 Dec-11 Dec-12 Dec-13
Adjusted Free Cash Flow
Net Income from Continuing Ops
3,128 3,479 4,102 4,101 4,415
Interest Expense, tax-effected
195 165 164 139 124
Rent Expense, tax-effected
77 50 39 22 15
Pension Service Cost, tax-effected
234 245 263 283 303
Capital Lease Expense, tax effected
6 5 5 4 3
Adjusted Net Income from Continuing Operations
3,639 3,944 4,574 4,549 4,860
Depreciation Expense
1,071 1,122 1,204 1,293 1,386
Amortization of Other Intangibles
0 0 0 0 0
Impairment of Goodwill
0 0 0 0 0
Other Non-Cash Adjustments to Operating Income
(195) (204) (219) (249) (267)
Deferred Income Taxes & Other Adjustments to Net Income
0 0 0 0 0
Changes in Operating Assets and Liabilities
(Increase) Decrease in Accounts Receivable
272 (139) (225) (242) (260)
(Increase) Decrease in Inventory
159 (80) (97) (223) (236)
(Increase) Other Short-Term Operating Assets
0 0 0 0 0
Increase (Decrease) in Accounts Payable
(84) 58 43 109 103
Increase (Decrease) in Other Current Liabilities
0 0 0 0 0
Adjusted Cash Flow from Operations
4,861 4,701 5,280 5,236 5,586
The firm's total capital expenditures, asset sales/dispositions, acquisitions, and cash flows related to
investments in long-term operating assets are then subtracted from adjusted cash flow from operations in
arriving at the analyst's assessment of the company's adjusted free cash flow. 3M has been highly acquisitive
during the recent past, spending nearly $3 billion to purchase companies over the past three years. We
expect this pace to slow somewhat, but we still forecast continued spending on both acquisitions and capital
expenditures to fund internal growth, as the table below shows:
Dec-09 Dec-10 Dec-11 Dec-12 Dec-13
Adjusted Cash Flow from Operations
4,861 4,701 5,280 5,236 5,586
(Capital Expenditures)
(1,030) (1,000) (1,000) (1,000) (1,000)
Asset Sales & Dispositions of Discontinued Operations
0 0 0 0 0
(Acquisitions) and (Increase) Decrease in Net Long Term Operating Assets (347) (363) (390) (419) (419)
Additions/Subtractions to Adjusted Free Cash Flow 0 0 0 0 0
Adjusted Free Cash Flow 3,485 3,338 3,890 3,818 4,168
The sum of the analyst-adjusted free cash flows for 3M over the next five years is then added to the firm's
current total excess liquid cash and cash equivalents ($1.85 billion) in forming the numerator of the Cash
Flow Cushion™. In its truest form, the numerator for 3M reveals its total liquidity available to service debt-like
cash commitments over the five-year period.
Current Dec-09 Dec-10 Dec-11 Dec-12 Dec-13
Liquid Cash and Cash Equivalents
Excess Cash and Cash Equivalents
1,849 3,399 4,847 6,842 8,787 11,086
(Illiquid Cash and Cash Equivalents)
0 0 0 0 0 0
Total Liquid Cash and Cash Equivalents
1,849 3,399 4,847 6,842 8,787 11,086
Cash Flow Cushion
TM
and Morningstar Credit Rating
The Cash Flow Cushion™ ratio used in the generation of the Morningstar Credit Rating represents how many
times total excess liquid cash plus internal cash generation will cover debt-like contractual commitments
over the next five years. In 3M's case, we expect the firm's total cash balance plus the sum of its forward
adjusted free cash flow to cover its debt-like contractual commitments 3.5 times (344.5%) over the next five
years, which is a very healthy measure:
5-year Cash Flow Summary % of Commitments
Millions
Total Cash Balance (t=0) 1,849 31.0%
Sum of 5-year Forward Adj. FCF 18,698 313.5%
Total Cash and Cash Generation, 5 yr 20,547 344.5%
Total Cash Commitments, 5 yr (5,965)
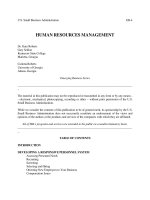
Analysts also consider an annual variant of the Cash Flow Cushion™ to assess the financial health of the firm
on a rolling basis. If this particular ratio falls below 1 in any forecast year, the company may be exposed to
potential financial/operational distress or refinancing risk in that given year. In 3M's case, the firm's annual
ratio is comfortably above the possible default line of 1, signaling that no such risk is present.
11
Annual Cash Flow Cushion
0.0
5.0
10.0
15.0
Annual Cash Flow Cushion
2.64 9.25 7.28 11.07 12.28
Possible Default Line
11111
Dec-09 Dec-10 Dec-11 Dec-12 Dec-13
Debt Refinancing Assessment within the Cash Flow Cushion™
Within the Cash Flow Cushion™, an analyst may make subjective assessments of the risks posed by debt
maturities. We may address part of this risk using an asset adjustment in certain cases for firms with long-
lived assets such as REITs and utilities. By considering the value of assets on the balance sheet such as
inventory, accounts receivable, and property, plant, and equipment, we can estimate the collateral available
for a lender to lend against either explicitly using secured debt, or implicitly through unsecured debt and
associated covenants. Through assumptions, including approximations of market values for those assets and
acceptable loan-to-value ratios, we assess whether a lender would be willing to refinance an upcoming debt
maturity. The asset adjustment will offset all, part, or none of expected debt maturities in the Cash Flow
Cushion™ depending on analyst assumptions in each year. For example, aggressive assumptions such as
high asset values and loan-to-value ratios will create a larger borrowing base, increasing the likelihood that
the asset adjustment will offset future debt maturities, thereby increasing the Cash Flow Cushion ™.
Business Risk Factors
Two separate scores converge to form our Business Risk Score: Country Risk and Company Risk. Once we
assign these two component scores, we weight them as follows to determine the overall Business Risk
score for each company:
Country Risk 10%
Company Risk 90%
Country Risk
No matter how solid a company's finances, if it operates in an unstable political or economic environment, it
deserves a lower credit rating than a similar firm operating under more benign conditions. Because a
significant percentage of our coverage includes firms domiciled outside the United States – and those that
call the United States home but have considerable non-U.S. operations – we incorporate an evaluation of
country risk where appropriate. Some components that we consider are differences in expected inflation,
financial disclosure, expropriation risk, and other specific operating-market differences. Country risk
considerations are incorporated across the analyst department to ensure consistency. We score each
country 1 to 25 (with 25 being best) based on five general areas.
12
Political Stability
Does the country have a well-established method of transferring political power, and does it operate free of
foreign interests?
Legal System
Does the country have a tradition of respecting contracts and a well-established framework for settling legal
disputes?
Interest Rate, Inflation Stability
Is the country's political establishment committed to sound economic, monetary, and fiscal policies that
result in low inflation, relatively stable interest rates, and manageable government debt?
Robustness of the Financial Markets/Strength of Banking System
Does the country have a rational, predictable regulatory regime, with established, transparent rules in areas
like accounting, securities-market regulation, capital requirements, and government disclosure?
Credit History
Does the country have a history of respecting its debt obligations, or has the political establishment defaulted
on sovereign debt or inflated it away?
Company Risk
We score each company on seven company-specific risk factors. The emphasis here is on the inherent
characteristics of the firm regardless of its current balance sheet (which we capture with other measures).
Measures such as the Economic Moat and Uncertainty Rating also contain an inherent industry element.
Some industries are more conducive to Economic Moats than others, and some industries have inherently
higher levels of uncertainty about future cash flow.
Economic Moat Rating
An essential part of our company analysis is the Economic Moat rating, which encapsulates our view as to a
company's competitive advantage and ability to earn excess returns on capital. We assign a score based on a
company's Economic Moat Rating, as determined by our analysts.
Moat Rating Score
Wide 10
Narrow 5
None 1
Uncertainty Rating
We assign a score based on a company's Uncertainty Rating, as determined by our analysts. Morningstar's
analysts assign Uncertainty Ratings based on their estimation of the range of possible revenues over the next
three years, the company's operating leverage, and the company's financial leverage. We assign the scores
as follows:
13
Uncertainty Rating Score
Low 10
Medium 7.5
High 5
Very High 2.5
Extreme 1
Size
Smaller companies are inherently less stable, and more vulnerable to financial distress, than larger firms. We
assign companies a score based on revenue as follows:
Annual Revenue Score
Greater than $25 billion 10
Between $13 billion and $25 billion 9
Between $7 billion and $13 billion 8
Between $4.5 billion and $7 billion 7
Between $3 billion and $4.5 billion 6
Between $1.8 billion and $3 billion 5
Between $1 billion and $1.8 billion 4
Between $500 million and $1 billion 3
Between $200 million and $500 million 2
Less than $200 million 1
Product & Customer Concentration
An important factor in the stability of a company's future revenues and profits is the diversification of both its
product portfolio and its customer base. Other things equal, a company with a wide variety of products sold
to a variety of end markets is less subject to economic or regulatory shocks than a more-focused company.
Our analysts assign a Concentration Score to their companies on a scale of 1 to 5, with diversified firms
(examples: 3M and Johnson & Johnson) scoring a 5, and companies with a single product or narrow base of
customers scoring a 1.
Stewardship Grade
Our analysts assign each company we cover a Stewardship Grade of A through F. The Stewardship Grade
captures our view of a company's transparency, board independence, incentives and ownership, and investor
friendliness. We feel these are key components in determining whether a company's management team is
looking out for investors (whether equity or bond holders) as opposed to their own interests. We map these
grades to scores (A=5, B=4, C=3, D=2, and F=1).
Dependence on Capital Markets
Our analysts score each company on its need to access the capital markets over our five-year forecast
horizon. Because capital markets are inherently unpredictable, a company whose survival depends on them is
more at risk than a company that can ignore the whims of the market. If the company definitely must access
capital markets over the next five years, it scores a 1. If it could easily continue to operate if all capital
markets closed for five years, it scores a 5.
14
Cyclicality of Operations
The greater the economic sensitivity of a firm, the more likely it is to go bankrupt, all else being equal. Our
analysts assess the cyclicality of each firms’ operations and assign a score to those companies on a scale of
1 to 5. An extremely cyclical firm like an airline may receive a score of 1, while a stable utility may receive a
score of 5.
15
Morningstar Solvency Score
TM
By Warren Miller
Any credit scoring system would be remiss to ignore a company’s current financial health as described by
some key financial ratios. Perhaps the most widely known calculation for describing a company’s financial
health via accounting ratios is the Altman Z-Score. In our effort to create a ratio-based metric superior to the
Altman Z-Score, we used binary logistic regression analysis to evaluate the predictive ability of several
financial ratios commonly believed to be indicative of a company’s financial health as described in the
Solvency Score
TM
Development Appendix. This extensive testing yielded a calculation that has shown to be
more predictive of corporate bankruptcy than the Altman Z-Score. We refer to it as the Morningstar Solvency
Score
TM
. Results of our performance testing can be found in the Backtesting Appendix of this document.
Financial ratios can describe four main facets of a company’s financial health: liquidity (a company’s ability to
meet short term cash outflows), profitability (a company’s ability to generate profit per unit of input), capital
structure (how does the company finance its operations?), and interest coverage (how much of profit is used
up by interest payments). The Morningstar Solvency Score
TM
includes one ratio from each of these four
categories.
Although our extensive testing was based on previously reported accounting values, Morningstar’s equity
analysts continually forecast the very same accounting values for future time periods. No testing of our
analysts’ forecasts has been possible due to data limitations, but it is reasonable to assume that using
analyst estimates of future accounting values will yield more predictive results than previously reported
ratios. As a result, the Morningstar Solvency Score
TM
utilizes some analyst estimates of future ratios.
Morningstar Solvency Score
TM
01
1
1
0
0
5.1Re45 QuickRatiolstedCapitaturnOnInve
EBITDA
penseInterestEx
TotaAssets
litiesTotalLiabi
×−×−××
(1)
bilitieseratingLiaLongTermOp
iesntLiabilitOtherCurre
yableAccountsPa
ExcessCash
etseratingAssLongTermOp
tsgibleaAsseIn
lNetGoodwil
NetPPE
etsCurrentAsspitalInvestedCa
−
−
−
−
+
+
+
+
=
tan
Where:
0
1
1
Re
pitalInvestedCa
stforeIntereEarningsBe
lstedCapitaturnOnInve =
16
Part of the attractiveness of the Solvency Score
TM
is in its appeal to intuition. A practitioner of financial
analysis will recognize that each of the ratios included has its own ability to explain default risk. See our
Backtesting Appendix for greater detail. In addition, the weighting scheme and ratio interaction appeal to
common sense. For instance, it is logical to assume that an interest coverage ratio would be highly predictive
of default. However even healthy companies can have odd years where profits may suffer and interest
coverage is poor. For this reason, a multiplicative combination of the interest coverage ratio with a capital
structure ratio is more explanatory than either ratio individually, or even a linear combination of the two. This
is because interest coverage is not highly important for companies with healthy balance sheets (perhaps they
have cash on hand to weather even the most severe of downturns) but interest coverage becomes more
important as liabilities increase as a percentage of a company’s total capital structure.
The Morningstar Solvency Score
TM
is an integral part of Morningstar’s credit rating methodology, and serves
as an improvement over the more commonly used Altman Z-Score. However any default-prediction system
that relies solely on reported accounting values will suffer from its reliance on the accuracy and timeliness of
the input data. This is why, when possible, each input in the Morningstar Solvency Score
TM
is input by a
Morningstar Analyst, and the coverage and profitability ratios are derived from an analyst’s one-year forecast
rather than previously reported values. While these measures will help combat the false positives generated
by an as-reported system, the Solvency Score
TM
, like other quantitative models, still generates a very large
number of false positives, and is best used as a ranking system that can help “red flag” a particular company
that may soon face financial distress. The Morningstar Cash Cushion ratio is more specifically designed to
predict default with minimal false positives.
17
Distance to Default
By Vahid Fathi
Instead of using accounting-based ratios to formulate a measure to reflect the financial health of the firm, this
approach makes use of structural or contingent claim models. In some cases, accounting measures based on
historical financial statements may have little or no bearing on the future viability of the firm. An area of
weakness in accounting measures based on historical financial statements of the firm, for example, is the
inherent understatement of the firm's book value in most cases, which results in overstatement of the
financial leverage measures if such are to be used as a proxy of the financial health of the firm. Last, but not
least, accounting measures based on historical financial statements of the firm do not account for the
volatility of a firm's assets in spite of the fact that the probability of bankruptcy and a firm's asset volatility are
related. For example, two firms having identical financial leverage can have significantly differing probabilities
of bankruptcy depending on their assets’ volatility.
All underlying financial data used to calculate the company Distance to Default scores are from Morningstar’s
internal equities database. Market data required for estimation of distance to default, including stock prices
and the safe rate (one year treasury yield), are downloaded from current feeds available to Morningstar.
Structural Models
Structural models take advantage of both market information and accounting financial information. For this
purpose, option pricing models based on the seminal works of Black and Scholes (1973) and Merton (1974)
are a natural fit. The firm's equity can be viewed as a call option on the value of the firm's assets. If the value
of assets is not sufficient to cover the firm's liabilities at the strike price, default is expected to occur and the
call option expires worthless and the firm is turned over to its creditors.
Asset Value = Equity Value + Liabilities (1)
The underlying premise of contingent claim models is that default occurs when the value of the firm's assets
falls below a certain threshold level in relation to the firm's liabilities. According to Merton (1974) if the firm's
liabilities consist of one zero-coupon bond with notional value L, maturing in T (without any debt payment
until T), and equity holders wait until T (to benefit from an expected increase in the asset value), the default
probability at time T, is that the value of assets is less than the value of the liabilities. To estimate this
probability, the value of the firm's liability is obtained from the firm's latest balance sheet.
L
t
= L
s
+ L
l
(2)
Where:
L
t
= Total Liability
Ls
= Short-Term Liability
L
l
= Long-Term Liability
Next, the probability distribution of a firm's asset value at time T needs to be estimated. It’s assumed that
the value of a firm's assets follows a log-normal distribution, i.e. the logarithm of the firm's asset value is
normally distributed and the expected change in log asset values is
μ
-
δ
-
σ
2
/ 2. The log asset value in
T year therefore follows a normal distribution with the following parameters:
18
ln A
T
N [ ln A
t
+ (
≈
μ
-
δ
-
σ
A
2
/ 2) (T - t) ,
σ
A
2
(T – t)] (4)
Where
μ
is the continuously compounded expected return on assets or the asset drift and
δ
is asset yield, expressed in terms of current asset value and is equal to
(TTM common + preferred dividends) / Current asset value
Next, the probability that a normally distributed variable x falls below z is given by
/])[{( xEzN −
σ
A
(x)},
Where N denotes the cumulative standard normal distribution.
To empirically estimate the Black-Scholes probability from equation (4), we need estimates of: A
t
,
μ
and
σ
A
which are not directly observable. Though if they were known there would be no need for using Black-
Scholes and the probability of bankruptcy (PB) and Distance to default (DD), can be expressed (McDonald
2002) as:
PB = N{ - [[ ln A
t
– ln L
t
+ (
μ
-
δ
-
σ
A
2
/ 2) (T-t)] / [
σ
A
)( tT −
]]}
= N{ - [[ ln (A
t
/ L
t
) + (
μ
-
δ
-
σ
A
2
/ 2) (T-t)] / [
σ
A
)( tT −
]]} (5)
DD = [ ln A
t
+ (
μ
-
δ
-
σ
A
2
/ 2) (T – t) – ln L
t
)] /
σ
A
)( tT −
(6)
=> PB = N [ -DD] (7)
Equation (5) shows that the probability of bankruptcy is a function of the distance between the value of firm's
assets today and the book value of firm's total liabilities (A
t
/ L
t
), adjusted for the expected growth in asset
value, asset drift, and asset yield (
μ
-
δ
-
σ
A
2
/ 2) relative to asset volatility,
σ
A
.
But the market value of the firm's assets is not observable, and can be very different than the book value of
the firm's assets. This is the A
t
in equation (5). Furthermore, we do not know the volatility of the market
value of the firm's assets, nor we can use the observed asset values (book values) as a proxy of the firm's
market value of asset volatility,
σ
A
. That's where the option pricing comes in since it implies a relationship
between the unobservable (A
t
,
σ
A
) and the observable variables. As long as the value of the firm's assets is
below the book value of the firm's liabilities, the payoff to equity holders is zero. If the value of the firm's
assets is higher than the book value of the firm's liabilities, equity holders receive the residual value, and their
payoff increases linearly as the value of the firm's assets increases over time. This can be expressed as the
payoff of a modified (for dividends) European call option:
E
T
= Max (0, A
T
– L
t
) (8)
19
Assuming risk-neutrality, the equity value, E
t
, can be estimated by a modified (for dividends) standard Black-
Scholes call option formula:
E
t
= A
t
e
-
δ
T
*
N (d
1
) – L
t
*
e
– rT
*
N
(d
2
) + ( 1 - e
-
δ
T
) A
t
(9)
Where
r is the safe rate (one year treasury yield), and
N (d
1
) and N
(d
2
) are the cumulative standard normal of d
1
and d
2.
Dividend yield,
δ
, is added to the standard Black-Scholes model in equation (9), which appears twice in the
right hand side of the equation. First, term A
t
e
-
δ
T
accounts for the reduction in the value of firm's assets
due to dividends that are distributed at time T. Second, term ( 1 - e
-
δ
T
) A
t
accounts for the fact that it is
the equity holders that receive the dividend – these terms do not appear in the standard Black-Scholes
equation for valuing a call option on a dividend paying stock since dividends are not paid to option holders:
d
1
= { ln [A
t
/ L
t
] + (
μ
-
δ
+
σ
A
2
/ 2)) T } /
σ
A
T
(10)
and
d
2
= d
1
-
σ
A
T
= { ln [A
t
/ L
t
] + (
μ
-
δ
-
σ
A
2
/ 2)) T } /
σ
A
T
(11)
Given the assumption of risk neutrality, the value of the call option derived from the standard Black-Scholes
formula is not a function of a firm's asset return or drift,
μ
. The risk-neutrality assumption in the Black-
Scholes formula implies that assets are expected to grow at the safe rate of return and therefore only the risk
free rate, r, enters the Black-Scholes equation. The actual probability of bankruptcy depends on the actual
distribution of future values of assets and is a function of a firm's asset drift,
μ
as per modified Black-Scholes
equation (5).
The objective is the estimation of the firm's value of the asset, A
t
, drift,
μ
and volatility,
σ
A
though we only
have one equation (9) establishing a link between the two unknown values A
t
and
σ
A
.
There are different methods to obtain more information to estimate these two values. One approach is to
come up with another equation that establishes another link between these two values. Then both equations
can be simultaneously solved to determine these two values. The optimal hedge equation (12) below, which
shows the equity volatility,
σ
E
is related to asset value, A
t
, and asset volatility,
σ
A
and establishes the
relationship between the two values. Again d1 in equation (12) is the standard Black-Scholes d1 per equation
(10). Term A
t
e-
δ
T in equation (12) is needed to reflect the reduction in the value of the firm's assets due to
dividends that are distributed at time T:
σ
E
= (A
t
e
-
δ
T
N (d1)
σ
A
) / E
t
(12)
If we know the equity value, E
t
(market price times shares outstanding), and have an estimate of equity
volatility,
σ
E
(annualized standard deviation of daily stocks daily log returns), equations (9) and (12) are two
20
21
equations with two unknowns (A
t
,
σ
A
) that can be solved simultaneously for a numeric solution of the
firm's asset value.
Alternatively, the firm's asset value, drift and volatility can be estimated iteratively based on daily calculations
of asset values and use of CAPM. By rearranging Equation (9) we obtain asset value A
t
:
()
)(1
)(
1
2
dNee
dNeLtEt
At
TT
δδ
−−
+−
•+
=
rT−
(13)
These asset values can then be directly entered in the distance to default and probability of default equations
(5) and (6).
The following example illustrates step by step the formulation and solution for the iterative method.
1- Set time horizon T-t = 1 year (Actual trailing twelve month, TTM Business days)
2- Set the daily equity value, E
t
, for the TTM by multiplying daily common stock price times shares
outstanding.
3- Set total daily liabilities, L
t
, equal to latest available quarterly sum of short term liabilities, L
s,
and
long term liabilities, L
l
. for the TTM – note these figures remain the same for each day and only
change when a newer quarterly balance sheet becomes available during the TTM period
4- Set daily gross common and preferred dividends paid in the TTM – use the record date instead of
payout date and calculate TTM dividends and annual rate of daily asset yields
5- Set the daily yield for one year treasuries for the TTM
6- Calculate daily asset values and their volatility for the TTM – see example iteration
A firm's asset volatility is calculated as the annualized standard deviation of the preceding TTM
(approximately 252) business daily log returns of asset values. To calculate daily log returns of asset values
for the TTM period we simply take the natural log of day two asset value divided by the natural log of day one
asset value and repeat the process for all 252 business days. Next we estimate asset drift,
μ
using CAPM.
To do this, first, asset beta is calculated as the log of the slope of the regression line for excess daily
arithmetic returns of assets versus the market. Second the expected asset return or drift,
μ
is calculated by
multiplying the estimated asset beta in the previous step by the equity risk premium (assumed to be 4.8%)
and add the safe rate.
Calculate Distance to Default and Probability of Bankruptcy
We now can directly enter the firm's asset volatility and drift calculated from the preceding section into the
distance to and probability of default Equations (5) and (6).
Assigning Long-Term Issuer Credit Ratings
Mapping Scores to Preliminary Credit Ratings
By Warren Miller
There are four main components of an issuer’s numerical credit score. The Solvency Score
TM
, Distance to
Default, Business Risk and Cash Flow Cushion™ are combined as shown in the equation below.
()()
(
)
(
)
(
)
DDDDDDD
CCBRSSDDMAXBRSSDDScoreCredit ×
+
×
+
×
+×= ,,85.35.3
Where:
DD
D
= Distance to Default Score
SS
D
= Solvency Score
TM
Score
BR
D
= Business Risk Score
CC
D
= Cash Flow Cushion
TM
Score
Our backtesting results suggest that Solvency Score
TM
and Distance to Default score have enhanced
predictive ability when combined in equal weights. Business Risk holds greater weight than these
quantitative measures, given the significant influence that country, company, and industry risks have on a
firm’s overall credit health and ability to meet future obligations. The equation is constructed with the Cash
Flow Cushion™ having a coefficient dependent on the values of the other variables because it will place
greater importance on the Cash Flow Cushion™ in levered scenarios. This construct is helpful because the
Cash Flow Cushion™ should have the fewest false positives of any of the main elements. However, the Cash
Flow Cushion™ is also subject to analyst forecasts, which can contain modeling errors. In situations deemed
“safe” by the DD
D
, SS
D
, and BR
D
, the Cash Flow Cushion™ will have less weight in order to minimize the
effect any possible modeling errors. We expect the Cash Flow Cushion™ to have fewer false positives
because it describes the true forecasted cash inflows and outflows of a company. Since these cash flows
represent the actual ability of a firm to repay its obligations, the Cash Flow Cushion™ should be the best
absolute predictor of financial distress in our arsenal of scores.
The four pillars are transformed into scores from 1 to 10 (10 being worst) based on breakpoints calculated
with historical distributions of each data point. For Distance to Default and the Solvency Score
TM
, we used an
entire business cycle worth of data. While this was not possible with the Business Risk and Cash Flow
Cushion
TM
scores, we have set static breakpoints. Because the breakpoints are relatively static, the scores
are not relative measures. At any particular time, significantly more than 10% of companies could have the
same score for any particular component.
22
The credit score resulting from the above equation is mapped according to the table below to its
corresponding credit rating.
Credit Score Credit Rating Description
[16-23] AAA
Extremely low default risk. Issuers rated AAA typically operate wide
moat, low uncertainty businesses and can easily cover all outstanding
maturities with cash on hand and one year’s worth of free cash flow.
[23-61] AA
Very low default risk. Issuers rated AA tend to be wide or narrow moat
companies with low to medium uncertainty and a Morningstar Cash
Flow Cushion™ that affords a very wide margin of safety against
adverse developments.
[61-96] A
Low default risk. Issuers rated A typically include wide or narrow moat
companies with medium to high uncertainty and a Morningstar Cash
Flow Cushion™ that affords a wide margin of safety against adverse
developments.
[96-142] BBB
Moderate default risk. Issuers rated BBB typically include narrow or no
moat companies with medium to very high uncertainty and a
Morningstar Cash Flow Cushion™ that affords a modest margin of
safety against deteriorating business conditions.
[142-174] BB
Above average default risk. Issuers rated BB typically include no moat
companies with high to very high uncertainty and a Morningstar Cash
Flow Cushion™ that affords a minimal margin of safety against
deteriorating business conditions.
[174-199] B
High default risk. Issuers rated B typically include no moat companies
with very high uncertainty and a Morningstar Cash Flow Cushion™ that
indicates significant dependence on favorable business conditions.
Assigned by
Committee CCC
Currently very high default risk. Issuers rated CCC typically include no
moat companies with very high uncertainty and a Morningstar Cash
Flow Cushion™ that indicates extreme dependence on favorable
business conditions to avoid default or significant capital restructuring.
Assigned by
Committee
CC Currently extreme default risk
Assigned by
Committee C Imminent payment default
Assigned by
Committee
D Payment default
The final credit score can be accepted by the analyst, or the analyst can propose an adjustment to the
modeled score to the credit committee. The credit committee will review all cases where the analyst
disagrees with the modeled credit rating to bring consistency to the rating process. This will ensure that the
analyst’s arguments for differing from the prescribed score are sound.
23
Procedures for Assigning Final Issuer Credit Ratings
Our process for assigning final credit ratings is as follows:
1. The analyst derives the preliminary issuer credit rating based on our proprietary credit rating
methodology.
2. The analyst takes the preliminary issuer credit rating to the Credit Rating Committee for sign-off. The
analyst can argue for a higher or lower rating than the preliminary rating, but the ultimate decision
rests with the Credit Rating Committee.
3. At least once per quarter, the analyst updates the preliminary credit rating. If the preliminary rating
indicates that a change in the issuer credit rating is warranted, or if the analyst has other
information that he/she feels warrants a change in the credit rating, the analyst meets with the
Rating Committee.
4. All changes to issuer ratings need to be approved by the Credit Rating Committee.
Rating Assignment for Debt Issuers with Estimated Time to Default
By Brian Nelson, CFA
In the chart on the next page, we outline the conceptual
framework the Credit Rating Committee uses, in conjunction
with additional analysis, to support the ratings it assigns to
non-investment grade debt, where a timing element is
considered.
AAA Extremely Low Default Risk
AA Very Low Default Risk
A Low Default Risk
BBB Moderate Default Risk
BB Above Average Default Risk
B High Default Risk
CCC Currently Very High Default Risk
CC Currently Extreme Default Risk
C Imminent Payment Default
D Payment Default
The approach measures a firm's timing to default, in years,
and starts with liquid cash on hand and then phases in adjusted
free cash flow generation and debt-like cash maturities on an
annual basis during the next five years. At its core, the
framework represents a basic cash burn analysis expanded to a
five-year horizon. The information required to do this
analysis across our coverage list is embedded in the Cash Flow
Cushion™.
24
Essentially, when cumulative cash flow/burn crosses 0, the firm may be exposed to potential default if it is
unable to secure additional financing at that time. If a firm’s cumulative cash flow/burn crosses 0 during
Years 1-2 there may be support for a ‘C’ rating, during Year 3 a ‘CC’ rating, and during Years 4-5 a ‘CCC’
rating. The Credit Rating Committee may also consider other firm-specific criteria in assessing the timing to
default and assigning ratings CCC through C.
25