Describe the business context i introduction to SSStutter
Bạn đang xem bản rút gọn của tài liệu. Xem và tải ngay bản đầy đủ của tài liệu tại đây (3.33 MB, 28 trang )
TABLE OF CONTENT
A - Describe the business context......................................................................................................................... 4
I. Introduction to SSStutter................................................................................................................................. 4
1. General information of SSStutter............................................................................................................. 4
2. Install MIS to control and analyze significant data about customers, products sold,
products returned................................................................................................................................................ 4
II. Organizational chart......................................................................................................................................... 5
III. Core business processes................................................................................................................................ 5
1. Mission (sứ mệnh tầm nhìn của doanh nghiệp)...............................................................................5
2. Business process.............................................................................................................................................. 6
3. Expectation from our project..................................................................................................................... 6
B - Investigate the real world related to the SSStutter’s problem......................................................7
I. Interview................................................................................................................................................................... 7
II. Document study................................................................................................................................................... 8
III. Identification of requirements.................................................................................................................. 8
C. Database diagrams.................................................................................................................................................. 9
I. BFD............................................................................................................................................................................... 9
II. ERD........................................................................................................................................................................... 10
III. DSD......................................................................................................................................................................... 10
D. System implementation:................................................................................................................................... 11
I. Tables....................................................................................................................................................................... 11
II. Relationships...................................................................................................................................................... 13
III. Form...................................................................................................................................................................... 13
1.
Customer Form.......................................................................................................................................... 13
2.
The Order Form......................................................................................................................................... 15
3.
The Product Form.................................................................................................................................... 17
IV. Queries:................................................................................................................................................................ 17
V. Report..................................................................................................................................................................... 21
E. User manual:............................................................................................................................................................ 23
F. Ending:......................................................................................................................................................................... 26
G. Reference:................................................................................................................................................................. 26
1
TEAM MEMBER
1. Phạm Thùy Linh
2. Nguyễn Tài Trí
3. Nguyễn Hải Yến
4. Nguyễn Trần Quang Khải
5. Chế Anh Dũng
6. Lê Phương Linh
7. Nguyễn Văn Thành
8. Lê Xuân Anh
9. Nguyễn Đức Long Vũ
10. Nguyễn Thanh Bình
2
LIST OF ACRONYMS
DSD
Database System Design
BFD
Business Function Diagram
ERD
Entity Relationship Diagram
TABLE OF FIGURES
Figure 1 - Organizational chart of SSStutter…………………………………………………………5
Figure 2 - Business Funtion Diagram of the database…………………………………………..9
Figure 3 - Entity Relationship Diagram of the database……………………………………….10
Figure 4 – DSD Specification…………………………………………………………………………….10
Figure 5 - Group Databasse……………………………………………………………………………...11
Figure 6 - Customer Databasse…………………………………………………………………………12
Figure 7 - Order Databasse…………………………………………………………………………….….12
Figure 8 – Customer Form……………………………………………………………………………….13
Figure 9 – Order Form…………………………………………………………………………………….15
Figure 10 – Customer Form…………………………………………………………………………………….17
Figure 11 - Data updated customer…………………………………………………………………….18
Figure 12 - Data updated group………………………………………………………………………….18
Figure 13 - Data updated order…………………………………………………………………………..19
Figure 14 - Data updated product………………………………………………………………………19
Figure 15 – Sales Management Information System……………………………………………23
3
A - Describe the business context
I. Introduction to SSStutter
1. General information of SSStutter
Starting in 2014 with the criteria "Looking for the best of the most basic
things" - right from the first steps, SSstutter chose their own direction with the more
selected items, the products. The product was invested with the desire to bring people
who love fashion to have a new look, a new feeling, and more: "Refined from inside."
SSstutter with the message "Refined from inside" - that's when you not only dress
nicely but also have a "streamlined" lifestyle - delicate and neat more than anyone
else. SSstutter is a pretty hot name for fashion followers in Saigon as well as in Hanoi.
With service, professional, and enthusiastic counseling customers can own beautiful
and suitable wings with minimalism style.
2. Install MIS to control and analyze significant data about customers,
products sold, products returned
The main objective in this project is to control and analyze important data on
customers, products sold, returned products make it much simpler and more effective
to meet customer satisfaction and increase productivity for SSStutter. Customers can
buy clothes through the app to serve quickly and professionally.
In addition, the project will create convenience for both employees and
managers. Employees can check detailed information about the number of clothing
sold, the number of clothes also in stock, etc. It is not only time-saving but also makes
customers feel professional service. On the other hand, managers can update the work
process through the database application because this tool will record detailed
information about customers as well as the process of employees working in the
Stores.
Last but no less important, monitoring supports data management database
applications effectively in the working process of the SSStutter. It can calculate
revenue and profit from the effective reservation and accuracy.
4
II. Organizational chart
Figure 1 - Organizational chart of SSStutter
III. Core business processes
1. Mission (sứ mệnh tầm nhìn của doanh nghiệp)
SSStutter’s mission is to deliver the joy of shopping to customers and try to
fulfill all the missing pieces that competitors are lacking.
According to SSStutter's CEO Thu Le, SSS still focuses on each message:
Wearing beauty is something everyone can do, but it does not have to be valued by
others. To be respected, you must meet two criteria: “Dress smartly - when you wear
what suits you, and change yourself from the inside out - from Delicate Habits to
Standard Behavior.”. SSStutter's products are undoubtedly highly invested. The
company provides a product with a vision that it would bring customers confidence
and convenience when dressed on.
The key value of SSS is the cutting-edge characteristic of the products
themselves and the whole brand’s vibe. The company wants to serve customers a
minimal yet modern look. A product that is both formal enough and at the same time
can be casual.
5
SSStutter's primary activity is to provide products for men with sophisticated
and neat designs, making it simple to gain the viewer's respect. Furthermore, these
designs are often drawn from the fashion trends of countries that excel in both fashion
and entertainment, such as Korea. However, these products are not only fashionable
but also provide comfort to the user.
SSStutter has built a large and growing group of young fashion-loving people
since it focuses on shaping a lifestyle for young people rather than just doing business
or trading. The term "lean community" refers to a group of people. This is most
apparent in the fact that each SSStutter Collection is warmly received by young
people and can "sell out" in as little as 48 hours.
2. Business process
The core business process of SSStutter includes 6 main steps in the fashion
production process, which will be overviewed as follow:
Phase 1: Idea creation - Developing your ideas
Phase 2: Technical Design - Designing a product in detail for manufacturing
Phase 3: Product Development - Developing and approving prototype samples
of your product
Phase 4: Pre-Production - Compiling all materials and trims and preparing for
production
Phase 5: Production - manufacturing your product
Phase 6: Selling - generating a profit by selling your products
3. Expectation from our project
For sale manager:The overriding priority is to meet the satisfaction of
customers.
● It helps save managers’ time
● They will be provided the most up-to-data details and material
● Managers can update the working process through the database application
because this tool will record detailed information about customers as well as
the process employees working in stores/factories.
● They can analyze and classify customer levels by using sophisticated statistical
techniques
● The system will send out all the update order information, production
knowledge, and production activities reports frequently.Therefore, the
6
managers can give out advice directly and discover problems.
For customers:
It would be way easier for them to identify the best seller to support their
buying decisions as well as manage their budget for our apparels.
B - Investigate the real world related to the SSStutter’s problem
I. Interview
SSStutter is a young fashion brand with the spirit of "Lean: Sophisticated Neat", targeting customers from 18-24 years old. After 6 years of operation, this brand
currently has 7 stores in Hanoi and Ho Chi Minh City; quite famous in its segment and
has a large number of loyal customers.
Thu started out as an auditing student, working part-time by selling clothes.
After that, he used these experiences to open his own shop, but at first he only stopped
at the level of importing and selling. The turning point came to Thu once she was sick
and could not go to China to import goods.
"At that time, normally, I had to go to China for 5 days a month, and a year, I
had to spend up to 2 months just to import goods. If I was sick every month, there
would be no sales. After 2 years, I couldn't stand the pain. passively, moreover
realizing that there are very few local brands in the market, so they are determined to
produce their own products, not simply import goods somewhere to sell and then take
beautiful photos," Thu shared.
Thu said that the lack of fashion expertise is her strong point; because most
professional people often have very high egos. Instead of finding out what customers
need, they believe in their own style and aesthetic eye and that is a business mistake.
The most important thing is to understand new trends and customers' needs, both of
which Thu has gained through her time working as a hired hand and selling imported
clothes.
"Thanks to that time, I understood the law of displacement, which means that
what is popular in China or Korea will become a trend in Vietnam after a while," Thu
shared.
According to the young entrepreneur, the standard ratio when using his budget
is: 60% for advertising and 40% for the remaining activities. He has a view,
Marketing and Sales play the role "as important as the right hand and the left hand".
Therefore, SSStuter focused on advertising continuously in the first year even though
the business was not profitable. The letter confirmed that this decision had brought
satisfactory results.
Besides, Thu believes that a provision should be set aside, enough for the
company to survive the first year of inefficient business. If you can endure through
this time, the business can go far.
7
Regarding investment, CEO SSStuter said that he did not put too much weight
because the barriers to the fashion market were not large; While working with
investors is a challenge, especially when the founder has a high ego - a trait often seen
in young people. With Thu, friends, brothers, and family are the "angel investors" that
everyone should look to first when they want to get help.
II. Document study
Income Statement
The income statement shows a company's expense,
income, gains, and losses
Balance sheet
a statement of the assets, liabilities, and capital of the
business at a particular point in time
List of customers
It includes customers’ information and contact
Inventory list
Shows the number of products remained
III. Identification of requirements
According to the manual interview, there are several drawbacks that the old
information systems would cause the company. If the brand wants to improve their
performance, they should consider a new comprehensive management system that can
prevent time-consuming, low accuracy and manage their cash flow more effectively.
When the business is growing, keeping track of the increasing amount of data
can be tricky. Our system can help manage all the business-critical data centrally,
safely and securely - whenever they need it - to boost their chances of success. Using
our database to manage staff records can save the company time and money. It can
streamline most of the HR tasks, automate routine jobs and speed up the processing of
data such as staff hours, leave, benefits, payroll, etc.
8
As customers are the lifeblood of SSStutter, then a good customer relationship
management (CRM) database should be at the heart of their growth plans. CRM
databases are usually powerful enough to store and process everything, from customer
contact details, interaction history and accounts, to new prospects, leads and business
opportunities. The systems can even help to run and track marketing campaigns, such
as email newsletters. Moreover, by using an inventory tracking database, the company
can avoid several miscounts or misplace spreadsheets and note that can disappoint the
customers.
C. Database diagrams
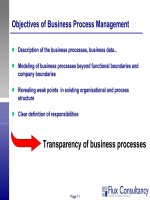
I. BFD
SSStutter Sales Management
SSStutter Sales Management
Sales
Sales
transactions
transactions
Management
Management
Classification
Classification
Management
Management
Customer
Customer
Management
Management
Group of
Group of
products
products
Management
Management
Product
Product
Management
Management
Goods
Goods
sold
sold
management
management
Sales reporting
Sales reporting
Information
Information
request
request
Data access
Data
and access
and
processing
processing
Figure 2 - Business Funtion Diagram of the database
The above diagram describes the business function which the database
application for sales management will try to solve. The sales management system
aims to manage:
● Classification management: manage customers, group of products and products
● Sales transaction management: manage information related to products sold
● Reporting: to control information request, data access and processing, and
report creation - give effective information for suitable management decisions.
9
Report
Report
creation
creation
II. ERD
Customer
place
Order
contain
Product
belongs
to
Group
Figure 3 - Entity Relationship Diagram of the database
●
●
●
●
This diagram demonstrates the relationships between entities in the business:
One customer can place multiple orders, but one specific order can only be
made by one customer.
One order can only be sold from the store inventory, but the store inventory can
put out multiple orders.
One order can contain multiple products, and the same product can be
contained in multiple orders.
One specific product can only belong to one specific group, but one group can
have multiple products in it.
10
III. DSD
Figure 4 – DSD Specification
The last diagram contains detailed information required in each entity.
D. System implementation:
I. Tables
We have following tables:
● The Group table provides Group ID and Group Name
Figure 5 – Group Databasse
● The Product table includes detailed information of the products: Product ID,
Description, Group ID and Unit Price.
11
Figure 6 – Product Databasse
● The Customer table provides Customer ID, Customer Name, Contact and
Address
Figure 6 – Customer Databasse
● The Order table involves items of Bill No, Customer ID, Product ID and Sales
Date.
12
Figure 7 – Order Databasse
● The Invoice detail table includes Bill No, Product ID and Quantity Sold
All of this information is necessary for each business when managing the sales
process. These tables have an intimate relationship. The Product ID is included in both
Product and Order tables. The salesman can check the price of products through the
Products table. Additionally, the specific order can be checked through Invoice and
Invoice detail tables. This relationship will help SSStutter manage the order easier and
more conveniently.
II. Relationships
This function of Microsoft Access shows how the data sets are related to each
other. In this relationship table, it shows that a part of the Customers table, a part of
the Orders tables and a part of the Products table are combined. All of this information
is necessary for each store when managing the order process. These tables have an
intimate relationship. The Customer ID is included in both Customer and Order tables.
The Product ID is included in the Order and Product tables. Thus, the sales manager
can check who the Customer is and what the product is through those tables.
Additionally, the Product ID can be checked through the Product and Group
table. This relationship will help the sales manager find the product easier and more
conveniently. Besides, it also helps the store manager take care of the amount of
remaining product.
In conclusion, this is called a one to many relationships. For example, there can
only be one group but there can be many customers for that order. The same definition
is applied to Products. There can only be one product in the products table but in a
group, it can be made within many different orders.
13
III. Form
1. Customer Form
● The Customer Form will provide information about Guest ID, Contact
and Address
Figure 8 – Customer Form
● The interface can move to the next customer by clicking ‘next record’.
14
How to add data - Step 1: Click the New Record button
● In order to update information about a new customer, the receptionist
moves to a new folder, the user will click ‘new record’, then fill in the
blank item like guest ID, NameThe information will be saved as a new
record.
How to add data - Step 2: Type in the data you want to add and Press Enter to
15
save
2. The Order Form
● The Order Form provides information about Bill No, Customer ID,
Product ID and Sales Date.
Figure 9 – Order Form
16
Through Order Form, sales staff and accountants can check the Customer
ID,Sales date, Bill ID. We can find information in the records part (one of 20) by
clicking on the next record, last record, or new record. To create a new invoice, sales
staff will create in Customer Form rather than Order Form. Order Form is almost used
when the sales staff or accountants need to edit the order information like changing
sales date, products sold...
3. The Product Form
● The Product form includes detailed information of the products: Product ID,
Description, Group ID and Unit Price.
17
Figure 10 – Customer Form
The Product Form includes detailed information related to the goods. The above items
show the goods features characteristics like type of clothes (Long Pants, Short Pants,
Shirt, T-shirt,..) and which type is for men or women. This form does not serve the
purpose of checking availability. Checking availability must use another report.
Specifically, this form allows the user to arrange information in order depending on
the user’s need by clicking on the filter.
IV. Queries:
-
Queries are mostly used to seek and compile data from one or more tables. A
database query is a comparable operation that is most closely related to a
CRUD (create, read, update, delete) function. Running a query is the same as
asking a specific question of your database. In Access, creating a query implies
establishing a precise search criterion to discover the data you're looking for.
18
Figure 11 - Data updated customer
Figure 12 - Data updated group
19
Figure 13 - Data updated order
Figure 14 - Data updated product
-
Though there are options for finding data within a database such as searches
and filters, queries are a strong tool that can extract information from many
Consider this: when employees or managers do a search in the customer
database to locate the name of one client at their firm, or while using a filter
option on the other table to display just orders placed in the recent few weeks.
They can examine both customers and orders at the same time if they use either
of these two options. This is feasible thanks to the query option. They could
easily run a query to get the name and phone number of every consumer who
has purchased something in previous weeks.
20
-
8 steps to create a simple table query:
+ Step 1: Select the create tank on the ribbon and locate the Queries
+ Step 2: Now tap to the Query Design
How to create query - Step 2: Click on Create then click Query Design on Taskbar
+
Step 3: Access will switch to Query Design view. In the show table
dialog box, select the table you want to run a query on.
How to create query - Step 3: Select the table you want to run a query on
+ Step 4: Click Add, and then click to the Close option.
+ Step 5: The selected will appear as a small window in the Object
Relationship pane. In the table window, make a double click in the
field names that you want to include in your query.
+ Step 6: Set the search criteria by clicking the cell in the criteria row of
each field you want to filter.
+ Step 7: After you have set your criteria, run the query by clicking the
Run command on the design tab.
21
How to create query - Step 7: Run the query by clicking the Run command on
the design tab.
+ Step 8: The query result will appear in the query’s datasheet view, which
looks like a table. If you want to query by clicking the same command
in Quick Access Toolbar.
V. Report
Report is an object in the database to display and summarize information in
Microsoft Access database. Information in a report consists of information that was
taken from tables, queries and was reorganized into report form. Below are the steps
to create Report:
- Step 1: Click on Create then click Report Wizard on Taskbar
How to create a Report - Step 1: Click on Create then click Report Wizard on
Taskbar
-
Step 2: On new Window, double click on the fields you want to appear on
report
22
How to create a Report - Step 2: Double click on the fields you want to appear on report
-
Step 3: Click Next, then choose the format you want
How to create a Report - Step 3: Click Next, then choose the format you want.
-
Step 4: Click Finish to create new report
23
In our assignment, reports were used to show information about customers,
products and invoices in a systematic way. Take the Product report as an example, an
employee can easily see the information of a product.
How to create a Report - Step 4: Click Finish to create new report.
E. User manual:
● When you click on our Sales Management Information System in Access, the
screen will present like the picture below with 4 main contents: Tables,
Queries, Forms, and Reports.
24
Figure 15 – Sales Management Information System
● Double click in each table to see the information of customer, products, group,
invoice, and invoice detail of the Sales during the period that the companies
applied our MIS.
How to use MIS - Double click in each table to see the information
● To add information of each table, you switch to the form of tables in the
navigation pane in the left
For example, we choose the Customer form, the screen will like
25