The potential impact of covid 19 on GDP and trade
Bạn đang xem bản rút gọn của tài liệu. Xem và tải ngay bản đầy đủ của tài liệu tại đây (1.29 MB, 26 trang )
ev
er
r
The Potential Impact of COVID-19
on GDP and Trade
A Preliminary Assessment
Public Disclosure Authorized
ep
rin
tn
ot
pe
Maryla Maliszewska
Aaditya Mattoo
Dominique van der Mensbrugghe
East Asia and the Pacific Region
Office of the Chief Economist
&
Macroeconomics, Trade and Investment Global Practice
April 2020
Pr
Public Disclosure Authorized
9211
iew
ed
Public Disclosure Authorized
Public Disclosure Authorized
Policy Research Working Paper
This preprint research paper has not been peer reviewed. Electronic copy available at: />
iew
ed
Policy Research Working Paper 9211
Abstract
ev
scenario in which containment is assumed to take longer
and which now seems more likely. The biggest negative
shock is recorded in the output of domestic services affected
by the pandemic, as well as in traded tourist services. Since
the model does not capture fully the social isolation induced
independent contraction in demand and the decline in
investor confidence, the eventual economic impact may
be different. This exercise is illustrative, because it is still
too early to make an informed assessment of the full impact
of the pandemic. But it does convey the likely extent of
impending global economic pain, especially for developing
countries and their potential need for assistance.
pe
er
r
The virus that triggered a localized shock in China is now
delivering a significant global shock. This study simulates
the potential impact of COVID-19 on gross domestic product and trade, using a standard global computable general
equilibrium model. It models the shock as underutilization
of labor and capital, an increase in international trade costs,
a drop in travel services, and a redirection of demand away
from activities that require proximity between people. A
baseline global pandemic scenario sees gross domestic product fall by 2 percent below the benchmark for the world,
2.5 percent for developing countries, and 1.8 percent for
industrial countries. The declines are nearly 4 percent below
the benchmark for the world, in an amplified pandemic
Pr
ep
rin
tn
ot
This paper is a product of the Office of the Chief Economist, East Asia and the Pacific Region and the Macroeconomics,
Trade and Investment Global Practice. It is part of a larger effort by the World Bank to provide open access to its research
and make a contribution to development policy discussions around the world. Policy Research Working Papers are also
posted on the Web at The authors may be contacted at
The Policy Research Working Paper Series disseminates the findings of work in progress to encourage the exchange of ideas about development
issues. An objective of the series is to get the findings out quickly, even if the presentations are less than fully polished. The papers carry the
names of the authors and should be cited accordingly. The findings, interpretations, and conclusions expressed in this paper are entirely those
of the authors. They do not necessarily represent the views of the International Bank for Reconstruction and Development/World Bank and
its affiliated organizations, or those of the Executive Directors of the World Bank or the governments they represent.
Produced by the Research Support Team
This preprint research paper has not been peer reviewed. Electronic copy available at: />
iew
ed
The Potential Impact of COVID-19 on GDP and Trade:
A Preliminary Assessment
tn
ot
pe
er
r
ev
Maryla Maliszewska, Aaditya Mattoo and Dominique van der Mensbrugghe 1
JEL Codes: F17, I15, C68
ep
rin
Keywords: COVID-19, Infectious Disease, International Trade, Economic Growth, CGE Modeling
1
Pr
A joint product of the Chief Economist Office of East Asia and Pacific and the Trade and Regional Integration Global
Unit. Maria Pereira provided excellent research assistance. We are grateful to Caroline Freund, Ergys Islamaj,
Antonio Nucifora and Ekaterine Vashakmadze for helpful suggestions and discussions. The findings, interpretations,
and conclusions expressed in this paper are entirely those of the authors. They do not necessarily represent the
views of the International Bank for Reconstruction and Development/World Bank and its affiliated organizations, or
those of the Executive Directors of the World Bank or the governments they represent.
This preprint research paper has not been peer reviewed. Electronic copy available at: />
1.
Introduction
iew
ed
As the coronavirus emerged in China and spread globally, authorities have acted to limit its spread.
Experience with similar diseases reveals that while the human costs are significant, the bulk of the
economic costs are due to the preventive behavior of individuals and the transmission control policies of
governments (Brahmbhatt and Dutta, 2008). Current experience is no different. As the virus spread
internationally, many countries have already taken or will eventually take action to limit the spread,
through social isolation policies, such as shutting educational institutions, limiting work and restricting the
mobility of people. The preventive actions have had an immediate and significant impact on all
economies, and through trade and tourism, on partner economies.
ev
Economic models can be used to model the consequences of pandemics (Burns et. al. (2006), Bloom et.
al. (2005), Lee and McKibbin (2004), McKibbin et. al. (2006), Evans et. al. (2014)). Building on previous
studies, this paper focuses on four channels—i) the direct impact of a reduction in employment; ii) the
increase in costs of international transactions; iii) the sharp drop in travel; and iv) the decline in demand
for services that require proximity between people.
pe
er
r
We consider two scenarios: a global pandemic and an amplified global pandemic. In the case of the global
pandemic, it is assumed that countries bear only one-half of the impact of the full China shock. In the case
of the amplified global pandemic, the shocks are uniform across all countries. A baseline global pandemic
scenario sees GDP of the world fall by 2 percent below the baseline, of developing countries by 2.5
percent, and of industrial countries by 1.8 percent. The declines are nearly twice as large in an amplified
pandemic scenario in which containment is assumed to take longer.
ot
It is still too early to make an assessment of the impact of the virus based on full statistical evidence. High
frequency data are providing some indicators, but it is hard to assess the depth and the breadth of the
pandemic as it spreads, and to precisely estimate how long it will take countries to return to normal
activity levels. This paper seeks to illustrate the transmission channels and heterogenous impact of
COVID19 on output and trade in different scenarios. The results presented here should be regarded as
scenario analyses, not as projections. The implemented shocks are illustrative and based on previous
episodes of global epidemics or on preliminary data.
Pr
ep
rin
tn
The assumptions on the spread of the disease are not grounded in epidemiological projections, they do
not take into consideration the quality of the health systems in the affected countries, transport
connections to affected countries, and health policy responses to the outbreak. The model incorporates
the decline in demand due to reduced production and incomes but does not fully capture the independent
contraction in demand, except for the reductions in tourism and other services that require close human
contact. It also does not include the decline in investor confidence and any financial repercussions. We
capture some aspects of global value chains trade, but a fuller analysis will require a richer data set. This
analysis will evolve as we fine tune assumptions in line with early impacts and evaluate potential scenarios
of the spread of the virus.
-2This preprint research paper has not been peer reviewed. Electronic copy available at: />
2.1 Global computable general equilibrium model Envisage
iew
ed
2. Methodology, transmission channels, and scenarios
The quantitative findings in this paper are based on simulations using a version of the Envisage model
calibrated to GTAP Version 10A (Aguiar et al. (2019); see Annex 1 for aggregation mappings). The latter
has a 2014 reference year and the model is being used in its comparative static specification. Envisage is
a relatively standard computable general equilibrium (CGE) model. 2 The model has been configured for a
short-term closure with the following assumptions:
•
ev
•
Production elasticities have been reduced to near zero, so there is little substitution possibility
across inputs in production.
In order to capture the typically durable relationship within global value chains, trade elasticities
for goods have been reduced from their standard values to represent the short-run inability to
replace imported components and final goods with products from other countries. The elasticity
between domestic and imported goods has been set to 0.4. The elasticity of substitution across
import sources has been set to 0.8.
Labor supply is exogenous, while wages adjust to equate demand and supply of labor. The
return to capital is fixed, while supply of capital is endogenous.
er
r
•
2.2 Transmission channels
pe
The shocks have been divided into four sets, but all are assumed to occur simultaneously, i.e. the final
shock encompasses all shocks. 3 The duration of the shocks is currently unknown, though, based on prior
events, it is likely to last from 8-12 weeks and most likely unsynchronized across countries.
ot
1. The first shock is a drop in employment by 3 percent below the baseline. With lower availability of
labor, we would expect wages, ceteris paribus, to rise, while return to capital is unchanged under
our assumptions. Lower labor also means lower demand for capital, as firms need a combination of
labor and capital to produce goods and services.
ep
rin
tn
Underutilization of capacity takes place due to factory closures (workers stay home, leaving capital and
natural resources idle) as well as social distancing forcing workers to stay at home. Due to higher rates of
contagion, immediate unemployment consequences of COVID-related business closures and negative
demand shock, we conservatively assume the underutilization of the labor force to be 3% on average over
the whole year across all sectors of the economy. 4 There is a lot of uncertainty surrounding these
assumptions, and the country-specific employment effects will depend on the duration and intensity of
the pandemic and containment measures, the sectoral composition of employment, and the flexibility of
the labor market.
A full description of the Envisage model is available at
/>3
The shocks are scaled down as compared with the shocks derived for Liberia under the Ebola epidemic, as in
Evans et al. (2014).
4
This is a conservative estimate. Some estimates put potential reduction of employment at the annual level at
10%, assuming unemployment of over 30% in Q2 and returning to pre-crisis level in Q3 and Q4.
/>
Pr
2
-3This preprint research paper has not been peer reviewed. Electronic copy available at: />
iew
ed
2. The second shock (cumulative with the supply shock) raises the international trade costs of imports
and exports by 25%. The shock is applied across all goods and services. Trade costs arise when goods
cross borders.
ev
The assumed increase in transport and transactions costs in foreign trade is driven by additional
inspections, reduced hours of operation, road closures, border closures, increases in transport costs, etc.
Evans et al. (2015) estimate that the outbreak of Ebola could lead to an increase in trade costs of 10%.
Since COVID-19 is affecting more countries and the containment measures seem more severe due to the
efforts to contain the virus, we amplified the shock increasing international trade costs of imports and
exports to 25%.
er
r
3. The third shock entails a sharp drop in international tourism. This is captured via a 50% consumption
tax on international tourism-related services, such as transport, accommodation, etc. This generates
a typically small revenue for the relevant countries that is rebated back to households with a lump
sum. 5 The export tax is applied to both outbound and inbound (tourist) services that include:
accommodation, food and service activities; water, air and other transport; and recreational and
other services.
ot
pe
The effects of COVID-19 in the tourism, hospitality and recreation sectors have been unprecedented. In
the accommodation and lodging sectors, quarterly revenues are down 75%. Travel agents saw a slowdown
in bookings of 50% in March of 2020. Airlines worldwide are expected to lose $113 billion in revenues for
2020. In the peak of the outbreak, 70% of scheduled flights in China have been canceled. As of mid-March
2020, international travel has ground to a halt, with the World Travel and Tourism Council (WTTC)
estimating that global travel would decline at least 25 percent in 2020. To capture the effects of the drop
in tourism, hospitality and recreation services, we implemented a 50% tax on the export of trade-related
services, resulting in a drop in exports of tourism services at a global level of 20-32%.
rin
tn
4. The fourth shock represents a demand switch by households who purchase fewer services requiring
close human interaction, such as mass transport, domestic tourism, restaurants, and recreational
activities, while redirecting demand towards consumption of goods and other services. Demand for
the targeted services is assumed to drop by 15%. This results in a reallocation of household demand
across sectors, while total expenditures are still driven by previous shocks and relative prices of goods
in the consumption basket.
Pr
ep
It is difficult to estimate the impact of social distancing and overall decline of economic activity on those
selected sectors, but anecdotal evidence suggests that it is likely to be significant. With social distancing
measures and closures of nonessential businesses, the bookings through Opentable network declined by
100% in the second half of March (data form the United States, the United Kingdom, and Germany).
Depending on the length of the business closures, the annual impact could vary drastically. The decline of
15% at an annual level seems like a middle of the road estimate.
There are a number of ways to affect demand choices by increasing the cost of purchasing the relevant good. The
solution in this case has been to impose export taxes that directly affect the price of the targeted services. The
revenues generated by this tax are rebated back to households.
5
-4This preprint research paper has not been peer reviewed. Electronic copy available at: />
2. 3 Scenarios
ot
pe
er
r
ev
iew
ed
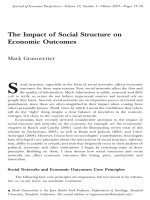
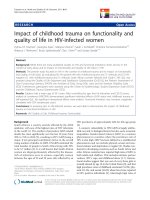
Figure 1. Implications of the COVID-19 as implemented in the Envisage model.
tn
We start by considering the effects of COVID-19 on world supply capacity, trade costs, international
tourism, and demand switching, as discussed above. Then we study the consequence of similar shocks
under the “amplified global pandemic” scenario.
Pr
ep
rin
“Global pandemic” scenario
In the global pandemic scenario, we aim to capture relatively rapid recovery and limited contagion, where
the shocks are implemented to the full degree in China, but other countries experience shocks amounting
to only half the shocks described below:
Underutilization of labor by 3 percent across all sectors in the global economy results in declining
capital usage.
Trade costs of global imports and exports increase by 25%, applied across all goods and services.
Sharp drop in international tourism (captured via a 50% tax on inbound and outbound touristrelated services such as transport, accommodation, etc.).
Reallocation of demand away from sectors requiring human interaction.
-5This preprint research paper has not been peer reviewed. Electronic copy available at: />
iew
ed
“Amplified global pandemic” scenario
In the amplified global pandemic scenario, we capture a bigger reduction in annual output due to a deeper
and more prolonged pandemic. The same shocks are assumed in all countries, effectively doubling the
shocks for all countries and keeping the China shock unchanged.
3. Impacts of COVID-19
ev
3.1 Macroeconomic impacts
The global pandemic scenario assumes that the pandemic hits China the hardest, but also hurts other
countries, so we use it as an example to explain the impacts on other countries. The global pandemic is
expected to reduce Chinese GDP by 3.7% (all percentage changes are reported in relation to the baseline).
The impact on China becomes progressively more negative as impacts of the shocks accumulate. First, the
supply shock reduces GDP through reduction in employment (and capital) leading to lower production
and exports, as well as lower imports due to lower income of households and shrinking production.
pe
er
r
Second, with higher trade costs, the price of a unit of imports and exports increases and the
competitiveness of Chinese production declines due to higher costs of exporting and higher costs of
inputs; final goods’ prices also increase. The rising trade costs represent a productivity loss, since
additional inputs are needed to bring goods to their consumers, instead of being available for
consumption and investment. Further, inbound and outbound tourism decreases significantly, resulting
in further decline of Chinese GDP and exports. Finally, with the composition of expenditures changing
with lower demand for sectors hit by social distancing (transport, hospitality) and relatively higher
demand for goods, the composition of output tilts towards manufacturing. Loss of competitiveness and
lower income result in a decline of total exports by 3.5%, while imports decline by 3.2 %. China’s exports
of tourist-related activities decline by 29%, while imports of tourist-related activities decline by 37%. Real
consumption by households declines by 7.2%.
tn
ot
Global GDP is expected to decline by 2.1%, while developing countries’ GDP is expected to decline by 2.5%
and high-income countries by 1.9%. The biggest GDP losses under the global pandemic scenario are
expected in East Asia and Pacific (EAP) countries due to their relatively deep integration through trade
and direct impact on tourism, e.g. Cambodia (3.2 %), Singapore (2.1 %), Hong Kong SAR, China (2.3 %),
Thailand (3 %), Vietnam (2.7 %), and Malaysia (2.1 %).
Pr
ep
rin
Exports at the global level are expected to decrease by 2.5%. China, considered to be the “world’s factory”,
suffers a decline in production across all sectors and goods, due to an underutilization of labor and capital,
and, together with an increase of its trade costs, increases the import costs for the rest of the world, which
translates into a decline in global exports. China sees a contraction in exports of 3.7%. Vietnam sees a
decline in its total exports by only 1%, because it benefits to an extent from the gap left by the decrease
in Chinese exports. Some countries in the East Asia and Pacific region are the most affected in terms of
export declines, with Hong Kong SAR, China, suffering the biggest losses (5.2 %), followed by the Lao
People’s Democratic Republic (3.6%), Cambodia (3.9%) and Singapore (4.4%). Selected countries see an
increased demand for their tourism exports due to diversion of tourism from the EAP region, with some
flows increasing by 2%-3% between countries outside the EAP region, but in all countries total tourism
flows decline across the board, with exports from the EAP region declining by about 30%. These small
bilateral tourism export gains disappear, as the shock spreads from China and East Asia to other parts of
the world.
-6-
This preprint research paper has not been peer reviewed. Electronic copy available at: />
er
r
ev
iew
ed
Figure 2a. GDP and export implications of the global pandemic scenario (% deviation from the benchmark)
Source: Envisage simulations
rin
tn
ot
pe
Figure 2b. GDP and export implications of global pandemic scenario for EAP countries (% deviation from the
benchmark)
ep
Source: Envisage simulations
Pr
Under amplified global pandemic scenarios, global GDP loss reaches 3.9 %, while Chinese GPD declines by
4.3% (Figures 3a, 3b). The biggest GDP losses are reported in the regions most integrated through trade
and/or where tourism trade plays a big role in the economy. Cambodia and Thailand are expected to
record GDP losses of over 6%, while Singapore; Hong Kong SAR, China; Taiwan, China; the Republic of
Korea; Malaysia and the Philippines see losses of over 4.5%, which are also of higher magnitude than in
China. High-income countries could see significant losses of GDP, with the estimated loss in the European
-7-
This preprint research paper has not been peer reviewed. Electronic copy available at: />
iew
ed
Union over 3.4%, Japan – 4.6%, the United States – 3.4% and Canada – 3.2%. Countries in Sub-Saharan
Africa (SSA) and the Middle East and North Africa (MENA) are the least affected, and under the global and
amplified global pandemic scenarios, the estimated loss of GDP is estimated to be around 3%.
ev
Under the amplified global pandemic scenario, global exports decline 4.6 %. Several countries that
experience larger than global average losses of exports are in the EAP region such as Hong Kong SAR,
China (9.8%), Cambodia (7.4%), Singapore (8.5%), Lao PDR (7.3%), Thailand (6.8%), but also the Russian
Federation and the Philippines see losses up of 6.4%, while Canada, Europe, and the United States see
declines of around 4.5%. With the amplified global spread of the virus, all countries see their total exports
decline, but the least integrated regions through trade and tourism, such as MENA, SSA, and Latin America
and the Caribbean, are the least affected. Some EAP countries tend to be relatively less affected in this
scenario than others, but all countries’ exports decline the most under the amplified global pandemic
scenario, e.g., Vietnam, Japan, and Korea.
Pr
ep
rin
tn
ot
pe
er
r
Our estimates are broadly in line with previous studies. Annex 2 reviews several analyses by OECD,
Brookings and S&P quantifying the potential impacts of the COVID-19 outbreak. The studies use a variety
of tools, with OECD relying on a macroeconomic model and Brookings applying a hybrid CGE/DSGE model
with rational expectations. Most estimates on the impacts on China range from 0.5% to 2% of GDP. World
GDP is expected to decline between 0.1% and 1.5 %, while global trade is expected to decline between
0.2% and 3.75 %. The biggest impacts are reported in the extreme scenarios by McKibbin and Fernando
(2020), with Chinese GDP declining by up to 6%, with GDP declines in the United States and Japan
reaching, respectively, 8% and 10%.
-8This preprint research paper has not been peer reviewed. Electronic copy available at: />
Table 1: GDP implications of various scenarios - cumulative impacts (% deviations from the benchmark)
iew
ed
ev
Hong Kong SAR, China
Korea, Rep.
Singapore
Taiwan, China
-2.31
-2.44
-2.08
-2.81
-4.82
-4.89
-4.45
-5.67
-1.57
-1.85
-2.23
-1.67
-1.38
-1.44
-1.71
-1.85
-1.94
-2.21
-2.41
-2.31
-1.70
-2.49
-1.84
-2.09
-3.18
-3.85
-4.57
-3.40
-2.95
-2.95
-3.42
-3.73
-3.99
-4.60
-4.93
-4.68
-3.37
-4.00
-3.77
-3.86
er
r
China
Developing EAP excluding China
Cambodia
Lao PDR
Malaysia
Thailand
Vietnam
Philippines
Indonesia
Global
pandemic
-3.69
-2.38
-3.21
-2.15
-2.09
-3.03
-2.65
-2.46
-1.74
Amplified
global
pandemic
-4.31
-4.76
-6.57
-4.05
-4.23
-6.21
-4.49
-4.80
-3.51
Pr
ep
rin
tn
ot
pe
Canada
Europe
Japan
United States
Middle East & North Africa
Sub-Saharan Africa
Brazil
Rest of Latin America & Caribbean
Russian Federation
Rest of Europe & Central Asia
India
Rest of South Asia
Oceania
Developing countries
High-income countries
World Total
Source: Envisage simulations
-9This preprint research paper has not been peer reviewed. Electronic copy available at: />
-5.18
-1.90
-4.39
1.14
-9.80
-3.95
-8.48
1.07
-2.30
-2.48
-1.04
-2.37
-2.22
-1.87
-2.03
-2.21
-3.49
-2.89
-1.68
-1.99
-2.32
-2.80
-2.30
-2.50
-4.73
-4.86
-2.33
-4.60
-4.87
-4.29
-4.27
-4.76
-7.44
-5.72
-3.45
-4.12
-4.98
-4.54
-4.59
-4.57
er
r
Hong Kong SAR, China
Korea, Rep.
Singapore
Taiwan, China
ev
iew
ed
Table 2: Real exports implications of various scenarios - cumulative impacts (% deviations from the
benchmark)
Amplified
Global
global
pandemic pandemic
China
-3.73
-3.08
Developing EAP excluding China
-1.75
-4.07
Cambodia
-3.89
-7.40
Lao PDR
-3.57
-7.29
Malaysia
-2.45
-5.28
Thailand
-3.40
-6.81
Vietnam
-1.00
-2.82
Philippines
-2.94
-6.35
Indonesia
-1.38
-3.21
Pr
ep
rin
tn
ot
pe
Canada
Europe
Japan
United States
Middle East & North Africa
Sub-Saharan Africa
Brazil
Rest of Latin America & Caribbean
Russian Federation
Rest of Europe & Central Asia
India
Rest of South Asia
Oceania
Developing countries
High-income countries
World Total
Source: Envisage simulations
- 10 This preprint research paper has not been peer reviewed. Electronic copy available at: />
er
r
ev
iew
ed
Figure 3a. GDP and export implications of amplified global pandemic scenario (% deviation from the
benchmark)
Source: Envisage simulations
rin
tn
ot
pe
Figure 3b. GDP and export implications of amplified global pandemic scenario (% deviation from the
benchmark)
Pr
ep
Source: Envisage simulations
- 11 This preprint research paper has not been peer reviewed. Electronic copy available at: />
iew
ed
3.2 Trade impacts
In our illustrative simulations of the shocks are identical across countries, and the deep recession under
the amplified global pandemic scenario results in negative impacts on exports across all sectors and most
destinations. The country-specific results are driven by the initial composition of output and exports by
sector and destination, but also by the country’s level of openness and relative changes in the
competitiveness of the exporting country and its trading partners.
ev
Under the amplified global pandemic scenario, US exports are expected to decline by almost $85 billion
(2014 dollars) (Figure 4a). The most impacted are exports of services, especially tourism and services
requiring face-to-face interaction. The biggest declines are expected in exports to Europe and EAP, driven
by recession and lower demand in those regions, the main destinations for US exports in services.
er
r
In the case of China, the biggest decline of exports is registered in manufacturing goods, and in Chinese
exports directed to the United States, Europe and EAP countries (Figure 4b). There is a small increase in
exports to ECA and MENA countries, where Chinese products become relatively more competitive than
products of other suppliers, and where domestic producers cannot fully satisfy the domestic demand.
pe
Finally, in the case of Thailand, the biggest impacts are on exports of manufacturing goods and services,
with very little impact on agricultural goods or natural resources (Figure 4c). Services exports to the
United States and Europe register the biggest declines, while manufacturing exports to China and EAP
partners take the biggest hit.
rin
tn
ot
Figure 4a. Impacts on US exports in the amplified global pandemic scenario (difference from the
benchmark)
Note: Europe & Central Asia – Russian Federation, rest of Europe & Central Asia; East Asia and Pacific High Income
- Hong Kong SAR, China; Japan; Republic of Korea; Singapore; South Asia – India, rest of South Asia; Latin America
& Caribbean – Brazil, rest of Latin America & Caribbean;
Pr
ep
Source: Envisage simulations
- 12 This preprint research paper has not been peer reviewed. Electronic copy available at: />
er
r
ev
iew
ed
Figure 4b. Impacts on Chinese exports in the amplified global pandemic scenario (difference from the
benchmark)
Source: Envisage simulations
pe
Note: Europe & Central Asia – Russian Federation, rest of Europe & Central Asia; East Asia and Pacific High Income
- Hong Kong SAR, China; Japan; Republic of Korea; Singapore; South Asia – India, rest of South Asia; Latin America
& Caribbean – Brazil, rest of Latin America & Caribbean;
rin
tn
ot
Figure 4c. Impacts on Thai exports in the amplified global pandemic scenario (difference from the
benchmark)
ep
Note: Europe & Central Asia – Russian Federation, rest of Europe & Central Asia; East Asia and Pacific High Income
- Hong Kong SAR, China; Japan; Republic of Korea; Singapore; South Asia – India, rest of South Asia; Latin America
& Caribbean – Brazil, rest of Latin America & Caribbean;
Pr
Source: Envisage simulations
- 13 This preprint research paper has not been peer reviewed. Electronic copy available at: />
iew
ed
3.3 Sectoral output impacts
er
r
ev
Each transmission channel results in a somewhat different sectoral reallocation of output due to changes
in demand and supply. The first shock affects all sectors in a similar fashion, by limiting the availability of
labor and capital, though labor-intensive sectors are likely to be hit harder. The trade costs impact
tradeable sectors, as well as goods and services that rely heavily on imported inputs. The increase in the
tourism tax results in a decline of tourism, but all other industries that supply inputs needed to generate
tourism services will be impacted by a negative demand shock as well. Finally, social distancing results in
lower demand for selected sectors, but some substitution towards goods and remaining services sectors.
Overall, the sectoral impact of the amplified global pandemic scenario (Table 3) leads to a steeper decline
in services as compared to agriculture and manufacturing. The biggest negative shock is recorded in the
output of domestic services affected by the pandemic, as well as in traded tourist services. At the global
level, output of services affected by the pandemic could decline by 9.3%, tourism services could decline
by 8.8%, with a decline in agricultural and manufacturing output of about 3%.
Pr
ep
rin
tn
ot
pe
Under the amplified global pandemic scenario, Thailand, for example, is expected to record an aggregate
output loss of 5.3%, the largest drop among the developing countries covered by our analysis (Figure 5).
All sectors would see a decline of output, but the biggest percentage drops are recorded in transport
services, recreational activities, and accommodation (between 10% and 20%). However, the sectors that
suffer the most in absolute terms include trade and selected agricultural (crops) and manufacturing goods
(chemicals, electronics, refined oil). These are the real impacts on the volume of output. The declining
commodity prices and changing relative prices would result in a somewhat different ranking of the most
impacted sectors. These are only illustrative impacts that rely on the type and the size of the assumed
shocks. However, they serve as a useful representation of distributional impacts across sectors, with likely
diverse impacts on employment and wages of skilled and unskilled workers, as well as female and male
workers. Further analysis will be conducted to understand the potential distributional impacts of the
pandemic.
- 14 This preprint research paper has not been peer reviewed. Electronic copy available at: />
pe
er
r
ev
iew
ed
Figure 5. Output implications of Amplified Global pandemic scenario for Thailand (difference and %
deviation from the benchmark)
Note: Agriculture – Crops, Livestock; Manufacturing - Meat products (incl. fisheries), Other food, Textiles, Wearing apparel, Leather products,
tn
ot
Wood and paper products, Refined oil, Chemical products (incl. rubber and plastics), Non-metallic minerals, Metals, Computer, electronic and
optical products, Machinery and equipment nec, Motor vehicles and parts, Transport equipment nec, Other manufacturing; Services – Electricity,
Construction, Trade incl. warehousing, Accommodation, food and service activities, Water transport, Air transport, Other transport,
Communications, Recreational and other services, Other services; Natural resources - Natural resource products, Fossil fuel extraction; Domestic
services affected by pandemic - Trade, Accommodation, food and service activities, Water transport, Air transport, Other transport, Recreational
and other services; Traded tourist services - Accommodation, food and service activities, Water transport, Air transport, Other transport,
Recreational and other services.
Pr
ep
rin
Source: Envisage simulations
- 15 This preprint research paper has not been peer reviewed. Electronic copy available at: />
rin
tn
ot
pe
er
r
ev
iew
ed
Table 3. Output implications of amplified global pandemic – cumulative impacts (% deviations from the
benchmark)
Domestic
services
Traded
Natural
affected by
tourist
Agriculture resources Manufacturing Services
pandemic
services
Total
China
-3.12
-1.08
-3.61
-3.67
-4.85
-4.64
-3.54
Developing EAP excluding
China
-2.70
-1.04
-3.21
-5.40
-9.45
-11.28
-4.12
Cambodia
-2.87
-3.98
-2.69
-9.66
-14.96
-19.00
-5.11
Lao PDR
-2.41
-3.89
-2.60
-5.85
-12.18
-15.02
-3.57
Malaysia
-4.19
-0.79
-4.11
-4.34
-7.30
-9.73
-4.03
Thailand
-3.06
-2.91
-4.43
-6.84
-11.53
-14.64
-5.29
Vietnam
-3.06
-0.72
-3.34
-3.93
-8.52
-8.99
-3.37
Philippines
-2.51
-2.65
-3.93
-5.16
-11.10
-13.30
-4.44
Indonesia
-2.70
-0.61
-3.03
-3.67
-7.65
-8.84
-3.15
Hong Kong SAR, China
-1.29
-3.24
-1.33
-6.06
-8.46
-9.23
-5.35
Korea, Rep.
-3.91
-4.25
-3.68
-4.53
-6.87
-6.15
-4.10
Singapore
-2.61
-3.47
-4.32
-4.01
-7.18
-6.28
-4.11
Taiwan, China
-1.04
-7.75
-1.80
-6.84
-7.82
-7.17
-4.15
Canada
-4.30
-1.10
-3.25
-3.02
-8.95
-9.16
-2.96
Europe
-3.00
-1.02
-2.89
-4.02
-9.04
-9.06
-3.65
Japan
-4.71
-2.85
-2.77
-4.62
-8.75
-8.35
-3.98
United States
-3.60
-0.21
-2.45
-3.80
-9.99
-11.27
-3.38
Middle East & North Africa
-2.76
-1.65
-2.67
-3.02
-9.11
-10.03
-2.65
Sub-Saharan Africa
-2.51
-1.72
-2.95
-3.02
-6.35
-8.13
-2.79
Brazil
-3.40
-1.20
-2.86
-3.14
-8.55
-9.28
-2.99
Rest of Latin America &
Caribbean
-2.64
-1.21
-2.94
-4.05
-10.51
-11.87
-3.49
Russian Federation
-3.00
-2.19
-3.73
-3.86
-8.72
-9.62
-3.58
Rest of Europe & Central
Asia
-2.20
-0.59
-3.53
-5.07
-10.20
-11.36
-4.20
India
-3.36
-0.84
-3.98
-4.35
-8.23
-8.76
-4.03
Rest of South Asia
-2.62
-2.64
-3.25
-5.23
-8.04
-9.28
-4.14
Oceania
-3.93
-1.89
-3.10
-3.20
-8.21
-8.07
-3.11
Developing countries
-2.90
-1.42
-3.47
-3.87
-7.98
-8.63
-3.51
High-income countries
-3.49
-0.95
-2.78
-4.00
-9.20
-9.60
-3.59
World Total
-3.04
-1.29
-3.13
-3.95
-8.77
-9.26
-3.56
Note: Agriculture – Crops, Livestock; Manufacturing - Meat products (incl. fisheries), Other food, Textiles, Wearing apparel, Leather products,
Pr
ep
Wood and paper products, Refined oil, Chemical products (incl. rubber and plastics), Non-metallic minerals, Metals, Computer, electronic and
optical products, Machinery and equipment nec, Motor vehicles and parts, Transport equipment nec, Other manufacturing; Services – Electricity,
Construction, Trade incl. warehousing, Accommodation, food and service activities, Water transport, Air transport, Other transport,
Communications, Recreational and other services, Other services; Natural resources - Natural resource products, Fossil fuel extraction; Domestic
services affected by pandemic - Trade, Accommodation, food and service activities, Water transport, Air transport, Other transport, Recreational
and other services; Traded tourist services - Accommodation, food and service activities, Water transport, Air transport, Other transport,
Recreational and other services.
Source: Envisage simulations
- 16 This preprint research paper has not been peer reviewed. Electronic copy available at: />
4. Conclusion
iew
ed
COVID-19 is spreading fast across the globe. At the time of writing, 6 the WHO reported cases of COVID19 in 206 countries with the tragic deaths of more than 40,000 people. The primary focus is necessarily
on containment, treating the ill and helping communities cope with the epidemic. Our illustrative
scenarios indicate that the potential loss of income in affected countries could be significant, with global
GDP declining by up to 3.9%, and developing countries hit the hardest (4% on average, but some over
6.5%). Governments will need to offer significant support to affected businesses and households.
er
r
ev
Our analysis is likely to underestimate the potential economic costs of the epidemic. We do not fully
capture several important channels, such as the uncertainty-driven contraction in demand and FDI, and
other real effects of a financial shock. We capture some aspects of global value chains trade through inputoutput linkages and assumptions that mimic the durability of relationships between firms in value chains
but plan to extend the analysis using a richer data set. We have examined, but not yet finalized, the effects
of raising domestic trade costs as well as demand switching away from activities requiring direct contact
with other people. Our analysis will evolve as we bring assumptions and scenarios in line with more recent
health and economic indicators.
Pr
ep
rin
tn
ot
pe
Early indications of the economic costs and the magnitude of estimated impacts demonstrate the need
for a coordinated international response to the crisis. A global crisis requires a global response and there
is a need for global collaboration not just on health, but also on trade, finance and macroeconomic
policies. Fortunately, global institutions are beginning to catalyze and coordinate global efforts, as well as
to provide technical and financial support to countries coping with the health and economic consequences
of the outbreak.
6
March 31, 2020.
- 17 This preprint research paper has not been peer reviewed. Electronic copy available at: />
Regional concordance
iew
ed
Annex 1 Regional and sectoral aggregations
GTAP concordance
1
Oceania (ANZ)
Australia (AUS), New Zealand (NZL)
2
Rest of Oceania (XOC)
Rest of Oceania (XOC)
3
China (CHN)
China (CHN)
4
Hong Kong SAR, China (HKG)
Hong Kong (HKG)
5
Japan (JPN)
Japan (JPN)
6
Korea, Rep. (KOR)
Korea (KOR)
7
Taiwan, China (TWN)
Taiwan (TWN)
8
Cambodia (KHM)
Cambodia (KHM)
9
Indonesia (IDN)
Indonesia (IDN)
10
Lao PDR (LAO)
Laos (LAO)
11
Malaysia (MYS)
Malaysia (MYS)
12
Philippines (PHL)
Philippines (PHL)
13
Singapore (SGP)
Singapore (SGP)
14
Thailand (THA)
Thailand (THA)
15
Vietnam (VNM)
Viet Nam (VNM)
16
Rest of East Asia (XEA)
17
India (IND)
Mongolia (MNG), Rest of East Asia (XEA), Brunei Darussalam
(BRN), Rest of Southeast Asia (XSE)
India (IND)
18
Rest of South Asia (XSA)
19
Canada (CAN)
20
United States (USA)
21
Brazil (BRA)
22
Rest of Latin America & Caribbean
(XLC)
23
Europe (EUR)
er
r
pe
Bangladesh (BGD), Nepal (NPL), Pakistan (PAK), Sri Lanka (LKA),
Rest of South Asia (XSA)
Canada (CAN)
United States of America (USA)
ep
rin
tn
ot
Brazil (BRA)
24
Russian Federation (RUS)
25
Rest of Europe & Central Asia
(XEC)
Pr
ev
Region/Country
Mexico (MEX), Rest of North America (XNA), Argentina (ARG),
Bolivia (BOL), Chile (CHL), Colombia (COL), Ecuador (ECU),
Paraguay (PRY), Peru (PER), Uruguay (URY), Venezuela (VEN), Rest
of South America (XSM), Costa Rica (CRI), Guatemala (GTM),
Honduras (HND), Nicaragua (NIC), Panama (PAN), El Salvador
(SLV), Rest of Central America (XCA), Dominican Republic (DOM),
Jamaica (JAM), Puerto Rico (PRI), Trinidad and Tobago (TTO), Rest
of Caribbean (XCB)
Austria (AUT), Belgium (BEL), Cyprus (CYP), Czech Republic (CZE),
Denmark (DNK), Estonia (EST), Finland (FIN), France (FRA),
Germany (DEU), Greece (GRC), Hungary (HUN), Ireland (IRL), Italy
(ITA), Latvia (LVA), Lithuania (LTU), Luxembourg (LUX), Malta
(MLT), Netherlands (NLD), Poland (POL), Portugal (PRT), Slovakia
(SVK), Slovenia (SVN), Spain (ESP), Sweden (SWE), United
Kingdom (GBR), Switzerland (CHE), Norway (NOR), Rest of EFTA
(XEF), Rest of Europe (XER), Rest of the World (XTW)
Russian Federation (RUS)
Albania (ALB), Bulgaria (BGR), Belarus (BLR), Croatia (HRV),
Romania (ROU), Ukraine (UKR), Rest of Eastern Europe (XEE),
Kazakhstan (KAZ), Kyrgyzstan (KGZ), Tajikistan (TJK), Rest of
Former Soviet Union (XSU), Armenia (ARM), Azerbaijan (AZE),
Georgia (GEO), Turkey (TUR)
- 18 This preprint research paper has not been peer reviewed. Electronic copy available at: />
Middle East & North Africa (MNA)
27
Sub-Saharan Africa (SSA)
Bahrain (BHR), Iran (IRN), Israel (ISR), Jordan (JOR), Kuwait (KWT),
Oman (OMN), Qatar (QAT), Saudi Arabia (SAU), United Arab
Emirates (ARE), Rest of Western Asia (XWS), Egypt (EGY),
Morocco (MAR), Tunisia (TUN), Rest of North Africa (XNF)
Benin (BEN), Burkina Faso (BFA), Cameroon (CMR), Côte d'Ivoire
(CIV), Ghana (GHA), Guinea (GIN), Nigeria (NGA), Senegal (SEN),
Togo (TGO), Rest of Western Africa (XWF), Central Africa (XCF),
Rest of South-Central Africa (XAC), Ethiopia (ETH), Kenya (KEN),
Madagascar (MDG), Malawi (MWI), Mauritius (MUS),
Mozambique (MOZ), Rwanda (RWA), Tanzania (TZA), Uganda
(UGA), Zambia (ZMB), Zimbabwe (ZWE), Rest of Eastern Africa
(XEC), Botswana (BWA), Namibia (NAM), South Africa (ZAF), Rest
of South African Customs Union (XSC)
iew
ed
26
ev
Sector concordance
Livestock (lvs)
3
Natural resource products (NRS)
4
Fossil fuel extraction (FFL)
5
6
Meat products (inc. fisheries)
(PMT)
Other food (OFD)
7
Textiles (TEX)
8
Wearing apparel (WAP)
9
Leather products (LEA)
er
r
2
Paddy rice (PDR), Wheat (WHT), Cereal grains nec (GRO),
Vegetables, fruit, nuts (V_F), Oil seeds (OSD), Sugar cane, sugar
beet (C_B), Plant-based fibers (PFB), Crops nec (OCR), Processed
rice (PCR), Sugar (SGR)
Bovine cattle, sheep and goats, horses (CTL), Animal products nec
(OAP), Raw milk (RMK), Wool, silk-worm cocoons (WOL)
Forestry (FRS), Other Extraction (formerly omn Minerals nec)
(OXT)
Coal (COA), Oil (OIL), Gas (GAS), Gas manufacture, distribution
(GDT)
Fishing (FSH), Bovine meat products (CMT), Meat products nec
(OMT), Dairy products (MIL)
pe
Crops (crp)
Vegetable oils and fats (VOL), Food products nec (OFD),
Beverages and tobacco products (B_T)
Textiles (TEX)
Wearing apparel (WAP)
ot
1
Leather products (LEA)
Wood and paper products (WDP)
Wood products (LUM), Paper products, publishing (PPP)
11
Refined oil (P_C)
Petroleum, coal products (P_C)
12
Chemical products (CHM), Basic pharmaceutical products (BPH),
Rubber and plastic products (RPP)
13
Chemical products (incl. rubber
and plastics) (CHM)
Non-metallic minerals (NMM)
14
Metals (MET)
Ferrous metals (I_S), Metals nec (NFM)
15
Computer, electronic and optical products (ELE)
17
Computer, electronic and optical
products (ELE)
Machinery and equipment nec
(OME)
Motor vehicles and parts (MVH)
18
Transport equipment nec (OTN)
Transport equipment nec (OTN)
19
Other manufacturing (XMN)
Metal products (FMP), Manufactures nec (OMF)
20
Electricity (ELY)
Electricity (ELY)
21
Construction (CNS)
Construction (CNS)
22
Trade incl. warehousing (TRD)
Trade (TRD), warehousing and support activities (WHS)
rin
Pr
ep
16
tn
10
Mineral products nec (NMM)
Electrical equipment (EEQ), Machinery and equipment nec (OME)
Motor vehicles and parts (MVH)
- 19 This preprint research paper has not been peer reviewed. Electronic copy available at: />
Accommodation, food and service activities (AFS)
24
Accommodation, food and service
activities (AFS)
Water transport (WTP)
25
Air transport (ATP)
Air transport (ATP)
26
Other transport (XTP)
Transport nec (OTP)
27
Communications (CMN)
Communication (CMN)
28
Recreational and other services
(ROS)
Other services (XSV)
Recreational and other services (ROS)
Water (WTR), Financial services nec (OFI), Insurance (formerly isr)
(INS), Real estate activities (RSA), Business services nec (OBS),
Public Administration and defense (OSG), Education (EDU),
Human health and social work activities (HHT), Dwellings (DWE)
Pr
ep
rin
tn
ot
pe
er
r
ev
29
Water transport (WTP)
iew
ed
23
- 20 This preprint research paper has not been peer reviewed. Electronic copy available at: />
Annex 2 Literature review on the impacts of Covid-19
Assumptions
Scenarios
Results
“Coronavirus:
The world
economy at
risk” (OECD
2020)
NiGEM
macro
model
Monetary
policy is
allowed to be
endogenous.;
The automatic
fiscal
stabilisers are
allowed to
operate fully in
all
countries,
implying that
governments
do not react to
the shock by
attempting to
maintain a
previously
announced
budget path.
Contained
Outbreak
(short lived
but severe
downturn in
China)
er
r
ot
tn
Assumption
that the supply
side of the
economy –
-Domestic demand in
China and Hong Kong,
China is reduced by 4% in
the first quarter of 2020,
and 2% in the second
quarter of 2020.
-Global equity prices and
non-food commodity
prices are lowered by 10%
in the first half of 2020.
- Higher uncertainty is
modelled via a small rise
of 10 basis points in
investment risk premia in
all
countries in the first half
of 2020. This raises the
cost of capital and
reduces investment.
-Domestic demand in
most other Asia-Pacific
economies, including
Japan and Korea, and
private
consumption in the
advanced northern
hemisphere economies is
reduced by 2% (relative to
baseline) in the second
and third quarters of
2020.
- Global equity prices and
non-food commodity
prices are lowered by 20%
in the first nine months of
2020.
- Heighted uncertainty is
modelled via an increase
of 50 basis points in
investment risk premia in
all countries in 2020.
Top Asia-Pacific: Risk
Coronavirus restrictions
set back China’s growth
(risk level: High);
pe
A “domino”
scenario:
broader
contagion
rin
ep
Pr
“Coronavirus
Casts Shadow
iew
ed
Model
China GDP loss = -0.2
percentage point in 2020H1;
Reduction of China import
demand = -6%;
World GDP is reduced by to
0.5 percentage point in 2020;
Global trade declines 0.9% in
2020 (and 1.4% in first half of
2020)
ev
Title & Authors
Only one
scenario
World GDP is reduced by up to
1 ½ per cent; World trade is
declining by around 3 ¾ per
cent in 2020
China GDP growth loss of 0.7
percentage point in 2020. Full
recover in 2021; Global GDP
- 21 This preprint research paper has not been peer reviewed. Electronic copy available at: />
tn
rin
China Shock, Low
Severity,
Temporary. Attack rate
for China = 1%; Case
fatality rate China = 2%
China Shock, Middle
severity, Temporary.
Attack rate for China =
10%; Case fatality rate
China = 2.5%
GDP loss (2020):
China = -0.4%;
USA = -0.1%;
Japan = -0.3%;
Korea = -0.1%
GDP loss (2020):
China = -1.9%;
USA = -0.1%;
Japan = -0.4%;
Korea = -0.2%
iew
ed
Scenario 3
China Shock, High
severity, Temporary;
Attack rate for China =
30%; Case fatality rate
China = 3%
Global Shock, Low
severity, Temporary;
Attack rate for China =
10%; Case fatality rate
China = 2%
Global Shock, Middle
severity, Temporary;
Attack rate for China =
20%; Case fatality rate
China = 2.5%
Global Shock, High
severity, Temporary;
Attack rate for China =
30%; Case fatality rate
China = 3%
Global Shock, Low
severity, Permanent;
Attack rate for China =
10%; Case fatality rate
China = 2%
Scenario 4
Scenario 5
Scenario 6
Scenario 7
Pr
ep
growth loss of 0.3 percentage;
The U.S. and Europe may
experience minimal reductions
in growth, while the impact is
largest in East Asia.
ev
Scenario 1
Scenario 2
Top Global Risk:
Coronavirus restrictions
less systemic globally,
with sector variations (risk
level: elevated)
er
r
G-Cubed
MultiCountry
Model –
Global
hybrid
DSGE/CGE
ot
“The Global
Macroeconomic
Impacts of
COVID-19”
(McKibbin and
Fernando 2020)
labor force,
productive
capital, and
productivity –
is unchanged,
meaning that
output after
the
coronavirus
shock returns
to its original
path.
-6 sectors and
24 countries;
Long-run stock
equilibrium
obtains
through the
adjustment of
asset prices;
Nominal wages
are sticky and
adjust over
time based on
countryspecific labor
contracting
assumptions.;
Short run
rigidities;
Heterogeneous
households
and firms
pe
Over Credit
Outlook” (S&P
2020)
GDP loss (2020):
China = -6%;
USA = -0.2%;
Japan = -0.5%;
Korea = -0.3%
GDP loss (2020):
China = -1.6%;
USA = -2%;
Japan = -2.5%;
Korea= -1.4%
GDP loss (2020):
China = -3.6%;
USA = -4.8%;
Japan = -5.7%;
Korea = -3.3%
GDP loss (2020):
China = -6.2%;
USA = -8.4%;
Japan = -9.9%
Korea = -5.8%
GDP loss (2020):
China = -2.2%;
USA = -1.5%;
Japan = -2%;
Korea = -1.3%
- 22 This preprint research paper has not been peer reviewed. Electronic copy available at: />
Major blow to China, and
spillover to rest of world;
shock to China’s GDP in
1Q - China’s GDP growth
to slow 4.7 ppt below our
baseline forecast
GDP loss (2020):
World (1st Quarter) = -1.2%
China = -0.7%
Japan = -0.1%
Indonesia = -0.3
Canada = -0.1%
Germany = -0.1%
Scenario 2
Outbreaks cause localized
disruption, countries with
reported >100 cases in
early March suffer half of
the shock to China
GDP loss (2020):
World = -0.8%
China = -1.5%
Japan = 01%
US = -0.2%
France = -1.3%
Germany = -1.2%
Russia = -0.9%
GDP loss (2020):
World = -1.9%
China = -2%
Japan = -2.2%
Indonesia = -2.8
USA = -1.3%
Germany = -2.8%
Brazil = -1.7%
iew
ed
Scenario 1
ev
Model allows:
-monetary
policy to
respond to
weaker
growth;
- a degree of
import
substitution
Model does
not allow:
-supply chain
impacts to
propagate
beyond the
countries in
which they are
first felt
Scenario 3
er
r
NiGEM —a
large scale
model of
the global
economy;
Static
assessment
Widespread contagion,
countries with current
reported cases >100
suffer the same shock as
China, and countries with
any reported cases suffer
half of the shock suffered
by China
pe
“Coronavirus
could cost the
global economy
$2.7 trillion.”
(Orlik et al.
2020)
Global pandemic, all
countries suffer a severe
shock
GDP loss (2020):
World = -3.1%
Pr
ep
rin
tn
ot
Scenario 4
- 23 This preprint research paper has not been peer reviewed. Electronic copy available at: />