Tài liệu GROUND WATER POLLUTION POTENTIAL OF MAHONING COUNTY, OHIO doc
Bạn đang xem bản rút gọn của tài liệu. Xem và tải ngay bản đầy đủ của tài liệu tại đây (1.47 MB, 68 trang )
GROUND WATER POLLUTION POTENTIAL
OF MAHONING COUNTY, OHIO
BY
MICHAEL P. ANGLE
GROUND WATER POLLUTION POTENTIAL REPORT NO. 51
OHIO DEPARTMENT OF NATURAL RESOURCES
DIVISION OF WATER
WATER RESOURCES SECTION
2003
ii
ABSTRACT
A ground water pollution potential map of Mahoning County has been prepared using
the DRASTIC mapping process. The DRASTIC system consists of two major elements: the
designation of mappable units, termed hydrogeologic settings, and the superposition of a
relative rating system for pollution potential.
Hydrogeologic settings form the basis of the system and incorporate the major
hydrogeologic factors that affect and control ground water movement and occurrence
including depth to water, net recharge, aquifer media, soil media, topography, impact of the
vadose zone media, and hydraulic conductivity of the aquifer. These factors, which form the
acronym DRASTIC, are incorporated into a relative ranking scheme that uses a combination
of weights and ratings to produce a numerical value called the ground water pollution
potential index. Hydrogeologic settings are combined with the pollution potential indexes to
create units that can be graphically displayed on a map.
Ground water pollution potential analysis in Mahoning County resulted in a map with
symbols and colors that illustrate areas of varying ground water contamination vulnerability.
Eight hydrogeologic settings were identified in Mahoning County with computed ground
water pollution potential indexes ranging from 76 to 168.
Mahoning County lies within the Glaciated Central hydrogeologic setting. Varying
thicknesses of glacial till overlies Mahoning County. The county is crossed by numerous,
primarily north-south trending, buried valleys. The buried valleys are variable. Some
contain appreciable thicknesses of outwash sand and gravel, others are predominantly filled
with fine-grained glacial till. Outside of the buried valleys, aquifers within glacial deposits
are limited to thin lenses interbedded in glacial till. Yields from the unconsolidated aquifers
typically average 10 to 25 gallons per minute (gpm) with yields over 100 gpm possible in
select areas. Interbedded sandstones, shales, siltstones, limestones, and coals of the
Pennsylvanian System or shales and sandstones of the Mississippian System comprise the
aquifer in the majority of the county. Consolidated units are moderate to poor aquifers with
typical yields ranging from 3 to 25 gpm. Yields up to 100 gpm are possible from some of the
sandstone intervals in the Pennsylvanian Pottsville Group.
The ground water pollution potential mapping program optimizes the use of existing
data to rank areas with respect to relative vulnerability to contamination. The ground water
pollution potential map of Mahoning County has been prepared to assist planners, managers,
and local officials in evaluating the potential for contamination from various sources of
pollution. This information can be used to help direct resources and land use activities to
appropriate areas, or to assist in protection, monitoring, and clean-up efforts.
iii
TABLE OF CONTENTS
Page
Abstract ii
Table of Contents iii
List of Figures iv
List of Tables v
Acknowledgements vi
Introduction 1
Applications of Pollution Potential Maps 2
Summary of the DRASTIC Mapping Process 3
Hydrogeologic Settings and Factors 3
Weighting and Rating System 6
Pesticide DRASTIC 7
Integration of Hydrogeologic Settings and DRASTIC Factors 10
Interpretation and Use of Ground Water Pollution Potential Maps 12
General Information About Mahoning County 13
Demographics 13
Climate 13
Physiography and Topography 13
Modern Drainage 15
Pre- and Inter-Glacial Drainage and Topography 17
Glacial Geology 21
Bedrock Geology 24
Ground Water Resources 28
Strip and Underground Mined Areas 29
Unmapped Areas 30
References 32
Unpublished Data 36
Appendix A, Description of the Logic in Factor Selection 37
Appendix B, Description of Hydrogeologic Settings and Charts 44
iv
LIST OF FIGURES
Number Page
1. Format and description of the hydrogeologic setting - 7D Buried Valley 5
2. Description of the hydrogeologic setting - 7D1 Buried Valley 11
3. Location of Mahoning County, Ohio 14
4. Map showing present drainage pattern in Mahoning County 16
5. Pre-glacial (Teays Stage) drainage in Northeast Ohio 18
6. Approximate outlines of pre-glacial and inter-glacial buried valleys in
Mahoning County, Ohio 20
v
LIST OF TABLES
Number Page
1. Assigned weights for DRASTIC features 7
2. Ranges and ratings for depth to water 7
3. Ranges and ratings for net recharge 8
4. Ranges and ratings for aquifer media 8
5. Ranges and ratings for soil media 8
6. Ranges and ratings for topography 9
7. Ranges and ratings for impact of the vadose zone media 9
8. Ranges and ratings for hydraulic conductivity 10
9. Generalized Pleistocene stratigraphy of Mahoning County, Ohio 22
10. Bedrock stratigraphy of Mahoning County, Ohio 25
11. Potential factors influencing DRASTIC ratings for strip mined areas 31
12. Potential factors influencing DRASTIC ratings for underground mined areas 31
13. Mahoning County soils 41
14. Hydrogeologic settings mapped in Mahoning County, Ohio 44
15. Hydrogeologic Settings, DRASTIC Factors, and Ratings 53
vi
ACKNOWLEDGEMENTS
The preparation of the Mahoning County Ground Water Pollution Potential report and
map involved the contribution and work of a number of individuals in the Division of Water.
Grateful acknowledgement is given to the following individuals for their technical review
and map production, text authorship, report editing, and preparation:
Map preparation and review: Michael P. Angle
GIS coverage production and review: Paul Spahr
Report production and review: Michael P. Angle
Report editing: Jim Raab
Kathy Sprowls
1
INTRODUCTION
The need for protection and management of ground water resources in Ohio has been
clearly recognized. Approximately 42 percent of Ohio citizens rely on ground water for
drinking and household use from both municipal and private wells. Industry and agriculture
also utilize significant quantities of ground water for processing and irrigation. In Ohio,
approximately 750,000 rural households depend on private wells; 12,000 of these wells exist
in Mahoning County.
The characteristics of the many aquifer systems in the state make ground water highly
vulnerable to contamination. Measures to protect ground water from contamination usually
cost less and create less impact on ground water users than clean up of a polluted aquifer.
Based on these concerns for protection of the resource, staff of the Division of Water
conducted a review of various mapping strategies useful for identifying vulnerable aquifer
areas. They placed particular emphasis on reviewing mapping systems that would assist in
state and local protection and management programs. Based on these factors and the quantity
and quality of available data on ground water resources, the DRASTIC mapping process
(Aller et al., 1987) was selected for application in the program.
Considerable interest in the mapping program followed successful production of a
demonstration county map and led to the inclusion of the program as a recommended
initiative in the Ohio Ground Water Protection and Management Strategy (Ohio EPA, 1986).
Based on this recommendation, the Ohio General Assembly funded the mapping program. A
dedicated mapping unit has been established in the Division of Water, Water Resources
Section to implement the ground water pollution potential mapping program on a countywide
basis in Ohio.
The purpose of this report and map is to aid in the protection of our ground water
resources. This protection can be enhanced by understanding and implementing the results of
this study, which utilizes the DRASTIC system of evaluating an area’s potential for ground
water pollution. The mapping program identifies areas that are vulnerable to contamination
and displays this information graphically on maps. The system was not designed or intended
to replace site-specific investigations, but rather to be used as a planning and management
tool. The map and report can be combined with other information to assist in prioritizing
local resources and in making land use decisions.
2
APPLICATIONS OF POLLUTION POTENTIAL MAPS
The pollution potential mapping program offers a wide variety of applications in many
counties. The ground water pollution potential map of Mahoning County has been prepared to assist
planners, managers, and state and local officials in evaluating the relative vulnerability of areas to
ground water contamination from various sources of pollution. This information can be used to help
direct resources and land use activities to appropriate areas, or to assist in protection, monitoring, and
clean-up efforts.
An important application of the pollution potential maps for many areas will be assisting in
county land use planning and resource expenditures related to solid waste disposal. A county may
use the map to help identify areas that are suitable for disposal activities. Once these areas have been
identified, a county can collect more site-specific information and combine this with other local
factors to determine site suitability.
Pollution potential maps may be applied successfully where non-point source contamination
is a concern. Non-point source contamination occurs where land use activities over large areas
impact water quality. Maps providing information on relative vulnerability can be used to guide the
selection and implementation of appropriate best management practices in different areas. Best
management practices should be chosen based upon consideration of the chemical and physical
processes that occur from the practice, and the effect these processes may have in areas of moderate
to high vulnerability to contamination. For example, the use of agricultural best management
practices that limit the infiltration of nitrates, or promote denitrification above the water table, would
be beneficial to implement in areas of relatively high vulnerability to contamination.
A pollution potential map can assist in developing ground water protection strategies. By
identifying areas more vulnerable to contamination, officials can direct resources to areas where
special attention or protection efforts might be warranted. This information can be utilized
effectively at the local level for integration into land use decisions and as an educational tool to
promote public awareness of ground water resources. Pollution potential maps may be used to
prioritize ground water monitoring and/or contamination clean-up efforts. Areas that are identified
as being vulnerable to contamination may benefit from increased ground water monitoring for
pollutants or from additional efforts to clean up an aquifer.
Individuals in the county who are familiar with specific land use and management problems
will recognize other beneficial uses of the pollution potential maps. Planning commissions and
zoning boards can use these maps to help make informed decisions about the development of areas
within their jurisdiction. Developers proposing projects within ground water sensitive areas may be
required to show how ground water will be protected.
Regardless of the application, emphasis must be placed on the fact that the system is not
designed to replace a site-specific investigation. The strength of the system lies in its ability to make
a "first-cut approximation" by identifying areas that are vulnerable to contamination. Any potential
applications of the system should also recognize the assumptions inherent in the system.
3
SUMMARY OF THE DRASTIC MAPPING PROCESS
DRASTIC was developed by the National Ground Water Association for the United
States Environmental Protection Agency. This system was chosen for implementation of a
ground water pollution potential mapping program in Ohio. A detailed discussion of this
system can be found in Aller et al. (1987).
The DRASTIC mapping system allows the pollution potential of any area to be
evaluated systematically using existing information. Vulnerability to contamination is a
combination of hydrogeologic factors, anthropogenic influences, and sources of
contamination in any given area. The DRASTIC system focuses only on those hydrogeologic
factors that influence ground water pollution potential. The system consists of two major
elements: the designation of mappable units, termed hydrogeologic settings, and the
superposition of a relative rating system to determine pollution potential.
The application of DRASTIC to an area requires the recognition of a set of
assumptions made in the development of the system. DRASTIC evaluates the pollution
potential of an area under the assumption that a contaminant with the mobility of water is
introduced at the surface and flushed into the ground water by precipitation. Most important,
DRASTIC cannot be applied to areas smaller than 100 acres in size and is not intended or
designed to replace site-specific investigations.
Hydrogeologic Settings and Factors
To facilitate the designation of mappable units, the DRASTIC system used the
framework of an existing classification system developed by Heath (1984), which divides the
United States into 15 ground water regions based on the factors in a ground water system that
affect occurrence and availability.
Within each major hydrogeologic region, smaller units representing specific
hydrogeologic settings are identified. Hydrogeologic settings form the basis of the system
and represent a composite description of the major geologic and hydrogeologic factors that
control ground water movement into, through, and out of an area. A hydrogeologic setting
represents a mappable unit with common hydrogeologic characteristics and, as a
consequence, common vulnerability to contamination (Aller et al., 1987).
4
Figure 1 illustrates the format and description of a typical hydrogeologic setting found
within Mahoning County. Inherent within each hydrogeologic setting are the physical
characteristics that affect the ground water pollution potential. These characteristics or
factors identified during the development of the DRASTIC system include:
D - Depth to Water
R - Net Recharge
A - Aquifer Media
S - Soil Media
T - Topography
I - Impact of the Vadose Zone Media
C - Conductivity (Hydraulic) of the Aquifer
These factors incorporate concepts and mechanisms such as attenuation, retardation,
and time or distance of travel of a contaminant with respect to the physical characteristics of
the hydrogeologic setting. Broad consideration of these factors and mechanisms coupled
with existing conditions in a setting provide a basis for determination of the area’s relative
vulnerability to contamination.
Depth to water
is considered to be the depth from the ground surface to the water
table in unconfined aquifer conditions or the depth to the top of the aquifer under confined
aquifer conditions. The depth to water determines the distance a contaminant would have to
travel before reaching the aquifer. The greater the distance the contaminant has to travel, the
greater the opportunity for attenuation to occur or restriction of movement by relatively
impermeable layers.
Net recharge
is the total amount of water reaching the land surface that infiltrates the
aquifer measured in inches per year. Recharge water is available to transport a contaminant
from the surface into the aquifer and affects the quantity of water available for dilution and
dispersion of a contaminant. Factors to be included in the determination of net recharge
include contributions due to infiltration of precipitation, in addition to infiltration from rivers,
streams and lakes, irrigation, and artificial recharge.
Aquifer media
represents consolidated or unconsolidated rock material capable of
yielding sufficient quantities of water for use. Aquifer media accounts for the various
physical characteristics of the rock that provide mechanisms of attenuation, retardation, and
flow pathways that affect a contaminant reaching and moving through an aquifer.
5
7D Buried Valley
This setting is characterized by thick deposits of sand and gravel that have been
deposited in a former topographic low (usually a pre-glacial river valley) by glacial
meltwater. Many of the buried valleys in Mahoning County underlie the broad, flat lying
floodplains of modern rivers. The boundary between the buried valley and the adjacent
bedrock upland is usually prominent. The buried valleys contain substantial thicknesses of
permeable sand and gravel that serve as the aquifer. The aquifer is typically in hydraulic
connection with the modern rivers. The vadose zone is typically composed of sand and
gravel but significant amounts of silt and clay can be found in discrete areas. Silt loams,
loams, and sandy loams are the typical soil types for this setting. Depth to water is typically
less than 30 feet for areas adjacent to modern rivers, and between 30 to 50 feet for terraces
that border the bedrock uplands. Recharge is generally high due to permeable soils and
vadose zone materials, shallow depth to water, and the presence of surface streams.
Figure 1. Format and description of the hydrogeologic setting - 7D Buried Valley.
6
Soil media refers to the upper six feet of the unsaturated zone that is characterized by
significant biological activity. The type of soil media influences the amount of recharge that
can move through the soil column due to variations in soil permeability. Various soil types
also have the ability to attenuate or retard a contaminant as it moves throughout the soil
profile. Soil media is based on textural classifications of soils and considers relative
thicknesses and attenuation characteristics of each profile within the soil.
Topography refers to the slope of the land expressed as percent slope. The slope of
an area affects the likelihood that a contaminant will run off or be ponded and ultimately
infiltrate into the subsurface. Topography also affects soil development and often can be
used to help determine the direction and gradient of ground water flow under water table
conditions.
The impact of the vadose zone media
refers to the attenuation and retardation
processes that can occur as a contaminant moves through the unsaturated zone above the
aquifer. The vadose zone represents that area below the soil horizon and above the aquifer
that is unsaturated or discontinuously saturated. Various attenuation, travel time, and
distance mechanisms related to the types of geologic materials present can affect the
movement of contaminants in the vadose zone. Where an aquifer is unconfined, the vadose
zone media represents the materials below the soil horizon and above the water table. Under
confined aquifer conditions, the vadose zone is simply referred to as a confining layer. The
presence of the confining layer in the unsaturated zone has a significant impact on the
pollution potential of the ground water in an area.
Hydraulic conductivity of an aquifer is a measure of the ability of the aquifer to
transmit water, and is also related to ground water velocity and gradient. Hydraulic
conductivity is dependent upon the amount and interconnectivity of void spaces and fractures
within a consolidated or unconsolidated rock unit. Higher hydraulic conductivity typically
corresponds to higher vulnerability to contamination. Hydraulic conductivity considers the
capability for a contaminant that reaches an aquifer to be transported throughout that aquifer
over time.
Weighting and Rating System
DRASTIC uses a numerical weighting and rating system that is combined with the
DRASTIC factors to calculate a ground water pollution potential index or relative measure of
vulnerability to contamination. The DRASTIC factors are weighted from 1 to 5 according to
their relative importance to each other with regard to contamination potential (Table 1). Each
factor is then divided into ranges or media types and assigned a rating from 1 to 10 based on
their significance to pollution potential (Tables 2-8). The rating for each factor is selected
based on available information and professional judgment. The selected rating for each
factor is multiplied by the assigned weight for each factor. These numbers are summed to
calculate the DRASTIC or pollution potential index.
7
Once a DRASTIC index has been calculated, it is possible to identify areas that are
more likely to be susceptible to ground water contamination relative to other areas. The
higher the DRASTIC index, the greater the vulnerability to contamination. The index
generated provides only a relative evaluation tool and is not designed to produce absolute
answers or to represent units of vulnerability. Pollution potential indexes of various settings
should be compared to each other only with consideration of the factors that were evaluated
in determining the vulnerability of the area.
Pesticide DRASTIC
A special version of DRASTIC was developed for use where the application of
pesticides is a concern. The weights assigned to the DRASTIC factors were changed to
reflect the processes that affect pesticide movement into the subsurface with particular
emphasis on soils. Where other agricultural practices, such as the application of fertilizers,
are a concern, general DRASTIC should be used to evaluate relative vulnerability to
contamination. The process for calculating the Pesticide DRASTIC index is identical to the
process used for calculating the general DRASTIC index. However, general DRASTIC and
Pesticide DRASTIC numbers should not be compared because the conceptual basis in factor
weighting and evaluation differs significantly. Table 1 lists the weights used for general and
pesticide DRASTIC.
Table 1. Assigned weights for DRASTIC features
Feature
General
DRASTIC
Weight
Pesticide
DRASTIC
Weight
Depth to Water 5 5
Net Recharge 4 4
Aquifer Media 3 3
Soil Media 2 5
Topography 1 3
Impact of the Vadose Zone Media 5 4
Hydraulic Conductivity of the
Aquifer
3 2
Table 2. Ranges and ratings for depth to water
Depth to Water
(feet)
Range Rating
0-5 10
5-15 9
15-30 7
30-50 5
50-75 3
75-100 2
100+ 1
Weight: 5 Pesticide Weight: 5
8
Table 3. Ranges and ratings for net recharge
Net Recharge
(inches)
Range Rating
0-2 1
2-4 3
4-7 6
7-10 8
10+ 9
Weight: 4 Pesticide Weight: 4
Table 4. Ranges and ratings for aquifer media
Aquifer Media
Range Rating Typical Rating
Shale 1-3 2
Glacial Till 4-6 5
Sandstone 4-9 6
Limestone 4-9 6
Sand and Gravel 4-9 8
Interbedded Ss/Sh/Ls/Coal 2-10 9
Karst Limestone 9-10 10
Weight: 3 Pesticide Weight: 3
Table 5. Ranges and ratings for soil media
Soil Media
Range Rating
Thin or Absent 10
Gravel 10
Sand 9
Peat 8
Shrink/Swell Clay 7
Sandy Loam 6
Loam 5
Silty Loam 4
Clay Loam 3
Muck 2
Clay 1
Weight: 2 Pesticide Weight: 5
9
Table 6. Ranges and ratings for topography
Topography
(percent slope)
Range Rating
0-2 10
2-6 9
6-12 5
12-18 3
18+ 1
Weight: 1 Pesticide Weight: 3
Table 7. Ranges and ratings for impact of the vadose zone media
Impact of the Vadose Zone Media
Range Rating Typical Rating
Confining Layer 1 1
Silt/Clay 2-6 3
Shale 2-5 3
Limestone 2-7 6
Sandstone 4-8 6
Interbedded Ss/Sh/Ls/Coal 4-8 6
Sand and Gravel with Silt and Clay 4-8 6
Glacial Till 2-6 4
Sand and Gravel 6-9 8
Karst Limestone 8-10 10
Weight: 5 Pesticide Weight: 4
10
Table 8. Ranges and ratings for hydraulic conductivity
Hydraulic Conductivity
(GPD/FT
2
)
Range Rating
1-100 1
100-300 2
300-700 4
700-1000 6
1000-2000 8
2000+ 10
Weight: 3 Pesticide Weight: 2
Integration of Hydrogeologic Settings and DRASTIC Factors
Figure 2 illustrates the hydrogeologic setting 7D1, Buried Valley, identified in
mapping Mahoning County, and the pollution potential index calculated for the setting.
Based on selected ratings for this setting, the pollution potential index is calculated to be 149.
This numerical value has no intrinsic meaning, but can be readily compared to a value
obtained for other settings in the county. DRASTIC indexes for typical hydrogeologic
settings and values across the United States range from 45 to 223. The diversity of
hydrogeologic conditions in Mahoning County produces settings with a wide range of
vulnerability to ground water contamination. Calculated pollution potential indexes for the
eight settings identified in the county range from 76 to 168.
Hydrogeologic settings identified in an area are combined with the pollution potential
indexes to create units that can be graphically displayed on maps. Pollution potential
analysis in Mahoning County resulted in a map with symbols and colors that illustrate areas
of ground water vulnerability. The map describing the ground water pollution potential of
Mahoning County is included with this report.
11
SETTING 7D1 GENERAL
FEATURE RANGE WEIGHT RATING NUMBER
Depth to Water 15-30 5 7 35
Net Recharge 7-10 4 8 32
Aquifer Media Sand & Gravel 3 7 21
Soil Media Silt Loam 2 4 8
Topography 0-2% 1 10 10
Impact of Vadose Zone Silt/Clay 5 5 25
Hydraulic Conductivity 700-1000 3 6 18
DRASTIC INDEX 149
Figure 2. Description of the hydrogeologic setting - 7D1 Buried Valley.
12
INTERPRETATION AND USE OF GROUND WATER POLLUTION POTENTIAL
MAPS
The application of the DRASTIC system to evaluate an area’s vulnerability to
contamination produces hydrogeologic settings with corresponding pollution potential
indexes. The higher the pollution potential index, the greater the susceptibility to
contamination. This numeric value determined for one area can be compared to the pollution
potential index calculated for another area.
The map accompanying this report displays both the hydrogeologic settings identified
in the county and the associated pollution potential indexes calculated in those hydrogeologic
settings. The symbols on the map represent the following information:
7D1 - defines the hydrogeologic region and setting
149 - defines the relative pollution potential
Here the first number (7) refers to the major hydrogeologic region and the upper case
letter (D) refers to a specific hydrogeologic setting. The following number (1) references a
certain set of DRASTIC parameters that are unique to this setting and are described in the
corresponding setting chart. The number below the hydrogeologic setting (149) is the
calculated pollution potential index for this unique setting. The charts for each setting
provide a reference to show how the pollution potential index was derived.
The maps are color-coded using ranges depicted on the map legend. The color codes
used are part of a national color-coding scheme developed to assist the user in gaining a
general insight into the vulnerability of the ground water in the area. The color codes were
chosen to represent the colors of the spectrum, with warm colors (red, orange, and yellow)
representing areas of higher vulnerability (higher pollution potential indexes), and cool colors
(greens, blues, and violet) representing areas of lower vulnerability to contamination. Large
man-made features such as landfills, quarries, or strip mines have also been marked on the
map for reference.
13
GENERAL INFORMATION ABOUT MAHONING COUNTY
Demographics
Mahoning County occupies approximately 419 square miles in northeastern Ohio
(Figure 3). Mahoning County is bounded to the north by Trumbull County, to the west by
Portage County, to the southwest by Stark County, to the south by Columbiana County, and
to the east by Lawrence County and Mercer County, Pennsylvania.
The approximate population of Mahoning County, according to 2000 figures, is
263,884 (Ohio Department of Development, personal communication). Youngstown is the
county seat and largest city and has an estimated population of 91,775 (Ohio Department of
Development, personal communication). Roughly 40 percent of the county’s land area is
used for agricultural purposes. About 30 percent of the county is forested. The remaining 30
percent of the land area is used for urban, industrial, and residential purposes, strip mines,
and reservoirs. These figures are based upon 1985 estimates obtained from the ODNR,
Division of Real Estate and Land Management (REALM), Resource Analysis Program
(formerly OCAP). More specific information may be obtained by contacting REALM.
Climate
The weather station at Canfield reports a mean annual temperature of 48.8 degrees
Fahrenheit for a thirty-year (1961-1990) average (Owenby and Ezell, 1992). According to
Harstine (1991), the average temperature is relatively constant across the county with a slight
temperature increase to the west and south. Mahoning County is located in a region that is
typically one of the coolest regions in Ohio. Mahoning County is too far removed from Lake
Erie to receive any of the lake effect warmth. Higher elevations and many days of cloud
cover may also account for these low average temperatures. The average annual precipitation
recorded at the Canfield weather station is 35.97 inches based on the same thirty-year (1961-
1990) period (Owenby and Ezell, 1992). Harstine (1991) shows that Mahoning County sits
in an area of lower precipitation. The county is just to the south of the major band of high
precipitation (i.e. "the snowbelt") that occupies much of Geauga County and northern
Trumbull County.
Physiography and Topography
Mahoning County lies within the Glaciated Allegheny Plateau section of the
Appalachian province (Frost, 1931 and Thornbury, 1965). According to Fenneman (1938),
Mahoning County lies within the Southern New York Section of the Appalachian Plateau
14
Figure 3. Location of Mahoning County, Ohio.
15
province. The glacial boundary lies roughly ten miles to the south of Mahoning County in
Columbiana County. The highest elevation in the county is approximately 1,320 feet in
Green Township and the lowest elevation is about 795 feet where the Mahoning River enters
Pennsylvania south of Lowellville. The maximum relief throughout the county is over 500
feet. The greatest local relief is the roughly 300 to 350 feet along the valley walls of the
Mahoning River southeast of Lowellville.
The western portion of the county has the lowest relief and is characterized by
relatively flat to gently rolling topography. Relief increases and the topography becomes
much steeper and more rugged in eastern Mahoning County. In western Mahoning County,
end moraines and stream dissection control the rolling or hummocky nature of the
topography. In eastern Mahoning County, the topography of the upland areas is bedrock-
controlled. Eastern and central Mahoning County is characterized by numerous steep,
circular to elongate ridges composed of resistant sandstone bedrock of the Pennsylvanian
System. The common (accordant) elevations of many of these ridges are believed to be due
to the resistance of common bedrock lithologies (Totten and White, 1987).
Modern Drainage
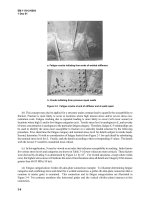
All of Mahoning County eventually drains into the Ohio River watershed. Figure 4
(Cummins, 1950) depicts the modern drainage pattern of Mahoning County. The Mahoning
River roughly encircles the county and is the primary drainage for the majority of the county.
The Mahoning River originates in northwestern Columbiana County and flows to the
northwest, toward Alliance. The Mahoning River cuts across the southwestern corner of
Smith Township and enters Stark County. Near Alliance, the river flows northeastward into
Portage County. Damming the Mahoning River near the boundary between Portage County
and Mahoning County created Berlin Reservoir. The course of the Mahoning River
continues due north into Trumbull County. Lake Milton was constructed by damming the
Mahoning River near the boundary between Trumbull County and Mahoning County. The
Mahoning River continues north into central Trumbull County. North of Warren, near the
divide between the Ohio River Basin and the Lake Erie Basin, the Mahoning River turns
abruptly to the southeast. The Mahoning River re-enters Mahoning County near
Youngstown and eventually enters Pennsylvania southeast of Lowellville.
Several important tributaries of the Mahoning River drain much of northern and
central Mahoning County. There are two major streams named Mill Creek that empty into
the Mahoning River. Mill Creek (west) originates in Goshen Township and flows northwest
into Berlin Reservoir near the Portage County line. The source of Mill Creek (east) is south
of the town of Columbiana. This tributary flows north, joining the Mahoning River in
Youngstown. Meander Creek begins southwest of Canfield and flows due north. This
stream is dammed in southern Trumbull County to form Meander Creek Reservoir. Meander
Creek empties into the Mahoning River near Niles in Trumbull County. The headwaters of
Yellow Creek are in Columbiana County. This stream flows north and is dammed in three
places, forming Pine Lake, Evans Lake, and Lake Hamilton. Yellow Creek joins the
Mahoning River in Youngstown. The source of Crab Creek is in Trumbull County. This
southerly-flowing stream joins the Mahoning River in Youngstown. Dry Run originates in
16
Figure 4. Map showing present drainage pattern in Mahoning County (after Cummins, 1950).
17
eastern Coitsville Township and flows due west where it is dammed to create McKelvey
Lake. This tributary bends to the southwest and empties into the Mahoning River near
Youngstown.
South-central and southeastern Mahoning County is part of the Little Beaver Creek
watershed. Middle Fork Little Beaver Creek originates west of Salem and flows north then
east, roughly encircling the city. This stream bends to the south, entering Columbiana
County near Washingtonville. From its source area in northern Green Township, Cherry
Valley flows south joining Middle Fork Little Beaver Creek in Washingtonville. The
headwaters of East Branch Middle Fork Little Beaver Creek lie just to the east of Cherry
Valley in Green Township. This tributary also flows southward into Columbiana County.
North Fork Little Beaver Creek and its major tributary, Honey Creek, drain the southeastern
corner of Mahoning County. Both streams flow southeastward, joining in Lawrence County,
Pennsylvania. Northeastern Coitsville Township is drained by Little Deer Creek. This
stream flows to the northwest and empties into the Shenango River near Sharon,
Pennsylvania.
Pre- and Inter-Glacial Drainage and Topography
Stout and Lamborn (1924), Stephenson (1933), Stout et al. (1943), Cummins (1950),
and Totten and White (1987) provide accounts of the pre-glacial and inter-glacial drainage
and drainage changes in Mahoning County and adjacent areas. Drainage changes occurring
over time in Mahoning County are numerous and complex and are still not totally
understood. It is important to note that entire drainage systems, including tributaries, have
changed and these various systems have been superimposed (overlapped) over time.
Stout et al. (1943) proposed that a northeasterly-flowing tributary of the Pittsburgh
River drained the majority of Mahoning County (Figure 5). The Pittsburgh River flowed
roughly northward from Pittsburgh and was the master stream draining this area (Stout et al.,
1943 and Totten and White, 1987). Stout et al. (1943) also proposed that the Ravenna River
drained the western margin of Mahoning County. The Ravenna River flowed northwestward
through Portage County and Geauga County. Stout et al. (1943) speculated that these
drainages, although not physically connected, were roughly time equivalent of the Teays
River drainage system in south-central and western Ohio.
Previously, Stout and Lamborn (1924) and Stephenson (1933) had provided an
alternative interpretation of the pre-glacial drainage of the area. These reports referred to the
master stream draining this region as the ancestral Monongahela River. The ancestral
Monongahela River flowed northward, approximately followed the course of the present
Beaver River and Shenango River through western Pennsylvania (Stephenson, 1933). At
Sharon Pennsylvania, the ancestral Monongahela River turned sharply to the southwest,
flowing towards Hubbard. This stream cut the broad valley presently occupied by Crab
Creek (Stephenson, 1933). Where modern Crab Creek valley joins the Mahoning River
valley, the ancestral Monongahela River turned to the northwest, roughly following the
course of the present Mahoning River (Stout and Lamborn, 1924 and Stephenson, 1933).
18
Figure 5. Pre-glacial (Teays Stage) drainage in Northeast Ohio (after Stout et al.,
1943). The line of x’s indicate the drainage divide.
19
The ancestral Monongahela River continued to flow north past Warren and eventually
merged with the northerly-flowing, ancestral Grand River drainage system (Stephenson,
1933). The ancestral Monongahela River drainage system included many primarily
northerly-flowing tributaries that drained Mahoning County.
As ice advanced through Ohio, the ancestral Monongahela drainage system was
blocked. Flow backed up the main trunk valley as well as in many of the tributaries, forming
several large lakes. Eventually spillways were created for these lakes, new stream channels
were downcut, and new drainage systems evolved (Stout and Lamborn, 1924, Stephenson,
1933 and Cummins, 1950). This downcutting was believed to be relatively rapid and in
many places the new channels were cut over 70 feet deeper than the pre-glacial valleys (Stout
and Lamborn, 1924, Stephenson, 1933, and Cummins, 1950). This new drainage system is
referred to as the Deep Stage due to this increased downcutting. In Mahoning County many
of the Deep Stage channels closely followed the previously existing drainage ways.
Regionally, a southerly-flowing system evolved with drainage toward the ancestral Ohio
River. Many of the pre-existing valleys were filled or "buried" by thick sequences of glacial
drift. Figure 6 (Cummins, 1950) depicts the location of the major buried valleys in
Mahoning County. The drift created a new series of drainage divides. Drainage changes
persisted throughout the later Illinoian and Wisconsinan ice advances.
Examples of the buried valleys include a deep, broad valley extending northward
from Damascus and underlying present Mill Creek (west). This valley continues to the north,
passing just east of Berlin Reservoir and underlying Lake Milton. A major buried valley
underlies the Mahoning River in southwestern Smith Township. A tributary buried valley
originating near Sebring and Beloit joins this trunk valley near Alliance. Underlying the
Middle Fork Little Beaver Creek east of Salem and New Albany is a relatively deep buried
valley that extends to the north, underlying Meander Creek and Meander Creek Reservoir.
From Youngstown to Columbiana, a broad buried valley underlies Mill Creek (east). Smaller
tributary valleys originate near the source of both modern Cherry Valley and East Branch
Middle Fork Little Beaver Creek. These two valleys merge to create a deep valley that joins
the master valley underlying Mill Creek (east) southeast of Canfield. A somewhat shallower
buried valley underlies present Yellow Creek between Evans Lake and Youngstown. Finally,
a deep, broad valley, which contained the ancestral Monongahela River, underlies modern
Crab Creek.
The pre-glacial topography of Mahoning County was probably somewhat steeper and
more rugged than the modern topography (Stout and Lamborn, 1924, Stephenson, 1933, and
Cummins, 1950). The maximum relief and average local relief were also believed to be
greater. Topography was controlled by resistant sandstone bedrock. Glaciation had the net
effect of filling in valleys and smoothing-out the topography.