Tài liệu Air Pollution And GHG Emissions indicAtors for roAd trAnsPort And ElEctricity sEctors docx
Bạn đang xem bản rút gọn của tài liệu. Xem và tải ngay bản đầy đủ của tài liệu tại đây (3.42 MB, 154 trang )
Air Pollution and GHG
Emissions Indicators
for Road Transport and
Electricity Sectors
Guidelines for Development, Measurement, and Use
Air Pollution and GHG Emissions Indicators
for Road Transport and Electricity Sectors
Guidelines for Development, Measurement, and Use
Clean Air Asia
2012
2
Air Pollution and GHG Emissions Indicators for Road Transport and Electricity Sectors:
Guidelines for Development, Measurement, and Use
©2012 Clean Air Initiative for Asian Cities Center Inc. All rights reserved.
Clean Air Asia. 2012. Air Pollution and GHG Emissions Indicators for Road Transport and Electricity
Sectors: Guidelines for Development, Measurement, and Use. Pasig City, Philippines.
This publication may be reproduced in whole or in part in any form for educational or non-profit
purposes without special permission from the copyright holder, provided acknowledgment of the
source is made. Clean Air Asia would appreciate receiving a copy of any publication that uses this
Clean Air Asia publication as a source. No use of this publication may be made for resale or for any
other commercial purpose whatsoever, without prior permission in writing from the CAI-Asia Center.
Disclaimer
The views expressed in this publication are those of Clean Air Asia staff, consultants, and management.
These views do not necessarily reflect the views of the Board of Trustees of Clean Air Asia, the World
Bank, and other Knowledge Partners. Clean Air Asia does not guarantee the accuracy of the data
included in this publication and accepts no responsibility for any consequence of their use.
Cover Page design by Earl Paulo Diaz and Dana Raissa De Guzman
Contact
Clean Air Asia Center
Unit 3505
Robinsons-Equitable Tower
ADB Avenue, Pasig City,
1605 Metro Manila,
Philippines
Clean Air Asia
China Office
901A, Reignwood Building
No.8 YongAnDongLi
Jianguomenwai Avenue
Beijing 100022 China
Clean Air Asia
India Office
Regus Elegance
Elegance Tower, Jasolaz,
New Delhi – 110025,
India
Country Networks
China | India | Indonesia | Nepal | Pakistan | Philippines | Sri Lanka | Vietnam
www.cleanairasia.org
Air Pollution and GHG Emissions Indicators for Transport and Energy Sectors:
Guidelines for their Development, Measurement, and Use
Acknowledgements
Clean Air Asia is deeply grateful to the World Bank Development Grant Facility and the members of
the Knowledge Partnership for their support of this report.
This report was prepared by Clean Air Asia staff led by Maria Katherina Patdu and Eryn Gayle de Leon.
Sophie Punte, May Ajero, Herbert Fabian, Sudhir Gota, and Alvin Mejia of Clean Air Asia substantially
contributed to this report.
Sameer Akbar was the task leader for this grant from the World Bank.
The following individuals played key roles in the development of project outputs, including this report:
• Peng Yan, Wan Wei, Song Su and Zhang Chu from Clean Air Asia China Office
• Parthaa Bosu and Sameera Kumar Anthapur from Clean Air Asia India Office
• Dollaris Suhadi and Mariana Sam from Swisscontact Indonesia
• Anjila Manandhar, Amita Thapa Magar, and Suman Udas from Clean Air Network Nepal
• Ahmad Saeed, Saadullah Ayaz, and Shahid Lutfi from the International Union for Conservation
of Nature Pakistan
• Thusitha Sugathapala from Sri Lanka Sustainable Energy Authority
• Phan Quynh Nhu from Vietnam Clean Air
• Le Thi Ngoc Quynh from Electricity of Vietnam
• Le Van Dat from Transport Development and Strategy Institute
• Mongkut Piantanakulchai from Sirindhorn International Institute of Technology, Thammasat
University
• Iris May Ellen Caluag from the Partnership for Clean Air
Clean Air Asia greatly appreciates the many experts, who took the time and effort to review the
outputs of the project, including:
• Axel Friedrich formerly from the Environment and Transport, Noise - Umweltbundesamt
(Federal Environment Agency Germany)
• Eric Zusman from the Institute for Global Environmental Strategies
• Iwao Matsuoka from the Institution for Transport Policy Studies
• Jenny Yamamoto from the United Nations Economic and Social Commission for Asia and the
Pacific
• John Rogers from The World Bank
• John Wells and Amornwan Resanond from Low Emissions Asian Development (LEAD) Program
• Ko Sakamoto from the Asian Development Bank
• Lewis Fulton from University of California Davis
• Manfred Breithaupt from the German International Development Cooperation
• Mylene Cayetano from Clean Air Asia
• O.P. Agarwal and Natalia Kulichenko from The World Bank
• Rajiv Garg from the United Nations Environment Programme
• Stasys Rastonis from Chemonics International, Inc
• Todd Litman from Victoria Transport Policy Institute
Clean Air Asia thanks all other organizations which helped make this report possible.
List of Abbreviations
2W
two-wheelers
3W
three-wheelers
ADB
Asian Development Bank
ASEAN
Association of Southeast Asian Nations
ASIF
Activity-Structure-Intensity-Fuel Approach
CAI-Asia
Clean Air Initiative for Asian Cities
CNG
compressed natural gas
CO2
Carbon dioxide
CoP
Communities of Practice
DGF
Development Grant Facility
DMT
Department of Motor Traffic
EEA
European Environment Agency
EST
Environmentally Sustainable Transport
GAPF
Global Atmospheric Pollution Forum
GCIF
Global City Indicators Facility
GDP
Gross Domestic Product
GHG
greenhouse gas/es
HCV
Heavy commercial vehicle
IEA
International Energy Agency
IEA
International Energy Agency
IPCC
Intergovernmental Panel on Climate Change
ITF
International Transport Forum
LCV
Light commercial vehicle
LPG
liquefied petroleum gas
MEET
Ministerial
MEET
Ministerial Conference on Global Environment and Energy in Transport
MRV
measurement, reporting and verification
MUV
Multi-utility vehicle
NGHGI
National Greenhouse Gas Inventory
NOx
Nitrogen oxide
OECD
Organisations for Economic Co-operation and Development
PM
Particulate matter
PM
Particulate matter with diameter of 10 microns or less
Portal
Clean Air Portal – www.cleanairinitiative.org
SO2
Sulfur dioxide
TERM
Transport and Environment Reporting Mechanism
UNECEUnited National Economic Commission for Europe
UNFCCC
United National Framework Convention on Climate Change
UNSD
UN DESA Division for Sustainable Development
VKT
vehicle-kilometers travelled
WHO
World Health Organization
3
Table of Contents
List of Abbreviations ................................................................................................................. 1
List of Tables ............................................................................................................................. 2
List of Figures ............................................................................................................................ 3
1.
Introduction ........................................................................................................................ 5
2.
Air Pollution and GHG Emissions Indicators for Road Transport and Electricity Sectors ..14
3. Guidelines for Generation, Interpretation and Analysis of AP and GHG Emissions
Indicators for Road Transport ..................................................................................................29
4. Guidelines for Generation, Interpretation, and Analysis of AP and GHG Emissions
Indicators for Electricity ...........................................................................................................82
Annexes ..................................................................................................................................125
Annex B
Annex C
Annex D
Annex E
Default Values for Transport Input Parameters ....................................................127
Related Information for General Input Parameters ..............................................142
Related Information for Transport ........................................................................144
Related Information for Energy ............................................................................148
4
List of Tables
Table 1: List of Air Pollution and GHG Emissions Indicators and Input Parameters for Road
Transport ................................................................................................................................................... 14
Table 2: List of Air Pollution and GHG Emissions Indicators and Input Parameters for
Electricity ................................................................................................................................................... 15
Table 3. Selection criteria for the indicators ....................................................................................... 17
Table 4: Structure of the Guidelines .................................................................................................... 25
Table 5. Overview of Data Availability of Input Parameters for Each Country ............................ 29
Table 6. General Data Assumptions and Approach .......................................................................... 31
Table 7. Per Country Data Assumptions and Approach................................................................... 32
Table 8: List of Transport Input Parameters According to Availability and Importance ............ 36
Table 9: Vehicle types adopted for the guidelines ............................................................................ 39
Table 10: Summary of National Bio-fuels Mandates and Targets in Selected Countries ........... 54
Table 11: Overview of data availability of input parameters for each country ............................ 85
Table 12: General Data Assumptions and Approach ........................................................................ 87
Table 13. Per Country Data Assumptions and Approach ................................................................ 88
Table 14: List of Energy Input Parameters According to Availability and Importance............... 92
Table 15: Per Capita Trip Rate Default Values (in Number of Trips)............................................ 127
Table 16: Default Trip Mode Share (%) ............................................................................................. 127
Table 17: Default Values for Average Trip Length (kilometers) .................................................... 128
Table 18: Average Occupancy ............................................................................................................ 128
Table 19: Speed and Emission factors Index (assuming 0 at 50 kmph) ....................................... 130
Table 20: Fuel Consumption and Emission Factors for Different Vehicles in Asia .................... 131
Table 21: Construction Emission Factors .......................................................................................... 133
Table 22: Mode Shifts towards Bike Sharing Schemes Around the World ................................. 134
Table 23: Heating Value by Fuel Type ............................................................................................... 135
Table 24: Carbon Emission Factor by Fuel Type ............................................................................. 136
Table 25: Percent of Carbon Oxidized .............................................................................................. 137
Table 26: Calorific Value by Fuel Type .............................................................................................. 137
Table 27: Particulate Matter Combustion Emission Factor ........................................................... 138
Table 28: Ash Content by Fuel Type.................................................................................................. 138
Table 29: Sulfur Content by Fuel Type .............................................................................................. 139
Table 30: Sulfur Retention by Fuel Type ........................................................................................... 140
Table 31: Net Calorific Value by Fuel Type ...................................................................................... 141
5
List of Figures
Figure 1. CO2 emission estimates for India’s road transport sector from various organizations9
Figure 2. Data collection for road transport in Sri Lanka ................................................................... 9
Figure 3. Initial countries included in the Knowledge Partnership ................................................. 10
Figure 4. Main activities in the Knowledge Partnership ................................................................... 11
Figure 5. Relationship of different data levels .................................................................................. 23
Figure 6. Fragmented data with consultants...................................................................................... 23
Figure 7. Drivers of data generation/collection ................................................................................. 24
Figure 8. Flowchart to Estimate Emissions from Road Transport .................................................. 28
Figure 9. Exhaust Emissions Test Procedure...................................................................................... 51
Figure 10. Flowchart to estimate emissions from Electricity........................................................... 84
6
1.
Introduction
Asia is urbanizing fast. Over 50% of the population now lives in cities. Over the next 30 years,
another 1.1 billion people are expected to be living in cities. In 2010, 12 megacities are in Asia
and by 2025, it is expected that 21 of the 37 megacities in the world will be in this region (Asian
Development Bank (ADB), 2010).
Asian economies are growing. Many emerging market economies in Asia are growing above prerecession trends, and they are projected to continue their growth (International Monetary Fund
(IMF), 2012). PR China, India, and Indonesia had the highest gross domestic product (GDP) in the
region, ranging from at least 250 million to 3.2 billion USD in 2010. PR China (14.47%), Nepal
(25.3%), and Singapore (10.4%) had the fastest GDP growth rates (World Bank (WB), 2012).
Growth for Asia and the Pacific region is projected to be at 6% in 2012 before rising to about
6.5% in 2013 (IMF, 2012).
Air pollution in Asia is worsening, and greenhouse gas (GHG) emissions is increasing. Air
pollution in Asia is causing over 800,000 premature deaths each year, according to the World
Health Organization (WHO, 2011). Carbon dioxide (CO2) emissions are also on the rise. In 2010,
Asia emitted at least 30% of the world’s CO2 emissions (International Energy Agency (IEA), 2011).
The business-as-usual scenario suggests that Asia will contribute around 45% of global energyrelated CO2 emissions by 2030 and an estimated 60% by 2100 (United Nations Environment
Programme (UNEP), 2012). Some Asian cities are also estimated to have higher CO2 emissions per
capita compared with cities in the developed countries. For example, in 2010, the estimated CO2
emissions per capita in Shanghai (11.1 tons per capita) and Beijing (10.1 tons per capita) were
higher when compared with London (6.8 tons per capita) and New York (7.5 tons per capita)
(Want China Times, 2012; City of New York, 2010; The Guardian, 2010).
The growth of the region will boost energy demand in the transport and electricity (and heat)
sectors. The annual average growth rate of Asia’s energy demand from 1980 to 2007 was 4.6%.
This is more than twice the global average of 2% (Komiyama, n.d.). In 2010, Asia accounted for
30% of the world’s total energy demand and this share is expected to increase further in the near
future (British Petroleum (BP), 2011). PR China accounts for the largest share of the growth in
global energy use, with demand projected to increase up to 60% by 2035 (IEA, 2012).
Transport is the fastest growing contributor to global CO2 emissions. The transport sector
consumed 19% of total fuel use and contributed 22% of total (energy-related) CO2 emissions (IEA
estimates, 2012). Of the total CO2 emissions, about 74% comes from road transport. Transport
CO2 emissions are also expected to increase 57% worldwide in 2005-2030, with PR China and
India accounting for more than half of this growth. Air pollution from transport is rising due to the
sharp increase in vehicle use, which has offset efforts to make fuels and vehicles cleaner. Of
particular concern are diesel emissions and small particulates (PM10 and PM2.5). Diesel fumes can
cause lung cancer as confirmed by the WHO (International Agency for Research on Cancer (IARC),
2012). Small particulates worsen asthma and other respiratory and cardiovascular diseases. Black
7
carbon, a component of soot, which comes from gasoline and diesel vehicles also contributes to
global warming more than previously thought.
Electricity and heat production has the largest share of global CO2 emissions. Electricity and
heat production worldwide contributes 41% of total CO2 emissions (IEA, 2012). Asia boosted its
electricity generation to 6,290 terawatt-hours (TWh) in 2010—a 139% increase from 2000 figures
(IEA, 2012). In 2009, 81% of electricity was generated from fossil fuels, specifically coal, which
accounts for 70% of total electricity generation. Fossil fuels are a significant source of GHG and
Sulfur dioxide (SO2). Although GHG emissions (as CO2 emissions) have yet to be abated, there
have been significant advancements in reducing air pollution from power generation. The
implementation of abatement technologies, such as flue-gas desulfurization devices in power
plants, has reduced SO2 emissions from this sector.
Need for Information to Manage Emissions
Relevant data. Policy and decision makers need relevant data and emissions indicators of road
transport and electricity sectors to track the progress of policies that aim to increase energy
efficiency and to reduce emissions. This is relevant to low-emissions development strategies at
the national and local levels and participation in international climate market mechanisms.
While there are initiatives on emissions indicators from transport and energy, few focus on Asia.
Data and indicators that are available for Asia usually are aggregate values. For example,
indicators are combined for a group of Asian countries (e.g. Southeast Asia), or they are
presented as total transport emissions without a breakdown for different fuel and vehicle
categories. Such aggregated data are of minimal use in developing targeted policies to reduce
emissions.
Reliable data. Many international organizations echo the need to improve data accuracy,
timeliness, and comparability. This includes the 2009 Ministerial Conference on Global
Environment and Energy in Transport (MEET) and the IEA, among others. The need for better
government data is expected to increase considerably as climate negotiations call for a more
regular and updated national communications by developing countries and for a measurement,
reporting and verification (MRV) mechanism to assess progress in emission pledges and/or
obligations.
Standard methodologies and assumptions are important to ensure that data are reliable and
comparable. Supporting data and assumptions used in emissions calculation by different
organizations vary and are often not transparent. For example, the CO2 emissions estimates for
India’s transport sector by the IEA, The Energy Research Institute (TERI), World Resource Institute
(WRI), and other organizations in 2005 ranged from 98 million tons to 216 million tons—a
difference of more than 100% (see Figure 1).
8
Figure 1. CO2 emission estimates for India’s road transport sector from various organizations
Accessible data. Collected data are often not easily accessible, or are incomplete. For example,
the Sri Lanka Department of Motor Traffic collects detailed data as part of vehicle registrations.
However, the only data made publicly available through the Central Bank and the Department of
Census and Statistics are the number of vehicles registered and fuel used aggregated by vehicle
class. Another example is pilot projects and local programs that generate interesting data and
emission factors but their use is limited, i.e. these factors cannot be extrapolated easily to an
entire city, sector, or country (see Figure 2).
Furthermore, various ministries ranging from finance, customs, and trade to energy,
ministries—ranging
environment and transport, collect relevant data, but coordination among them is often lacking.
nd
An added complication is that universities, development agencies, corporations, and other
institutions collect data for their own research and programs but seldom share thes with
these
government authorities or the public.
Figure 2. Data collection for road transport in Sri Lanka
Clean Air Asia, 2010
9
Benchmarking Emissions in Asia
To address the challenges explained earlier, Clean Air Asia brought together various
organizations in a knowledge partnership to improve access to air quality and climate change
data. The partnership aims to further enrich policy development interventions relevant to energy,
transport, and urban development. It was initiated with funding from the World Bank
Development Grant Facility (DGF) and with co
co-financing from other partners.
Knowledge Partnership for Measuring Air Pollution and GHG Emissions in Asia
The World Bank DGF, Asian Development Bank (ADB), China Sustainable Energy Program (Energy
Foundation), Cities Development Initiative for Asia (CDIA), German International Development
Cooperation (GIZ), Institute for Global Environmental Strategies (IGES), Institution for Transport Policy
(IGES),
Studies (ITPS), Institute for Transportation and Development Policy (ITDP), Transport Research
Laboratory (TRL), United National Centre for Regional Development (UNCRD),and Veolia
Environnement S.A.
The partnership first focused on 13 countries in Asia (
(Figure 3). These countries represent 95% of
).
Asia’s total population and 89% of its total GDP (based on current exchange rates) (IEA, 2012). It
includes two countries from BRICS (India and PR China), representing some of the world’s leading
representing
emerging economies. In most of these countries, Clean Air Asia has an established country
network, which can facilitate the process of sustaining this initiative in the country.
Figure 3. Initial countries included in the Knowledge Partnership
10
The development of road transport and electricity emissions indicators was supplemented by (a)
guidelines for the development, measurement and use of these indicators and (b) an online
database where the indicators along with supporting data and assumptions for its calculation are
assumptions
provided. This process followed the broad steps provided in the figure belowError! Reference
Error! R
source not found..
Figure 4. Main activities in the Knowledge Partnership
.
This knowledge partnership has four outputs:
1) Air Pollution and GHG Emissions Indicators for Road Transport and Electricity Sectors in
Asia: Guidelines for their Development, Mea
Measurement, and Use
The Guidelines documents the process involved in developing the air pollution and GHG
emissions indicators for road transport and electricity and detailed methodology on how to
measure and use the emissions indicators. The general outline of the methodology sheets for t
the
emissions indicators and input parameters is provided in the table below.
The methodology was based on existing guidelines by the European Environment Agency (EEA),
IEA, Intergovernmental Panel on Climate Change (IPCC), and the US Environmental Protec
Protection
Agency (US EPA). The sources for the input parameters used to derive the indicators are also
11
provided. This document was prepared to facilitate and encourage consistent data collection in
the future.
This publication is available online:
/>2) Accessing Asia: Air Pollution and Greenhouse Gas Emissions Indicators from Road
Transport and Electricity
Accessing Asia presents the first benchmark of air pollutant (as particulate matter, PM) and GHG
(as CO2) emissions for 13 countries across Asia for road transport and electricity generation. To be
released biennially, it compares selected emissions indicators and emissions drivers at the national
level. Future editions will feature city emissions indicators and drivers. Future editions will feature
city emissions indicators and drivers. Updates on national level indicators will also be included.
The report features the following:
● Road transport - Total road transport emissions for Asia and individual countries, and
emissions intensities expressed by population, GDP, passenger and freight movement,
vehicle types, and fuel types. Data are provided for underlying emission drivers, including
growth in vehicle numbers, motorization index, fuel consumption, and travel activity.
● Electricity - Total electricity generation and consumption emissions for Asia and individual
countries, and consumption and emissions intensities expressed by population, GDP, enduse sector, and fuel type. Data are provided for underlying emission drivers, including
electricity access, generation, consumption, trade, and fuel mix.
This publication is available online:
/>3) Country Profiles
Accompanying Accessing Asia, country profiles were developed using selected emissions
indicators and emissions drivers on per country level.
This publication is available online:
/>4) www.CitiesACT.org - Clean Air Asia’s online database on air quality, climate change,
energy, and transport
The CitiesACT (www.CitiesACT.org) was developed by Clean Air Asia with support from the ADB,
the Global Air Pollution Forum, and the World Bank together with Clean Air Asia Partnership
members. The revamped www.CitiesACT.org was launched at the Better Air Quality (BAQ)
conference in Hong Kong in December 2012 (www.baq2012.org).
This online database contains the following:
12
•
•
•
•
•
1.1
Air pollution (PM, SO2, and NOx) and CO2 emissions indicators for road transport and
electricity for 13 countries and 23 cities in Asia.
Input parameters used to derive the emission indicators.
Reported ambient air quality levels compiled for over 400 Asian cities.
Ambient air quality standards, fuel quality, and vehicle emission standards for 22 Asian
countries.
Air quality monitoring information in Asian cities.
This report
This report is composed of two parts:
• Process for development of air pollution and GHG emissions indicators for transport and
energy sectors, including a proposed system for data collection and future updating of
data and indicators
• Guidelines for each indicator and input parameter for road transport and electricity
1.2
Scope and Limitations
For this report, the transport sector is limited to road-based transport and the energy sector is
limited to electricity. Emissions considered as representative indicators of AP and GHG emissions
in the transport and energy sectors are Carbon dioxide (CO2), Nitrogen oxide (NOx), Particulate
matter (PM) and Sulfur dioxide (SO2). Specifically, indicators for CO2, NO2 and PM emissions are
considered relevant for road transport while indicators for CO2, SO2 and PM emissions are
relevant for electricity.
13
2.
Air Pollution and GHG Emissions Indicators for
Road Transport and Electricity Sectors
The air pollution and GHG emissions indicators for road transport and electricity are listed in
Table 1 and
Table 2. Collectively, there are 39 indicators; 21 indicators for road transport sector and 18
indicators for electricity. This chapter will discuss the framework used for the selection of the
indicators and input parameters.
Table 1: List of Air Pollution and GHG Emissions Indicators and Input Parameters for Road
Transport
Air Pollution and GHG Emissions Indicators for
Input Parameters
Road Transport
T1 Total CO2 emissions from road transport
• Average vehicle-kilometers
T2 Road transport CO2 emissions per GDP
traveled (VKT) by vehicle and fuel
type
T3 Road transport CO2 emissions per capita
T4 Road transport CO2 emissions per passenger km
• Vehicle population by vehicle and
fuel type
T5 Road transport CO2 emissions per freight ton-km
• Average fuel efficiency by vehicle
T6 Road transport CO2 emissions per vehicle type
and fuel type
T7 Road transport CO2 emissions per vehicle and fuel type
• Average speed
T8 Total PM emissions from road transport
• Emission factor
T9 Road transport PM emissions per GDP
T10 Road transport PM emissions per capita
• Fuel characteristics
T11 Road transport PM emissions per passenger km
• GDP
T12 Road transport PM emissions per freight ton-km
• Total population
T13 Road transport PM emissions per vehicle type
• Average occupancy
T14 Road transport PM emissions per vehicle and fuel type
• Average load
T15 Total NOx emissions from road transport
T16 Road transport NOx emissions per GDP
T17 Road transport NOx emissions per capita
T18 Road transport NOx emissions per passenger km
T19 Road transport NOx emissions per freight ton-km
T20 Road transport NOx emissions per vehicle type
T21 Road transport NOx emissions per vehicle and fuel type
Notes:
(1) Vehicle categories are: two-wheelers (2W), three-wheelers (3W), passenger cars (PC), multi-utility
vehicles (MUV), bus, light commercial vehicles (LCV), and heavy commercial vehicles (HCV).
(2) Fuel categories are diesel, gasoline, LPG, CNG, and electric.
14
Table 2: List of Air Pollution and GHG Emissions Indicators and Input Parameters for
Electricity
Air Pollution and GHG Emissions Indicators for
Input Parameters
Electricity
E01 Total CO2 emissions (from electricity generation)
• Electricity generation, total and
E02 CO2 emissions by source type (electricity generation)
by source type
E03 CO2 emissions per kWh (electricity generation)
• Electricity consumption, total
E04 CO2 emissions by end-use sector (electricity consumption)
and by end-use sector
E05 CO2 emissions per GDP (electricity consumption)
• Heat rate (fuel efficiency)
E05 CO2 emissions per capita (electricity consumption)
• Emission factor
E07 Total PM emissions (electricity generation)
• GDP
E08 PM emissions by source type (electricity generation)
• Total population
E09 PM emissions per kWh (electricity generation)
• Population with access to
E10 PM emissions by end-use sector (electricity consumption)
electricity
E11 PM emissions per GDP (electricity consumption)
E12 PM emissions per capita (electricity consumption)
E13 Total SO2 emissions (electricity generation)
E14 SO2 emissions by source type (electricity generation)
E15 SO2 emissions per kWh (electricity generation)
E16 SO2 emissions by end-use sector (electricity consumption)
E17 SO2 emissions per GDP (electricity consumption)
E18 SO2 emissions per capita (electricity consumption)
Notes: (1) Source type includes coal, oil, and natural gas (not included for SO2). (2) End-use sector
includes the residential, commercial, industrial, transport, and other sector/s. (3) Total electricity
generation and consumption excludes transmission and distribution losses. (4) CO2 emissions
indicators described only refers to CO2, and not CO2-eq.
2.1
Understanding Indicators and Input Parameters
An indicator is a variable based on measurements or derived from input parameters,
representing, as accurately as possible and necessary, a phenomenon of interest.1 While an input
parameter is a property that is measured or observed that is used in the calculation/derivation of
an indicator.
Adapting this definition, an air pollution and GHG emissions indicator for road transport and
electricity is a variable, derived from input parameters, which represents the emissions as a result
of these sectors (or factors which may cause emissions, as accurately as possible and necessary.
1
Joumard, R. and Gudmundsson, H., (Eds). (2010). Indicators of environmental sustainability in transport: a interdisciplinary approach to
methods. INRETS report, Recherches R282, Bron, France.
15
Indicators perform many functions. They can support better decisions-making and more effective
actions by simplifying, clarifying and making aggregated information available to policy makers.2
They are essential tools for communicating issues to policymakers and to the public, and for
promoting institutional dialogue.3 Joumard, R. and Gudmundsson, H., (Eds) (2010) characterized
the general policy-type functions (supporting decision-making or policy development) of
indicators as:
•
•
•
•
•
•
•
•
Focus function – What is important?
Descriptive function – What is the situation? Where are we going?
Assessment function – How are we doing relative to previous
year/standard/target/reference point?
Diagnostic function – What is wrong? How much is due to different factors?
Prioritizing – What should we do?
Accountability function – Who is responsible?
Learning/ Improving function – How can we improve? How can we do better?
Communicating – How can it be shown?
This work focuses on indicators describing and assessing what is going on in terms of emissions in
the road transport and electricity sectors.
While indicators are useful, it is necessary to be aware of the inherent limitations of an indicator
for proper use and interpretation. Several of limitations in indicators are influenced by the input
parameters used for its derivation. Practical issues that must be taken into consideration include
the scope and quality of input parameters used to derive an indicator, the data sources and
collection procedure, and presentation and interpretation of indicators.4 Each indicator should be
read and interpreted in reference to a country’s potentially unique circumstances.5 These practical
issues are addressed in these guidelines and are discussed for each of the selected indicators and
input parameters.
2.2
Framework for Selection of Indicators and Input Parameters
Approach
A theme/issue-based framework was used in identifying indicators. The indicators selected were
specifically focused on describing and assessing transport- and energy-related air pollution and
GHG emissions. In relation to the UN-DSD Indicators for Sustainable Development, the selected
indicators are categorized under the Atmosphere theme.6
2
United Nations Development of Economic and Social Affairs (UN-DESA). (2010). Indicators of Sustainable Development: Guidelines and
Methodologies. 3rd Ed. United Nations, New York.
3
International Atomic Energy Agency (IAEA), UN Department of Economic and Social Affairs, International Energy Agency, Eurostat and
European Environment Agency. (2005). Energy Indicators for Sustainable Development: Guidelines and Methodologies. IAEA, Austria.
4
World Health Organization (WHO). (2006). Reproductive Health Indicators: Guidelines for their generation, interpretation and analysis for
global monitoring. WHO, Geneva, Switzerland.
5
International Atomic Energy Agency (IAEA), UN Department of Economic and Social Affairs, International Energy Agency, Eurostat and
European Environment Agency. (2005). Energy Indicators for Sustainable Development: Guidelines and Methodologies. IAEA, Austria.
6
United Nations Department of Economic and Social Affairs (UN-DESA). (2010). Indicators of Sustainable Development: Guidelines and
Methodologies. 3rd Ed. United Nations, New York.
16
Criteria for the selection of Indicators
The selection of indicators is, to a large extent, determined by the purpose of the indicator set.7
The purpose of these indicators is to:
• Describe the state of air pollution and GHG emissions in the transport and energy sectors;
• Assess and measure their trends and tendencies, based on a reference point; and
• Support the setting of priorities and track progress of actions taken for transport and
energy sectors.
It is also important to note that indicators in isolation do not provide comprehensive insights. It is
necessary to assess many indicators and linkages between different indicators to get a more
comprehensive understanding of a situation. Aside from their purpose, there are other criteria
taken into consideration in identifying and selecting emissions indicators for transport and energy
sectors (Table 3).
Criterion
Demand-driven
7
Table 3. Selection criteria for the indicators
Explanation/Description
In identifying and selecting indicators, it is necessary to identify the
primary users of the indicators and what they need to know/ need
indicators to address.
The proposed indicators are intended for use primarily by
• Policy-makers and decision-makers at national and local levels
(especially useful for official national indicator sets, policy
development support, international reporting mechanisms,
others);
• International and regional strategies and indicator programmes
(e.g., Bangkok 2020 Declaration);
• Development
organizations
and
financial
institutions
(understanding trends of air pollution and GHGs emissions in the
region is needed to proactively manage risk and enhance quality
of their operations).
United Nations Department of Economic and Social Affairs (UN-DESA). (2010). “Indicators of Sustainable Development: Guidelines and
Methodologies.” 3rd Ed. United Nations, New York.
17
Criterion
Explanation/Description
Scientifically robust
An indicator must be a valid, specific, sensitive and reliable reflection of
that which it purports to measure.
• A valid indicator must actually measure the issue or factor it is
supposed to measure.
• A specific indicator reflects only changes in the issue or factor
under consideration.
• The sensitivity of an indicator depends on its ability to reveal
important changes in the factor of interest.
• A reliable indicator must give the same value if its measurement
were repeated in the same way on the same population and at
almost the same time.
Source: WHO, 1997.
Measurable
A measurable indicator should be straight-forward and relative
inexpensive to measure.
Source: Dale and Beyeler, 2001.
Input parameters required to calculate an indicator should be available or
relatively easy to acquire by feasible data collection methods that have
been validated in field trials. Source: WHO, 1997.
Data availability
The data have to be accurate, comparable over time, complete with
historical information and covering sufficient geographic area. Source:
Boyle, 1998.
Indicators will be easily estimated if input parameters are already
regularly measured or collected by other organizations/institutions.
An indicator must adequately encompass all the issues or sectors it is
expected to cover. Source: WHO, 1997.
Representative
Emissions considered as representative indicators of air pollution and
GHG emissions in the transport and energy sectors are CO2, NOx, PM
and SO2. Specifically, indicators for CO2, NO2 and PM emissions are
considered relevant for road transport while indicators for CO2, SO2 and
PM emissions are relevant for power generation. General information on
these pollutants is provided below.
CO2 emissions
Carbon dioxide (CO2) is the most important greenhouse gas as it
accounts for the largest proportion of anthropogenic emissions and is
currently responsible for about half of the global warming impact. CO2
also has a longer lifetime than other greenhouse gases. The global
warming potential (GWP) of CO2 (measured as CO2-eq) is often
18
Criterion
Explanation/Description
considered the unit of measure of the warming effect of GHGs over a
100-year timeframe. The concentration of CO2 is increasing mainly due to
anthropogenic activities and deforestation. More extreme weather
events in the form of increased storms, rainfall, and drought are
predicted. Although there is no forecast on the frequency and location of
these events, developing countries are expected to adapt to their effects
i.e. floods, landslides, and alike.
NOx emissions
Nitrogen oxides (NOx) is a general set of pollutants including Nitrogen
dioxide (NO2), Nitric oxide (NO), Nitrous acid (HNO2) and Nitric acid
(HNO3). Aside from direct emission from vehicular sources, the majority
of NOx emissions are in the form of Nitrogen oxide (NO), which is
subsequently oxidized by ozone (O3) in the atmosphere to form the
secondary pollutant NO2. It is a major source of tropospheric ozone in
the presence of hydrocarbons and ultraviolet light, thus playing an
important role in determining ambient O3 concentrations. NO2 is also a
key precursor of nitrate particles which form an important fraction of
ambient particulates with diameter of 2.5 microns or less (PM2.5). As a
strong oxidant, it causes a range of respiratory and pulmonary
complications and adverse birth outcomes.
PM emissions
Particulate Matter (PM) is a complex mixture of extremely small solids
and liquid droplets. PM is emitted with the combustion of fossil fuels for
energy. They can also be formed by precursors chemically transformed in
the atmosphere. Particle pollution is a serious environment, economic,
and health problem. In 2001, the WHO estimated the total number of
PM-related premature deaths to be approximately 2.5 million deaths per
year worldwide, at least half of which are due to outdoor air pollution in
Asia.
SO2 emissions
Sulfur dioxide (SO2) belongs to a family of sulfur oxide gases (SOx). It is
formed from the combustion of sulfur-containing raw materials such as
coal and metal-containing ores as well as in oil refining process. SO2 has
adverse effects on human health causing series of respiratory and
pulmonary disorders. SO2 can be transported over large distances
creating sulfuric acid (H2SO4) causing regional acid rain. Additionally,
sulfate particles are known to combine with other compounds in the
atmosphere, such as ammonia, to contribute to the secondary formation
of fine particulate matter (PM2.5).
19
Criterion
Explanation/Description
Understandable
An indicator must be simple to define and its value must be easy to
interpret.
Source: WHO, 2006.
A transparent indicator is one which is feasible to understand and
possible to reproduce for intended users.
Transparency
Ethical
The input parameters, assumptions, methods, models and theories must
be accessible. Transparency allows the user to check the calculation and
therefore to trust in the figures. Transparency is associated with but not
identical to simplicity. A simple indicator may be more attractive because
it easier to show how it is produced. However, complex indicators may
also be transparent if the methodology is well justified, well defined and
well explained. Source: Joumard, R. and Gudmundsson, H., (Eds) 2010.
An indicator must be seen to comply with basic human rights and must
require only data that are consistent with the morals, beliefs or values of
the local population. Source: WHO, 1997.
Criteria for the selection of Input Parameters
As previously discussed, several limitations in indicators are influenced by the input parameters
used its derivation. Availability of good quality, timely, comparable and reliable input parameters
is a prerequisite for establishing and maintaining policy-relevant air pollution and GHG emissions
indicators.
An initial list of input parameters were derived based on known methodologies used for
calculating air pollution and GHG emissions from on-road transport and from energy sector.
Subsequently, data mapping tools were developed and implemented to understand the
availability and quality of these input parameters. The mapping exercise also included the
following information for each data parameter:
• Institutional responsibility for data collection, management and dissemination;
• Frequency and reliability of data collected; and
• Existing quality assurance mechanisms employed by institutions in data collection.
Data availability, quality and relevance for deriving an indicator were the main considerations in
selecting the input parameters. Data mapping activities were undertaken in 13 Asian countries:
Bangladesh, China, India, Indonesia, Lao PDR, Malaysia, Nepal, Pakistan, Philippines, Singapore,
Sri Lanka, Thailand, and Vietnam. Summary results are presented in Table 5 and Table 6, with
focus on the availability and importance for assessing air pollution and GHG emissions from road
transport and electricity sector.
20
The selected input parameters to be used are specified in Table 8. The information included in the
table includes:
• Importance: The column indicates level of importance of the input parameter for deriving
an indicator. 1 = High, required in order to derive indicator, 2 = Medium, also necessary
to derive an indicator but can be replaced/supported with other input parameters, 3 =
Low, would be nice to have, but not necessary.
• Availability: Denotes availability of data. 1 = High, available in most countries, 2 =
Medium, available in many countries, 3 = Low, unlikely to be available or available only in
few countries.
• Quality: Provides an indication of data quality. 1 = High, reliable and of good quality,
2 = Medium, generally usable but with caveats, 3 = Low, poor and unreliable in most
instances.
• Remarks: Other remarks/comments specific to each input parameter.
While data availability does vary from one country to another, this provides the general indication
of data availability and quality for Asian countries.
Auxiliary Statistics and other indicators
To be able to benchmark the air pollution and GHG emissions from different countries or cities,
auxiliary statistics, such as socioeconomic parameters, will be used as normalizing factors. Some of
these statistics include:
• Population (Total, urban, population with access to electricity)
• Gross domestic product (GDP)
For road transport, fuel type, vehicle type and vehicle-fuel type are parameters that will form
basis for the disaggregation of transport indicators. For electricity, another normalizing factor is
kiloWatt-hours (kWh), which is a measure of electricity.
These statistics may serve as necessary components in deriving the indicators, or as a
complement in their analysis and interpretation.
Observations on transport and energy data availability and quality in Asia8
Limitations of transport and energy data have been documented in several publications and have
also been observed through the data mapping exercise. Some of these limitations are:
1. Available and accessible data are usually presented at very high levels of aggregation
Data can be collected and reported at various levels of aggregation.9 As presented in Box 1,
during vehicle registration, vehicle data per vehicle make, engine type, and others is usually
collected, but vehicle registration data reported are usually summary statistics – total vehicles
8
Patdu, K. (2010). Availability, quality and use of transport and energy data in Asia: A regional case study. Presented at Data and Indicators for
Sustainable Cities Session, Better Air Quality (BAQ) 2010. Singapore, 8 November 2010. Available online:
/>9
The Center for Clean Air Policy. (2010). Data & Capacity Needs for Transportation NAMAs. Report 1: Data Availability. Washington, D.C.
Available online: />
21
registered by vehicle type and fuel type. Often, it is aggregate data which is easily available;
seldom is disaggregated data provided.
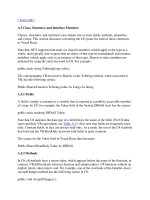
2. Fragmented data generation
The data mapping exercise also highlighted the relationship of different data levels. As illustrated
in Figure 5, plenty of information is generated at the city and/or province level; however, these
are usually stored at the local levels, unless required by the national government.
This is also observed with data collected by consulting firms engaged by government agencies for
different purposes. Only processed data is reported back to government agencies. This result in
an abundance of segmented information which is usually not consolidated (Figure 6). A similar
dynamic is observed with project level data and data from institutions.
3. Routine data generation/collection usually not done for activity data
Often, activity data needed for estimating emissions are not routinely collected, or if they are
collected, are often of limited scope or are outdated. Most are collected on an ad hoc basis for
project specific purposes. When data is available, information/indication of data quality are not
provided. The methodology used in data collected and/or generation is not always clear.
4. Lack of harmonized classification
One of the observations from the data mapping exercise is that definitions of statistics and input
parameters may vary within and between countries. In the Philippines, for instance, different
government agencies use varying vehicle classifications. The vehicle classification used by the
Land Transportation Office is not the same with the one used by the Department of Trade and
Industry or the Bureau of Customs. The same is also observed when attempting to consolidate
data across countries within the region. While there are initiatives for a harmonized classification
system (e.g., at the Association of Southeast Asian Nations (ASEAN) level), they are often works in
progress.
The government’s response time to classify emerging vehicle types usually takes a long time, as in
the case of electric vehicles. This may result to vehicle types which are unaccounted for in national
vehicle fleet counts but are already being used.
22
Box 1. Vehicle registration data flow in Sri Lanka.
During registration for new vehicles, the Department of Motor Traffic (DMT) collects several information
including vehicle make and model, engine number purpose of use and others. In-use vehicles pay the
number,
use
annual revenue license wherein vehicle class, fuel use, vehicle weight are collected. However, data
reported by Department of Census and Statistics is very limited and aggregated. In this case, only vehicle
.
registrations by vehicle class and fuel used are available. This is usually the most easily accessible
lass
his
information to data users.
Data quality checks usually also decrease as moving up from the data generator/source (DMT) to those
/source
disseminating the information; thus increasing potential for errors and uncertainties.
Source: CAI-Asia, 2010.
Figure 5. Relationship of different data
levels
Source: Clean Air Asia, 2010.
Figure 6. Fragmented data with consultants
Source: Clean Air Asia, 2010.
23