Tài liệu Body Size: The Structure and Function of Aquatic Ecosystems pptx
Bạn đang xem bản rút gọn của tài liệu. Xem và tải ngay bản đầy đủ của tài liệu tại đây (5.28 MB, 357 trang )
This page intentionally left blank
Body Size: The Structure and Function of Aquatic Ecosystems
Ecologists have long struggled to predict features of ecological systems, such as
the numbers and diversity of organisms. The wide range of body sizes in ecological
communities, from tiny microbes to large animals and plants, is emerging as the
key to prediction. Based on the relationship of body size with key biological rates
and with the physical world experienced by aquatic organisms, we may be able to
understand patterns of abundance and diversity, biogeography, interactions in food
webs and the impact of fishing, adding up to a potential ‘periodic table’ for ecology.
Remarkable progress on the unravelling, describing and modelling of aquatic food
webs, revealing the fundamental role of body size, makes a book emphasizing
marine and freshwater ecosystems particularly apt. Here, the importance of body
size is examined at a range of scales, yielding broad perspectives that will be of
interest to professional ecologists, from students to senior researchers.
A
LAN G. HILDREW is Professor of Ecology in the School of Biological and
Chemical Sciences at Queen Mary, University of London.
D
AVID G. RAFFAELLI is Professor of Environmental Science at the University of
York.
R
ONNI E DMONDS-BROWN is a Senior Lecturer in Environmental Sciences at the
University of Hertfordshire.
Body Size
The Structure and Function
of Aquatic Ecosystems
Edited by
ALAN G. HILDREW
School of Biological and Chemical Sciences, Queen Mary, University of London, UK
DAVID G. RAFFAELLI
Environment Department, University of York, UK
RONNI EDMONDS-BROWN
Division of Geography and Environmental Sciences, University of Hertfordshire, UK
CAMBRIDGE UNIVERSITY PRESS
Cambridge, New York, Melbourne, Madrid, Cape Town, Singapore, São Paulo
Cambridge University Press
The Edinburgh Building, Cambridge CB2 8RU, UK
First published in print format
ISBN-13 978-0-521-86172-4
ISBN-13 978-0-521-67967-1
ISBN-13 978-0-511-29508-9
© British Ecological Society 2007
2007
Information on this title: www.cambridge.org/9780521861724
This publication is in copyright. Subject to statutory exception and to the provision of
relevant collective licensing agreements, no reproduction of any part may take place
without the written
p
ermission of Cambrid
g
e University Press.
ISBN-10 0-511-29508-1
ISBN-10 0-521-86172-1
ISBN-10 0-521-67967-2
Cambridge University Press has no responsibility for the persistence or accuracy of urls
for external or third-party internet websites referred to in this publication, and does not
g
uarantee that any content on such websites is, or will remain, accurate or a
pp
ro
p
riate.
Published in the United States of America by Cambridge University Press, New York
www.cambridge.org
hardback
paperback
paperback
eBook (EBL)
eBook (EBL)
hardback
Contents
List of contributors page vii
Preface ix
1 The metabolic theory of ecology and the role of body size in
marine and freshwater ecosystems
James H. Brown, Andrew P. Allen and James F. Gillooly 1
2 Body size and suspension feeding
Stuart Humphries 16
3 Life histories and body size
David Atkinson and Andrew G. Hirst 33
4 Relationship between biomass turnover and body size for stream
communities
Alexander D. Huryn and Arthur C. Benke 55
5 Body size in streams: macroinvertebrate community size
composition along natural and human-induced environmental
gradients
Colin R. Townsend and Ross M. Thompson 77
6 Body size and predatory interactions in freshwaters: scaling from
individuals to communities
Guy Woodward and Philip Warren 98
7 Body size and trophic cascades in lakes
J. Iwan Jones and Erik Jeppesen 118
8 Body size and scale invariance: multifractals in
invertebrate communities
Peter E. Schmid and Jenny M. Schmid-Araya 140
9 Body size and biogeography
B. J. Finlay and G. F. Esteban 167
10 By wind, wings or water: body size, dispersal and
range size in aquatic invertebrates
Simon D. Rundle, David T. Bilton and Andrew Foggo 186
11 Body size and diversity in marine systems
Richard M. Warwick 210
12 Interplay between individual growth and population feedbacks
shapes body-size distributions
Lennart Persson and Andre
´
M. De Roos 225
13 The consequences of body size in model microbial ecosystems
Owen L. Petchey, Zachary T. Long and Peter J. Morin 245
14 Body size, exploitation and conservation of marine organisms
Simon Jennings and John D. Reynolds 266
15 How body size mediates the role of animals in nutrient cycling
in aquatic ecosystems
Robert O. Hall, Jr., Benjamin J. Koch, Michael C. Marshall,
Brad W. Taylor and Lusha M. Tronstad
286
16 Body sizes in food chains of animal predators and parasites
Joel E. Cohen 306
17 Body size in aquatic ecology: important, but not the whole story
Alan G. Hildrew, David G. Raffaelli and Ronni Edmonds-Brown 326
Index 335
CONTENTSvi
Contributors
Andrew P. Allen National Center for
Ecological Analysis and Synthesis, Santa
Barbara, CA 93101, USA.
David Atkinson Population and
Evolutionary Biology Research Group,
School of Biological Sciences, The University
of Liverpool, Biosciences Building, Crown
Street, Liverpool L69 7ZB, UK.
Arthur C. Benke Aquatic Biology
Program, Box 870206, Department of
Biological Sciences, University of Alabama,
Tuscaloosa, AL 35487-0206, USA.
David T. Bilton Marine Biology and
Ecology Research Centre, University of
Plymouth, Plymouth PL4 8AA, UK.
James H. Brown Department of Biology,
University of New Mexico, Albuquerque,
NM 87131, USA.
Joel E. Cohen Laboratory of Populations,
Rockefeller and Columbia Universities,
1230 York Avenue, Box 20, New York,
NY 10021-6399, USA.
Andre
´
M. De Roos Institute of
Biodiversity and Ecosystems, University of
Amsterdam, P.O.B. 94084, NL-1090 GB
Amsterdam, the Netherlands.
Ronni Edmonds-Brown Division of
Geography and Environmental Sciences,
University of Hertfordshire, College Lane,
Hatfield AL10 9AB, UK.
G. F. Esteban School of Biological and
Chemical Sciences, Queen Mary, University
of London, East Stoke, Wareham Dorset
BH20 6BB, UK.
B. J. Finlay School of Biological and
Chemical Sciences, Queen Mary, University
of London, East Stoke, Wareham Dorset
BH20 6BB, UK.
Andrew Foggo Marine Biology and
Ecology Research Centre, University of
Plymouth, Plymouth PL4 8AA, UK.
James F. Gillooly Department of
Zoology, University of Florida, Gainesville,
FL 32607, USA.
Robert O. Hall, Jr. Department of
Zoology and Physiology, University of
Wyoming, Laramie, WY 82071, USA.
Alan G. Hildrew School of Biological
and Chemical Sciences, Queen Mary,
University of London,
London E1 4NS, UK.
Andrew G. Hirst British Antarctic
Survey, High Cross, Madingley Road,
Cambridge CB3 0ET, UK.
Stuart Humphries Department of
Animal and Plant Sciences, University
of Sheffield, Western Bank, Sheffield S10
2TN, UK.
Alexander D. Huryn Aquatic Biology
Program, Box 870206, Department of
Biological Sciences, University of Alabama,
Tuscaloosa, AL 35487-0206, USA.
Simon Jennings Centre for
Environment, Fisheries and Aquaculture
Science (CEFAS), Lowestoft Laboratory,
NR33 0HT, UK.
Erik Jeppesen Department of
Freshwater Ecology, National
Environmental Research Institute,
Denmark and Department of Plant Biology,
University of Aarhus, Ole Worms Alle
´
,
Aarhus, Denmark.
J. Iwan Jones Centre for Ecology and
Hydrology Dorset, Dorchester DT2 8ZD, UK.
Benjamin J. Koch Department of
Zoology and Physiology, University of
Wyoming, Laramie, WY 82071, USA.
Zachary T. Long Institute of Marine
Sciences, University of North Carolina at
Chapel H ill, 3431 Arendell Street, Morehead
City, NC 28557 and Virginia Institute of
Marine Science, The College of William and
Mary, Gloucester Point, VA 23062.
Michael C. Marshall Department of
Zoology and Physiology, University of
Wyoming, Laramie, WY 82071, USA.
Peter J. Morin Department of Ecology,
Evolution & Natural Resources, 14 College
Farm Rd., Cook College, Rutgers University,
New Brunswick, NJ 08901, USA.
Lennart Persson Department of Ecology
and Environmental Science, Umea
88
University, S-901 87 Umea
88
, Sweden.
Owen L. Petchey Department of
Animal and Plant Sciences, University of
Sheffield, Western Bank, Sheffield S10
1SA, UK.
David G. Raffaelli Environment
Department, University of York,
Heslington, York Y010 SDD, UK.
John D. Reynolds Department of
Biological Sciences, Simon Fraser
University, Burnaby, BC, V5A 1S6, Canada.
Simon D. Rundle Marine Biology and
Ecology Research Centre, University of
Plymouth, Plymouth PL4 8AA, UK.
Peter E. Schmid School of Biological
and Chemical Sciences, Queen Mary,
University of London, London E1 4NS, UK
and Institute of Freshwater Ecology,
University of Vienna, 1090 Wien,
Althanstrasse 14, Austria.
Jenny M. Schmid-Araya School of
Biological and Chemical Sciences, Queen
Mary, University of London, London
E1 4NS, UK.
Brad W. Taylor Department of Zoology
and Physiology, University of Wyoming,
Laramie, WY 82071, USA.
Ross M. Thompson School of Biological
Sciences, Building 18, Monash University,
Victoria 3800, Australia.
Colin R. Townsend Department of
Zoology, University of Otago, 340 Great
King Street, Dunedin 9054, New Zealand.
Lusha M. Tronstad Department of
Zoology and Physiology, University of
Wyoming, Laramie, WY 82071, USA.
Philip Warren Department of Animal
and Plant Sciences, University of Sheffield,
Western Bank, Sheffield S10 2TN, UK.
Richard M. Warwick Plymouth Marine
Laboratory, Prospect Place, The Hoe,
Plymouth, PL1 3DH, UK.
Guy Woodward School of Biological and
Chemical Sciences, Queen Mary, University
of London, London E1 4NS, UK.
LIST OF CONTRIBUTORSviii
Preface
More than ten years ago, two of us (AGH and DGR) were lucky enough to edit a
previous symposium of the British Ecological Society (BES) – Aquatic Ecology: Scale,
Pattern and Process (Giller, Hildrew & Raffaelli, 1994). In the Introduction to that
volume, we pointed out that the BES had not devoted a single previous sympo-
sium to aquatic ecosystems. Evidently we did not change the culture, since the
Body Size symposium held at the University of Hertfordshire in September 2005
was only the second! Aquatic Ecology: Scale, Pattern and Process had two objectives:
(i) to explore how the scale of approach affected the patterns that were detected
and the processes that appeared to be important, and (ii) to compare freshwater
and marine ecosystems. In Body Size: The Structure and Function of Aquatic Ecosystems,
both those questions of scale and comparison among systems are very much still
alive as continuing themes. Body size determines overwhelmingly the scale at
which organisms perceive and navigate through their physical world, and the
contrasts between freshwater and marine ecosystems remain evident. Body size
is a species trait with implications beyond scale, however, and we believe that
the present volume shows that more similarities than differences are evident
among the diverse aquatic systems considered. Indeed, several authors argue
here that fundamental ecological processes are revealed by comparing marine,
freshwater and terrestrial systems.
In organizing this meeting, we were well aware of the increasing interest in
body size from the wider ecological community over the past 30 years, as well as
the technical challenge involved in exploring body-size data. Of course, the
fascination with body size has a much longer history in ecology and was prom-
inent in the writings, for example, of Alfred Wallace (1858) and Charles Elton
(1927), the latter having discussed at length its relevance to trophic interactions
(see review by Warren, 2005). It was R. H. Peters’ (1983) elegant exposition of
the physiological, environmental and ecological correlates of body size that
re-ignited modern interest, however, and which led indirectly to an explosion
in the macroecological literature over the past ten years (Blackburn & Gaston,
2003), to the metabolic theory of ecology (Brown et al., 2004) and indeed to this
present volume. All of the papers presented at the Hatfield meeting connect
with one or more of these themes and in many cases attempt to integrate aspects
of body-size research that were previously treated separately. A focus on aquatic
systems seemed appropriate because aquatic ecologists have historically been
particularly prominent in the debate. Thus, Hardy (1924) was amongst the first to
point out the significance of ontogenic (sized-based) shifts in the food webs
supporting fisheries, Ryther (1969) illustrated the effects of predator and prey
body sizes on food-chain length and global patterns of marine productivity, whilst
Hutchinson (1959) provided a classic account of body size and species coexistence.
It may well be that patterns and processes related to body size are particularly
important in aquatic systems, or at least are more obvious.
We asked the author(s) of each paper to examine the importance and role of
body size in the systems in which they work. Essentially the book builds from the
level of the individual and a consideration of body size as a species trait
(Humphries; Atkinson & Hirst; Huryn & Benke; Townsend & Thompson), through
food webs and communities (Woodward & Warren; Jones & Jeppesen; Schmid &
Schmid-Araya), to body-size related macroecological patterns in aquatic systems
(Finlay & Esteban; Rundle, Bilton & Foggo; Warwick), to dynamics and patterns in
whole communities and ecosystems (Persson & De Roos; Petchey, Long & Morin;
Jennings & Reynolds; Hall et al.; Cohen). Jim Brown and colleagues set the scene
with a ‘wet’ exposition of metabolic theory, and although we did not ask contrib-
utors explicitly to test these ideas several did. The meeting certainly generated an
old-fashioned sense of community and of excitement in what people had to say,
though it was just as apparent how fragmented the community is, as was
reflected in the examples chosen to illustrate particular points and the literature
cited by authors from different ‘stables’ and backgrounds.
We hope that this book reflects just a little of this excitement and serves
as a useful synthesis of this area of ecology. Finally, we wish to thank all the
contributors for their efforts and remarkable efficiency, the British Ecological
Society and the Freshwater Biological Association for their support, and the
local organizers at the University of Hertfordshire for all their hard work.
Alan Hildrew,
Dave Raffaelli,
Ronni Edmonds-Brown.
References
Blackburn, T. M. & Gaston, K. J. (2003).
Macroecology: Concepts and Consequences.
Oxford: Blackwell Science.
Brown, J. H., Gillooly, J. F., Allen, A. P.,
Savage, V. M. & West, G. B. (2004). Towards
a metabolic theory of ecology. Ecology, 85,
1771–1789.
Elton, C. S. (1927). Animal Ecology. London:
Sidgwick & Jackson Ltd.
Giller, P. S., Hildrew, A. G. & Raffaelli, D. G.
(eds.) (1994). Aquatic Ecology: Scale, Pattern
and Process. The 34th Symposium of the
British Ecological Society. Oxford: Blackwell
Science.
PREFACEx
Hardy, A. C. (1924). The herring in relation to
its animate environment. Part 1. The food
and feeding habits of the herring with
special reference to the east coast of
England. Fisheries Investigations Series II,
7(3), 1–53.
Hutchinson, G. E. (1959). Homage to Santa
Rosalia, or why are there so many kinds of
animals? American Naturalist, 32, 571–581.
Peters, R. H. (1983). The Ecological Implications of
Body Size. New York: Cambridge University
Press.
Ryther, J. H. (1969). Photosynthesis and fish
production in the sea. Science, 166, 72–76.
Wallace, A. R. (1858). On the tendency of
varieties to depart indefinitely from the
orginal type. In C. R. Darwin and
A. R. Wallace: On the tendency of species to
form varieties, and on the perpetuation of
varieties and species by natural selection.
Journal of the Proceedings of the Linnean Socioty,
Zoology, 20 August 1858, 3, 45–62.
Warren, P. H. (2005). Wearing Elton’s wellingtons:
why body size still matters in food webs. In
Dynamic Food Webs: Multispecies Assemblages,
Ecosystem Development, and Environmental
Change, eds. P. C. de Ruiter, V. Wolters &
J. C. Moore. San Diego: Academic Press.
PREFACE xi
CHAPTER ONE
The metabolic theory of ecology
and the role of body size in marine
and freshwater ecosystems
JAMES H. BROWN
University of New Mexico, Albuquerque
ANDREW P. ALLEN
National Center for Ecological Analysis and Synthesis, Santa Barbara
JAMES F. GILLOOLY
University of Florida, Gainesville
Introduction
Body size is the single most important axis of biodiversity. Organisms range in
body size over about 22 orders of magnitude, from tiny bacteria such as
Mycoplasma weighing 10
À13
g to giant Sequoia trees weighing 10
9
g. Such size
variation is a pervasive feature of aquatic ecosystems, where the size spectrum
spans at least 20 orders of magnitude, from the smallest free-living bacteria
at about 10
À12
g to the great whales at about 10
8
g (e.g., Sheldon et al., 1972;
Kerr & Dickie, 2001). Nearly all characteristics of organisms, from their struc-
ture and function at molecular, cellular and whole-organism levels to ecological
and evolutionary dynamics, are correlated with body size (e.g., Peters, 1983;
McMahon & Bonner, 1983; Calder, 1984; Schmidt-Nielsen, 1984). These relation-
ships are almost always well described by allometric equations, power functions
of the form:
Y ¼ Y
0
M
b
(1:1)
where Y is a measure of some attribute , Y
0
is a normalization constant, M is body
mass, and b is a s caling exponent (Thompson, 19 17;Huxley,1932). A longstanding
puzzle has been why empirically estimated values of b are typically close to
multiples of 1/4: 3/4 for whole-organism me ta bolic ra tes (Savage et al., 2004a)and
rates of biomass production (Ernest et al. 2003), À1/4 for mass-specific metabolic
rates a nd most other biological rates such as the turnover o f cellular constituents
(Gillooly et al., 2005a), population growth rates (Savage et al., 2004b)andratesof
molecular evolution (Gillooly et al., 2005 b), and 1 /4 for b iological t imes such a s cell
cycle time, lifespan and generation time (Gillooly et al., 2001, 2002).
Recent theoretical advances in biological scaling and metabolism represent
tremendous progress in solving this puzzle. The pervasive quarter-power
Body Size: The Structure and Function of Aquatic Ecosystems, eds. Alan G. Hildrew, David G. Raffaelli and Ronni
Edmonds-Brown. Published by Cambridge University Press. # British Ecological Society 2007.
exponents are due to the fractal-like design of the networks and surfaces that
supply energy and materials used by cells in biological metabolism (West et al.,
1997, 1999). One additional advance has strengthened and extended this theo-
retical foundation. The well documented exponential effect of temperature on
metabolic rate can be incorporated by adding a Boltzmann–Arrhenius factor,
e
ÀE/kT
, to Eq. (1.1). Whole organism metabolic rate or production, P, can then be
expressed as:
P ¼ P
0
M
3=4
e
ÀE=kT
(1:2)
where E is the activation energy, k is Boltzmann’s constant (8.62 Â10
À5
eV/K),
and T is absolute temperature in degrees Kelvin (Gillooly et al., 2001, 2002).
Therefore, mass-specific metabolic rate, B, and most other rates can be
expressed as:
B ¼ P=M ¼ B
0
M
À1=4
e
ÀE=kT
(1:3)
where B
0
is another normalization constant. The addition of temperature to this
model proved critical to the development of a metabolic theory of ecology (MTE)
(Brown et al., 2004). MTE incorporates these fundamental effects of body size and
temperature on individual metabolic rate to explain patterns and processes at
different levels of biological organization: from the life histories of individuals,
to the structure and dynamics of populations and communities, to the fluxes
and pools of energy and materials in ecosystems. Brown et al.(2004 ) began to
develop MTE in some detail, made many testable predictions, and evaluated
some of these predictions, using data compiled from the literature for a wide
variety of ecological phenomena, taxonomic and functional groups of organ-
isms, and types of ecosystems.
Here we apply the metabolic theory of ecology to focus on some important
correlates and consequences of body size in marine and freshwater ecosystems.
In so doing, we build on a rich tradition that extends back over a century. Many
of the most eminent aquatic ecologists have contributed. Several themes have
been pursued. With respect to population dynamics and species interactions,
this includes work from Gause (1934), Hutchinson (1959), Brooks and Dodson
(1965), Paine (1974), Leibold and Wilbur (1992) and Morin (1995, 1999). With
respect to distributions of biomass, abundance and energy use across species,
this includes work from Sheldon and Parsons (1967), Sheldon et al.(1972, 1977),
Cyr and Peters (1996) and Kerr and Dickie (2001). With respect to food webs, this
includes work from Lindeman (1942), Odum (1956), Hutchinson (1959),
Carpenter and Kitchell (1988), Sprules and Bowerman (1988) and Cohen et al.
(2003). Finally, with respect to nutrient relations and ecological stochiometry,
this includes work from Redfield (1958), Schindler (1974), Wetzel (1984) and,
more recently, Sterner and Elser (2002). Many of these themes have been
addressed by the contributors to this volume.
J. H. BROWN ET AL.2
MTE provides a conceptual framework for understanding the diverse effects
of body size in aquatic ecosystems (see also Peters, 1983;Cyr&Pace,1993;Cyr,
2000; Kerr & Dickie, 2001; Gillooly et al., 2002; Brown & Gillooly, 2003;Brown
et al., 2004; Allen et al., 2005; Gillooly et al., 2006). MTE is based on well-
established fundamental principles of physics, chemistry and biology, makes
explicit, testable, quantitative predictions, and synthesizes the roles of indi-
vidual organisms in populations, communities and ecosystems. The literature
on body size and metabolism in general, and on aquatic ecosystems in partic-
ular, is too vast to summarize here. The references cited above and below are
just a few of the relevant publications, but they will give the interested reader a
place to start.
Background
For what follows, we will assume that Eqs. (1.2) and (1.3) capture the fundamen-
tal effects of body size and temperature on metabolic rate. As the examples
below will show, these equations do not account for all observed variation. They
do, however, usually account for a substantial portion of the variation within
and across species, taxonomic and functional groups, and in ecosystems where
body size varies by orders of magnitude. Moreover, fitting Eq. (1.2)or(1.3) to data
generates precise quantitative predictions that can be used as a point of depar-
ture to evaluate the many factors that may contribute to the residual variation.
These include experimental and measurement error, phylogenetic and environ-
mental constraints, influences of stoichiometry, and the effects of acclimation,
acclimatization and adaptation. Since we present Eqs. (1.2) and (1.3) as assump-
tions, it is important to state that MTE and the underlying models for the scaling
of metabolic rate and other processes with body size and temperature have
received both enthusiastic support and severe criticism. We will not cite or
review these issues and references here, but simply state that we are confident
that most substantive criticisms have been or will be answered, and that the
theory is fundamentally sound.
This volume and this chapter are on the effects of body size on the structure
and dynamics of aquatic ecosystems. Metabolic rate, and other rate processes
controlled by metabolic rate, are strongly affected by both body size and temper-
ature. We can ‘correct’ for variation due to environmental or body temperature
by taking logarithms of both sides of Eq. (1.3) and rearranging terms to give:
lnðBe
E=kT
Þ¼ðÀ1=4Þln ðMÞþln ðB
0
Þ (1:4)
where k is Boltzmann’s constant (¼8.62 Â10
À5
eV/K) and E is the average acti-
vation of metabolic reactions ($0.65 eV; see Brown et al., 2004). Equation (1.4)
shows that, after correcting for temperature, ln(Be
E/kT
) is predicted to be a
linear function of ln(M) with a slope of À1/4. Other allometric scaling relations
can be similarly analyzed using equations that have different values for the
THE METABOLIC THEORY OF ECOLOGY 3
normalization constants and sometimes for the exponents, e.g. 3/4 for whole-
organism metabolic rate (Eq. (1.2)). In aquatic ecosystems, it is reasonable to
assume that the body temperature of an ectotherm is equal to water temper-
ature. Thus, coexisting species of prokaryotes, phytoplankton, protists, zoo-
plankton, other invertebrates and fish can usually be assumed to have the
same body temperature. Additionally, since daily and seasonal variations in
water temperatures are relatively modest, it is often reasonable to take some
average value. Correction for variation in temperature is particularly important
when comparing locations or seasons that differ substantially in water temper-
ature, and when comparing ectotherms and endotherms, which differ substan-
tially in body temperature. In this chapter we have followed these procedures,
and corrected for temperature variation when appropriate.
Individual level: metabolic rate, production and life-history traits
We begin at the level of the individual organism. The first question is whether
metabolic rate varies with body size as predicted by Eqs. (1.2) and (1.3). In Fig. 1.1,
we present temperature-corrected data for whole-organism metabolic rates of
aquatic unicellular eukaryotes, invertebrates and fish. Note that the predicted
slopes of these relationships are close to 3/4. It is apparent that the observed
values cluster around and do not differ significantly from these slopes. These
data confirm a large literature on the body-size dependence of metabolic rates in
a wide variety of aquatic organisms, from unicellular algae and protists to
invertebrates and fish (e.g., Hemmingsen, 1960; Fenchel & Finlay, 1983). Note
also that there is considerable variation around these relationships. It may
appear to be random scatter, but further analysis would probably suggest that
much of it is due to some combination of experimental error, differences in
techniques, evolutionary constraints related to phylogenetic relationships,
y = 0.70x + 18.24
r
2
= 0.97
y
= 0.73x + 19.74
r
2
= 0.97
y
= 0.74x + 20.89
r
2
= 0.79
–10
10
30
–30 300
ln(body mass)
In(metabolic rate *e
E/kT
)
fish
invertebrates
unicells
Figure 1.1 The relationship
between temperature-corrected
metabolic rate, measured in watts,
and the natural logarithm of body
mass, measured in grams.
Metabolic rate is temperature
corrected using the Boltzmann
factor, e
ÀE/kT
, following Eq. (1.2).
Data and analyses from Gillooly
et al.(2001).
J. H. BROWN ET AL.4
body plan, stoichiometry, as well as acclimatization, acclimation and adapta-
tion to different environmental conditions.
The metabolism of an individual organism reflects the energy and material
transformations that are used for both the maintenance of existing structure
and the production of new biomass. Within taxonomic and functional groups,
organisms allocate a relatively constant fraction of metabolism to production
(Ernest et al., 2003). In endotherms, this is typically less than 10%, but in
ectotherms it tends to be of the order of 50%. Consequently, rates of whole-
organism biomass production are predicted to scale according to Eq. (1.2), with
an allometric exponent of 3/4, the same as whole-organism metabolic rate.
Figure 1.2 shows that the temperature-corrected rates of production for algae,
zooplankton and fish cluster closely around a common allometric scaling rela-
tion with an exponent of 0.76, almost identical to the theoretically predicted
value of 3/4. This implies that the relative allocation of energy and materials to
biomass production is indeed similar across most organisms.
It follows from the above discussion and Eq. (1.3) that the mass-specific rate of
ontogenetic growth and development should scale as M
À1/4
, and therefore that
developmental time should scale as M
1/4
.InFig.1.3, we present two examples,
rates of ontogenetic development of zooplankton eggs in the laboratory (panel A)
and fish eggs in the field (panel B) (Gillooly et al., 2002). This is a nice model
system, because the mass of the egg indicates not only the size of the hatchling,
but also the quantity of resources stored in the egg and expended in metabolism
during the course of development. Note that the data for fish eggs in the field give
an exponent, À0.22, very close to the predicted À1/4, but there is considerable
unexplained variation. This is hardly surprising, giving the inherent difficulties in
measuring both development time and temperature under field conditions. The
data for development rate of freshwater zooplankton eggs measured under con-
trolled conditions in the laboratory give an allometric exponent, À0.26, essen-
tially identical to the predicted À1/4. The regression explains 84% of the observed
y = 0.76x + 25.04
r
2
= 0.99
–10
15
40
–40 –10 20
ln(body mass)
ln(production * e
E/kT
)
fish
algae
zooplankton
Figure 1.2 The relationship between
temperature-corrected biomass
production rate, measured in grams
per individual per year, and the
natural logarithm of body mass,
measured in grams. Metabolic rate is
temperature corrected using the
Boltzmann factor, e
ÀE/kT
, following
Eq. (1.2). Data and analyses from Ernest
et al.(2003).
THE METABOLIC THEORY OF ECOLOGY 5
variation in the temperature-corrected data. Interestingly, for ontogenetic growth
rates of adult zooplankton, Gillooly et al.(2002) have shown that stoichiometry,
specifically the whole-body C:P ratio, explains most of the variation that remains
after accounting for the effects of body size and temperature. This supports the
‘growth-rate hypothesis’ and the large body of theoretical and empirical work in
ecological stoichiometry (Elser et al., 1996 ; Elser et al., 2000; Sterner & Elser, 2002).
The growth-rate hypothesis proposes that differences in the C:N:P ratios of organ-
isms are due to differences in the allocation of phosphorus-rich RNA necessary for
growth. For these zooplankton, living in freshwater where phosphorus may be
the primary limiting nutrient, rates of metabolism and ontogenetic growth are
limited by whole-body concentrations of RNA. Not only does the C:P ratio explain
most of the residual variation in development rates as a function of body size in
zooplankton, but it is also related to the body-size dependence of development
itself. Whole-body concentrations of phosphorus-rich RNA scale inversely with
body size, with an exponent of approximately À1/4 in both aquatic and terrestrial
organisms (Gillooly et al., 2005a). Therefore, this example shows how a quanti-
tative prediction from metabolic theory can be used to assess the influence of
other factors, such as stoichiometry, which may account for much of the remain-
ing variation.
Since times are reciprocals of rates, metabolic theory predicts that biological
times should scale with characteristic powers of 1/4. Figure 1.4 shows data for
one such time, maximal lifespan, for a variety of aquatic animals ranging from
zooplankton to fish. The slope of this relationship, 0.23, is very close to the
theoretically predicted value of 1/4, and the fitted regression accounts for the
In(hatching rate *e
E/kT
)
In(hatching rate
*e
E/kT
)
ln(body mass) ln(body mass)
–20
(a) (b)
26
24
22
26
24
22
–7.5 –10 –8 –6 –4
y
= –0.26x + 20.37
r
2
= 0.84
y
= – 0.22x + 22.49
r
2
= 0.24
Figure 1.3 The relationship between temperature-corrected hatching rate, measured
in 1/days, and the natural logarithm of body mass, measured in grams, for zooplankton
eggs in the laboratory (panel A) and fishes in the field (panel B). Hatching rate is
temperature-corrected using the Boltzmann factor, e
ÀE/kT
, following Eq. (1.2). Data and
analyses from Gillooly et al.(2002).
J. H. BROWN ET AL.6
vast majority of variation (r
2
¼0.98). The enormous variation in body size across
these organisms masks considerable unexplained residual variation. It is well
established that even closely related animals of the same body size can differ in
lifespan by at least an order of magnitude. If the first-order effect of temperature
had not been removed, then there would have been even more variation, with
species in cold-water environments living longer than those of similar size in
warmer waters.
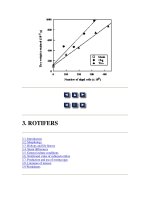
Population and community levels: growth, mortality and abundance
There are two logical benchmarks to measure population growth rate: the
maximal rate, r
max
, and the rate of turnover at steady state. Data on r
max
for a
wide variety of organisms, from unicellular eukaryotes to invertebrates and
vertebrates, have been compiled and analyzed by Savage et al.(2004b). These
data give a slope of À0.23, very close to the predicted À1/4. We have extracted
and plotted the subset of these data for aquatic organisms, including algae,
zooplankton and fish in Fig. 1.5. The slope is a bit lower, À0.20, but the con-
fidence intervals still include the predicted value of À1/4. We conclude that
maximal population-growth rates scale similarly to mass-specific metabolic rate
and follow Eq. (1.3). This is not surprising, since metabolism fuels individual
production, which in turn fuels population growth, thereby determining r
max
.
The rate of population turnover, and hence birth and death rates, should scale
similarly. Figure 1.6 shows the body-mass dependence of mortality rates of fish
in the field. The fitted regression has a slope of À0.24, very close to the predicted
value of À1/4. The À1/4 power scaling of natural mortality may come as a
surprise to many ecologists because mortality in the field is generally thought
to be controlled by extrinsic environmental conditions, such as predation, food
shortage or abiotic stress, rather than to intrinsic biological traits such as
metabolic rate. The majority of mortality may indeed be due to predation or
y
=
0.23x
–
19.74
r
2
=
0.98
–30
–20
–20 –10 0 10
–10
ln(body mass)
zooplankton
amphipods
molluscs
fish
In(lifespan/e
E/kT
)
Figure 1.4 The relationship between
temperature-corrected maximum lifespan,
measured in days, and the natural logarithm
of body mass, measured in grams, for
various aquatic organisms. Lifespan is
temperature-corrected using the Boltzmann
factor, e
ÀE/kT
, following Eq. (1.2). Data and
analyses from Gillooly et al.(2001).
THE METABOLIC THEORY OF ECOLOGY 7
other extrinsic factors, but birth and death rates must match, and the rate
of production must offset the rate of mortality for a population to persist.
Population-turnover rate is another of those phenomena which is controlled
by metabolic rate and, consequently, shows characteristic 1/4-power scaling.
Metabolic rate determines the rate of population turnover, but what about
the abundances or steady-state densities of popula tions in the field ? Based on
data for mammals, Damuth (1981) showed that population density scales as
M
À3/4
. This is what would be expected if populations of a guild or trophic level
had equal rates of resource supply, R, because the steady-state population
density, N, should be proportional to the rate of resource supply divided
by the resource use or field m etabolic rate per individual, P,soN /R/P /
M
0
/M
3/4
/M
À3/4
. Recent compilations of data on population density as a func-
tion of mass generally support this prediction (Damuth, 1981; Belgran o et al.,
2002;Li,2002; Allen et al., 200 2;Brownet al., 2004). For example, Li (2002) showed
that the densities of morphospecies of phytoplankton in the North Atlantic
scaled as M
À0.78
,whereM is cell carbon mass. An important community-level
consequence of population density or number of individuals per area, N,
y
=
–0.20x
+
21.90
r
2
=
0.97
15
–30 –5 20
20
25
30
ln(body mass)
r
max
*e
E/kT
In( )
algae
zooplankton
fish
Figure 1.5 The relationship between the
temperature-corrected maximum rate of
population growth (i.e. r
max
), measured in
1/days, and the natural logarithm of body
mass, measured in grams, for various
aquatic organisms. R
max
is temperature-
corrected using the Boltzmann factor,
e
ÀE/kT
, following Eq. (1.2). Data and analyses
from Savage et al.(2004b).
y
=
–0.24x
+
25.04
r
2
=
0.47
16
–5 7.5 20
22
28
ln(body mass)
In(mortality rate *e
E/kT
)
Figure 1.6 The relationship between the
temperature-corrected mortality rate of
marine fishes in the field, measured in
1/years, and the natural logarithm of body
mass, measured in grams. Mortality rate is
temperature-corrected using the Boltzmann
factor, e
ÀE/kT
, following Eq. (1.2). Data and
analyses from Savage et al.(2004b).
J. H. BROWN ET AL.8
scaling as M
À3/4
and whole-organism f ield metabolic rate o r energy use per
individual, P,scalingasM
3/4
, is that the rate of community energy use per unit
area, E, is independent of body size: E /NP /M
À3/4
M
3/4
/M
0
.Damuth(1981)called
this the e nergy e quivalence rule.
If the abundance and energy use of populations scale predictably with body
size, these relationships are of potentially great interest to ecologists. However,
care should be taken in making and testing these predictions of MTE for several
reasons. First, the assumption of equal rates of resource supply is difficult to
evaluate. It is likely that species in different guilds, functional groups and trophic
levels will have quite different resource availability. This could even be true for
members of the same guild or trophic level. Second, resource supply sets only an
upper bound on population density. Predation, competition and other limiting
factors may cause the steady-state density to be well below this limiting bound.
Third, the above two factors can cause considerable variation, as much as several
orders of magnitude, in the observed densities of species populations in the field.
Fourth, data are often plotted with each point representing a species, but in
organisms with indeterminate growth and consequently wide variation in body
size, it may be difficult to estimate the average body mass and abundance of a
species. If the organisms really do use the same resources, it is more logical to
estimate the upper bound by summing the numbers of individuals of all species
in a body-size interval. Ackerman et al.(2004) performed such an analysis for all of
the fish coexisting at a site on the Great Barrier Reef, and found the predicted
M
À3/4
scaling – except for the smallest size classes, which probably share food
resources with invertebrates. We conclude that metabolic rate powerfully
constrains the abundance of organisms in species populations, functional or tro-
phic groups, and body-size categories, but, again, care should be exercised in
making an d testing predictions b ase d on metabolic theory.
Ecosystem level: flux and storage of energy and materials
Through their metabolism, organisms contribute to the flows of energy and
elements in ecosystems. These flows include not only the quantitatively domi-
nant components of the carbon cycle, but also those involving critical limiting
nutrients, such as phosphorus or nitrogen, that together with carbon, comprise
the ‘Redfield Ratio’. Metabolic theory provides a conceptual basis for predicting,
measuring and understanding the roles of different kinds of organisms in the flux
and storage of elements in ecosystems. The total biomass per unit area, W,is
simply the sum ofthe body mass of all individuals. For organisms ofsimilar size, it
can be estimated by taking the product of the population, N,andthebodymass,
M. Similarly, the store of each element in living biomass per unit area, S,is:
S ¼
X
i
0
½X
i
N
i
M
i
(1:5)
THE METABOLIC THEORY OF ECOLOGY 9
where X is the whole-body concentration of substance X, and the subscript i
denotes a species, developmental stage or body-size class, functional or trophic
group, which should be analysed separately for accurate accounting. To a first
approximation, the turnover rate of these materials is proportional to mass-
specific metabolic rate, B, so the rate of flux, F,is
F ¼
X
i
0
½Y
i
N
i
B
i
(1:6)
where Y is an element-specific constant required because turnover rates vary
widely for different kinds of organisms, depending in part on the form in which
they are stored (e.g. structural carbon in plants, and calcium and phosphorus in
the shells of molluscs and the bones of vertebrates). Knowing Y, it is also then
possible to use the general mass and temperature dependence of metabolic rate
to estimate the turnover rate of a particular element.
We illustrate the potential applications of this framework with two examples.
First, we show the relationship between the rate of carbon turnover and plant
size for freshwater and marine ecosystems, where the primary producers are
predominantly phytoplankton, and for wetlands, where the primary producers
are predominantly herbaceous plants (Fig. 1.7). These data have not been tem-
perature corrected due to difficulties in estimating the relevant temperatures in
these ecosystems, so temperature probably accounts for substantial residual
variation. Nevertheless, the regression has a slope of À0.21, close to the pre-
dicted value of À1/4, fits the data well for both phytoplankton in open waters
and herbaceous plants in wetlands, and accounts for about 80% of the observed
variation. Furthermore, Allen et al.(2005) show that this same relationship can
be extended to include terrestrial ecosystems, where the dominant plants vary
in size from herbs in grasslands to trees in forests.
y = –0.21x – 2.83
r
2
= 0.80
–5
–20 –10 100
–2
1
ln(body mass)
In(carbon turnover rate)
phytoplankton
wetlands
Figure 1.7 The relationship
between carbon turnover rate,
measured as 1/days, and the
natural logarithm of average
plant mass, measured in grams.
Data have not been temperature-
corrected because environmental
temperatures were not reported.
Analyses from Brown et al.(2004)
and Allen et al.(2005).
J. H. BROWN ET AL.10
Allen et al.(2005) further show how this framework can be extended to
understand the roles of different sizes and temperatures of plants in the flux
and storage of carbon, and hence in the carbon cycle at scales from local
ecosystems to the globe. Belgrano et al.(2002) developed another extension,
showing that plant density across the spectrum of plant sizes from algae to trees
and across a range of ecosystem types from oceans, freshwaters, wetlands,
grasslands and forests shows the predicted M
À3/4
scaling. These examples
show how MTE can be applied to make more explicit and quantitative links
between the processing of energy and elements at the individual level to the
flux, storage and turnover of these elements at the level of ecosystems.
Our second example concerns the role of metabolism in trophic relationships,
including the structure and dynamics of food webs. Above, we have shown how
MTE can be applied to understand the M
À3/4
scaling and the M
0
energy equi-
valence observed empirically within many functional groups and trophic levels.
The theory can also be applied to understand the body-size structure of food
webs and the flow of energy and materials between trophic levels. Brown et al.
(2004) developed quantitative expressions for the ratios for consumer:producer
ratios of: (i) metabolic energy flux, F
1
/F
0
; (ii) biomass, W
1
/W
0
; and (iii) abundance,
N
1
/N
0
; where the subscripts 0 and 1 denote any given trophic level and the next
highest level respectively. For aquatic ecosystems, we can usually assume that
all organisms (except for endotherms, which should be considered separately)
are operating at approximately the same temperature. Then these ratios are:
for energy flux:
F
1
=F
0
¼ i
1
N
1
M
1
3=4
=i
0
N
0
M
0
3=4
¼ (1:7)
where i
0
and i
1
are the normalization constants for the field metabolic rates of
the producers and consumers organisms, respectively;
for biomass:
W
1
=W
0
¼ N
1
M
1
=N
0
M
0
/ ðM
0
=M
1
Þ
À1=4
(1:8)
and for abundance:
N
1
=N
0
/ ðM
0
=M
1
Þ
3=4
(1:9)
The ratio for energy flow, a, which must always be <1, is the traditional
Lindeman efficiency that has been the subject of so much discussion and inves-
tigation in ecology. It is apparent from inspection of the above equations that
the M
3/4
scaling of production is an important factor affecting a. If the body-mass
ratio of producer to consumer is large, and contributions to this symposium
suggest that it is often in the range of 100–500 in aquatic ecosystems (see also
Humphries, this volume; Woodward & Warren, this volume; Cohen, this vol-
ume), then a large component of the energy dissipated between trophic levels
will be due simply to the allometry of production rates. In addition to body size
THE METABOLIC THEORY OF ECOLOGY 11