Tài liệu PRICE OUTLOOK DROPS TO LOWEST POINT IN 24 YEARS ppt
Bạn đang xem bản rút gọn của tài liệu. Xem và tải ngay bản đầy đủ của tài liệu tại đây (1.12 MB, 10 trang )
MEDIA RELEASE
Tuesday, 8 January 2013
PRICE OUTLOOK DROPS TO LOWEST
POINT IN 24 YEARS
Australian businesses are looking to negotiate a post-Christmas spending slump through
continued discounting, with the outlook for selling prices during the first quarter of this year
falling to a historic low.
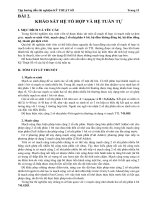
The latest data from Dun & Bradstreet's National Business Expectations Survey shows the
selling price expectation index dropping to three points – its lowest level since the data was
first analysed by D&B in 1988, and 26 points below the 10-year average index.
Actual selling prices have now tracked below the expectations of business executives for 10
consecutive quarters, suggesting their businesses are facing an ongoing demand for discounts
by their customers.
In tandem with lower selling prices, businesses are anticipating reduced activity; with
expectations for both their sales and inventory levels pulling back sharply from the previous
quarter’s expectations.
The D&B sales expectations index has dropped 14 points from a relative high in the previous
quarter, to 19. These lower expectations are matched by survey findings that more than 57 per
cent of businesses have identified ‘demand for their products’ as the main barrier to growing
their business in the year ahead.
9
3
0
10
20
30
40
50
60
Sep-09 Dec-09 Mar-10 Jun-10 Sep-10 Dec-10 Mar-11 Jun-11 Sep-11 Dec-11 Mar-12 Jun-12 Sep-12 Dec-12 Mar-13
Net Per Cent With Increases
Quarter
Selling Prices: D&B Indexes Sep Qtr 2009 to Mar Qtr 2013
Expected
Expected index 10-year average = 29
Actual
MEDIA RELEASE
Inventories expectations are following this trend, with the index retreating from 24, to 16; an
indication that businesses are looking to hold less stock in anticipation of sluggish spending
activity.
The selling prices, sales and inventories data reflect a continued sense that consumers and
businesses will remain cautious about how they spend their money in 2013.
According to Dun & Bradstreet’s CEO, Gareth Jones, businesses are continuing to focus on
discounting to encourage spending.
“We know that there is traditionally a drop off in spending following the Christmas period as
consumers play catch-up with their household budgets and debts following an often expensive
holiday period,” he said.
“These findings suggest that businesses are planning to negotiate the spending slump by
extending discounting through the New Year and by managing their stock carefully.
“Although the most recent data has taken selling price expectations to a new low, it is part of a
long downward trend that suggests ongoing discounting has become the new normal,” said Mr
Jones.
Profit expectation is the only D&B indicator to increase, moving upwards for the second
consecutive quarter to an index of 23, and suggesting that Australian businesses are optimistic
that their adjustments to selling prices and expenses will pay off.
The latest outlook for capital investment has fallen away marginally from 15 to an index of 14;
reflecting a correction in expectations following a significant drop in the actual capital
investment index for the September 2012 quarter to minus five.
In a nod to the broader economic outlook, employment expectations remain flat, with the D&B
index sitting at the 10-year expected index average of one for the second consecutive quarter.
The actual employment result also remains negative, with the D&B index at minus 2.
Stephen Koukoulas, Dun & Bradstreet's Economic Advisor, highlighted the fall in selling prices
as a reason why the RBA is on track to cut interest rates early in 2013.
“The sharp fall in expected selling prices points to very low inflation outcomes for both the
December and March quarters,” he said.
“Consequently, it remains likely that the inflation rate will remain near the bottom of the RBA
target band, which will be a critical issue for the RBA when it decides future interest rate
settings.
“The Business Expectations Survey also shows softer activity, with sales weakening and
employment conditions remaining flat. The economy is clearly in a temporary lull with the key
question as we move into 2013: is monetary policy sufficiently easing to spark stronger activity
through the year?” Mr Koukoulas added.
MEDIA RELEASE
The latest D&B National Business Expectations Survey shows…
Outlook for the March quarter 2013
• The selling prices index is down nine points to an index of 3, the lowest since the survey
began in 1988 and now 26 points below the 10-year average of 29.
• Sales expectations are down 14 points to an index of 19, and are now seven points above
the 10-year average index of 12.
• Employment expectations are unchanged at an index of one, which is now in-line with
the 10-year average index.
• Capital investment expectations are down one point at an index of 14, nine points above
the average index (5) of the last 10 years.
• The inventory index is down eight points to an index of 16, the second highest in nine
years and is now 13 points above the 10-year average index of 3.
• Profits expectations are up three points to an index of 23, the highest in eight quarters
and now 18 points above the 10-year average index.
Issues expected to influence operations in the March quarter 2013
• 57 per cent of executives expect demand for their products to be the biggest barrier to
growing their business in the year ahead.
• 25 per cent of businesses believe interest rates will be their biggest barrier to growth in
the year ahead.
• 42 per cent of businesses see fuel prices as having the greatest influence on their
operations in the quarter ahead – up 3 points from last month.
• 31 per cent of businesses think online selling by their competitors will have a small
adverse affect on their operations – up 11 points from last month.
Actual results for the September quarter 2012
• The selling price index increased six points to an index of nine; 24 per cent of firms raised
prices and 15 per cent decreased prices.
• The net sales index was up three points; 42 per cent of firms increased sales compared to
the September quarter 2011, while 17 per cent experienced lower sales.
• The profits index jumped 17 points to an index of 21; 41 per cent of firms increased
profits and 20 per cent recorded lower earnings.
• Capital investment recorded the first negative index since March Quarter 2009 with a net
index of -5, with 25 per cent of firms reducing investment.
• Eleven per cent of businesses reduced their employee numbers; the net employment
index was negative for the second consecutive quarter, at minus two.
• Thirty four per cent of firms increased their inventories, and the inventory index
increased eight points to an index of 19, the highest actual index since March quarter
2003.
MEDIA RELEASE
4
About the Survey
D&B Australasia conducted the latest National Business
Expectations Survey in December 2012. Each quarter 1,200
business owners and senior executives representing major
industry sectors across Australia are asked if they expect
increases, decreases or no changes in their upcoming
quarterly sales, profits, employment, capital investment,
inventories and selling prices. Since its introduction in
Australia in 1988, the survey has proven to be a highly
reliable measure of economic performance.
The index figures used in the survey represent the net
percentage of survey respondents expecting higher sales,
profits, etc., compared with the same quarter of the
previous year. The indices are calculated by subtracting
the percentage of respondents expecting decreases from
the percentage expecting increases.
Methodology
Each quarter D&B asks a sample of executives in
manufacturing, wholesale and retail businesses across
Australia if they expect an increase, decrease or no change
in their quarter-ahead sales, profits, employees, capital
investment, inventories and selling prices compared with
the same quarter a year ago.
The executives are also asked for actual changes over the
twelve months to the latest completed quarter.
The Australian survey began in March 1988 obtaining
some 900 responses in the third month of each quarter.
Since the middle of 1999, the survey has been conducted
monthly, initially with about 300 responses each month.
From September 2000, responses have been obtained
from 400 executives each month.
From July 2005, to simplify the interpretation of the survey
data, the results have been presented as a sequence of
preliminary, interim and final indexes. The 400 responses
from the first month of each quarter give preliminary
estimates of the quarter-ahead expectations and the
quarter behind actual indexes. The 400 responses from the
second month of the quarter are combined with those
from the first month as interim estimates of the indexes
based on 800 responses. The 400 responses from the third
month are combined with those from the first two months
to give the final expectations and actual indexes based on
all 1,200 responses obtained during each quarter.
In this issue, the final indexes for the latest quarters are
based on the 1,200 responses obtained during October–
December 2012.
Charts and Tables
It is common practice to present the results of business
expectations surveys as indexes showing the net balance
of the positive and negative responses. However, this
method of aggregating responses loses relevant
information about the relative proportions and rates of
change of the two (positive and negative) groups.
Accordingly, the detailed charts at the top of pages 5 to 10
in the D&B National Business Expectations Survey show
separately the positive and negative components of each
of the various indexes. These charts help provide a better
insight into the expectations and performance of
Australian business than that shown by movements in the
simple aggregation of the positive and negative responses.
The aggregate net balance indexes are shown in the charts
at the bottom of pages 5 to 10.
About Dun & Bradstreet
D&B is the world’s leading provider of credit, marketing
and purchasing information and receivables management
services.
D&B manages the world’s most valuable commercial
database with information on more than 200 million
companies, including 3 million in Australia, and millions of
consumers. Information is gathered in 193 countries, in 95
languages or dialects, covering 186 monetary currencies.
The database is refreshed more than 1.5 million times
daily as part of D&B’s commitment to provide accurate,
comprehensive information for its more than 150,000
customers.
D&B’s data provides insights which improve business
decision-making and outcomes.
D&B National Business Expectations Survey – December 2012 Results 5
Sales Outlook
(Quarterly Net Index) (Down 14 to 19)
The positive and negative components of the D&B net
indexes are shown in the adjacent chart.
The March quarter 2013 sales expectations final index
is 19; down 14 points from December quarter 2012.
The index is now 7 points above the
10-year average of 12.
Thirty six per cent expect an increase and 17 per cent a
decrease in sales compared with March quarter 2012.
The actual sales index for September quarter 2012 is
25; up three points on the June quarter. Forty-two per
cent of firms had increased sales and 17 per cent had
decreased sales compared with September quarter
2011.
D&B National Business Expectations Survey – December 2012 Results 6
Profits Outlook
(Quarterly Net Index) (Up 3 to 23)
The positive and negative components of the D&B net
indexes are shown in the adjacent chart.
The final index for executives expecting an increase in
profits in March quarter 2013 is 23; up three points on
December quarter 2012.
The index has risen to its highest level in eight
quarters and is 18 points above the 10-year average
index of 5.
Forty-three per cent expect an increase and 20 per cent
a decrease compared with March quarter 2012.
The actual net profits index for June quarter 2012 is 21,
up 17 points on the previous quarter. Forty one per
cent had an increase and 20 per cent a decrease in
profits compared with September quarter 2011.
D&B National Business Expectations Survey – December 2012 Results 7
Employment Outlook
(Quarterly Net Index) (No change at 1)
The positive and negative components of the D&B
net indexes are shown in the adjacent chart.
The final index of the employment outlook for
March quarter 2013 is one; no change from the
index for December quarter and equal to the 10-
year average index of 1.
Seven per cent of executives now expect to employ
more staff than a year ago and six per cent expect a
decrease in staff numbers.
The D&B employees final actual index for September
quarter 2012 is minus two, up two points on the
previous quarter. Nine per cent of firms had more
staff in September quarter 2012 than a year earlier
and 11 per cent of firms had fewer.
D&B National Business Expectations Survey – December 2012 Results 8
Capital Investment Outlook
(Quarterly Net Index) Down 1 to 14)
The positive and negative components of the
D&B indexes are shown in the adjacent chart.
The capital investment outlook for March
quarter 2013 is down one point to a final index
of 14.
The investment outlook is the second highest
since December quarter 2010 and is now nine
points above the 10- year average index of 5.
Thirty per cent expect an increase and 16 per
cent a decrease in capital investment compared
with a year earlier.
For September quarter 2012 the final index for
actual investment is minus 5, down 13 points
from the previous quarter.
Twenty per cent of firms had more capital
investment and 25 per cent had less than in
September quarter 2011.
D&B National Business Expectations Survey – December 2012 Results 9
Inventory Outlook
(Quarterly Net Index) (Down 8 to 16)
The positive and negative components of the
D&B net indexes are shown in the adjacent
chart.
The final outlook for growth in inventories in
March quarter 2013 is for an index of 16, down
eight points on the December quarter.
The latest index the second highest in nine
years and is now 13 points above the 10-year
average index of 3. Thirty one per cent expect to
increase and 15 per cent to decrease inventories
in March quarter compared with a year earlier.
The final index of the net proportion of firms
with actual increases in inventories for
September quarter 2012 is 19, up 8 points on
the index for the previous quarter. This is now
the highest actual index since March quarter
2003. Thirty four per cent had an increase in
inventories and 15 per cent a decrease
compared with September quarter 2011.
D&B National Business Expectations Survey – December 2012 Results 10
Selling Prices Outlook
(Quarterly Net Index) (Down 9 to 3)
The positive and negative components of the D&B
net indexes are shown in the adjacent chart.
The final selling prices outlook for March quarter
2013 is down nine points to a net index of 3.
This fall puts the index at the lowest recorded
since the survey began in 1988.
It is now 26 points below the 10-year average
index of 29.
The proportion of firms expecting to have higher
selling prices in March quarter 2013 than a year
earlier is 18 per cent with 15 per cent expecting to
have lower prices.
At nine, the final actual prices index for
September quarter 2012 is a rise of six points
from the previous quarter. Twenty four per cent
had increased and 15 per cent had decreased
prices compared with September quarter 2011.