Tài liệu Báo cáo khoa học: Time-dependent regulation analysis dissects shifts between metabolic and gene-expression regulation during nitrogen starvation in baker’s yeast doc
Bạn đang xem bản rút gọn của tài liệu. Xem và tải ngay bản đầy đủ của tài liệu tại đây (478.03 KB, 16 trang )
Time-dependent regulation analysis dissects shifts
between metabolic and gene-expression regulation
during nitrogen starvation in baker’s yeast
Karen van Eunen
1
, Jildau Bouwman
1,
*, Alexander Lindenbergh
1
, Hans V. Westerhoff
1,2
and Barbara M. Bakker
1,3
1 Department of Molecular Cell Physiology, Vrije Universiteit Amsterdam, The Netherlands
2 Manchester Centre for Integrative Systems Biology, University of Manchester, UK
3 Department of Pediatrics, University of Groningen, The Netherlands
Introduction
Living organisms have the option to regulate their
molecular activities by altering expression of the cor-
responding genes. For example, in the yeast Saccharo-
myces cerevisiae changes in glycolytic flux have
frequently been found to be accompanied by changes
in enzyme capacities [1–3] or amounts [4]. However, a
change in flux through a certain enzyme can also be
regulated through the interaction of that enzyme with
altering concentrations of its substrate(s), product(s)
and ⁄ or modifier(s) (metabolic properties). To quantify
the extent to which the change in flux through an
individual enzyme is regulated by a change in enzyme
Keywords
fermentative capacity; glycolysis; regulation
analysis; Saccharomyces cerevisiae;
systems biology
Correspondence
B. M. Bakker, Department of Pediatrics,
Center for Liver, Digestive and Metabolic
Diseases, University Medical Center
Groningen, University of Groningen,
Hanzeplein 1, NL-9713 GZ Groningen,
The Netherlands
Fax: +31 50 361 1746
Tel: +31 50 361 1542
E-mail:
*Present address
Physiological Genomics, TNO Quality of
Life, Zeist, The Netherlands
(Received 11 February 2009, revised 6 July
2009, accepted 23 July 2009)
doi:10.1111/j.1742-4658.2009.07235.x
Time-dependent regulation analysis is a new methodology that allows us to
unravel, both quantitatively and dynamically, how and when functional
changes in the cell are brought about by the interplay of gene expression
and metabolism. In this first experimental implementation, we dissect the
initial and late response of baker’s yeast upon a switch from glucose-lim-
ited growth to nitrogen starvation. During nitrogen starvation, unspecific
bulk degradation of cytosolic proteins and small organelles (autophagy)
occurs. If this is the primary cause of loss of glycolytic capacity, one would
expect the cells to regulate their glycolytic capacity through decreasing
simultaneously and proportionally the capacities of the enzymes in the first
hour of nitrogen starvation. This should lead to regulation of the flux
which is initially dominated by changes in the enzyme capacity. However,
metabolic regulation is also known to act fast. To analyse the interplay
between autophagy and metabolism, we examined the first 4 h of nitrogen
starvation in detail using time-dependent regulation analysis. Some
enzymes were initially regulated more by a breakdown of enzyme capacity
and only later through metabolic regulation. However, other enzymes were
regulated metabolically in the first hours and then shifted towards regula-
tion via enzyme capacity. We conclude that even initial regulation is subtle
and governed by different molecular levels.
Abbreviations
ADH, alcohol dehydrogenase; ALD, aldolase; GAPDH, glyceraldehyde 3-phosphate dehydrogenase; GPM, phosphoglycerate mutase; HXK,
hexokinase; PDC, pyruvate decarboxylase; PFK, phosphofructokinase; PGI, phosphoglucose isomerase; PGK, 3-phosphoglycerate kinase;
PYK, pyruvate kinase.
FEBS Journal 276 (2009) 5521–5536 ª 2009 The Authors Journal compilation ª 2009 FEBS 5521
capacity ( V
max
) and by changes in the interactions of
the enzyme with the rest of metabolism, regulation
analysis was developed [5–7].
To date, regulation analysis has been applied to
compare two steady states. Previous studies have
revealed a diversity of regulation which remained visi-
ble after the cells ultimately adjusted their enzyme
capacities to the new steady state [5,8,9]. In order to
obtain insight into adaptation strategies of organisms,
it would be more informative to follow the patterns of
regulation during the transition from one steady state
to another. To this end, time-dependent regulation
analysis has been developed [10].
Regulation analysis has the rate through an enzyme
(v) vary proportionally to a function f that depends on
enzyme concentration (e), and to a function g that
depends on metabolic effects (X, K).
v ¼ f ðeÞÁgðX; KÞð1Þ
Regulation of the gene-expression cascade leading to
the enzyme in question, changes f(e). Most often,
f(e)=V
max
. Changes in function g are caused by
changes in the concentrations of substrates, products
and effectors (X), and by changes in the affinities
(1 ⁄ K) of enzyme e towards its substrates, products
and effectors (K). As derived previously [6,7], gene
expression and metabolic regulation can be dissected
as follows:
1 ¼
D log V
max
D log J
þ
D log gðX; KÞ
D log J
¼ q
h
þ q
m
ð2Þ
Here J denotes the flux through the pathway, which at
a steady state equals the enzyme rate v. D denotes the
difference between two steady states. The hierarchical
regulation coefficient q
h
quantifies the relative contri-
bution of changes in enzyme capacity (V
max
) to the
regulation of the flux through the enzyme of interest.
The hierarchical regulation coefficient is associated
with changes in the entire gene expression cascade all
the way from transcription to protein synthesis, stabil-
ity and modification [8,9], hence the name ‘hierar-
chical’. The relative contribution of changes in the
interaction of the enzyme with the rest of metabolism
is reflected in the metabolic regulation coefficient q
m
.
Together the two regulation coefficients should
describe regulation completely, i.e. add up to 1.
Experimentally, the hierarchical regulation coeffi-
cient is the one that is more readily determined,
because it requires only measurements of the V
max
of
the enzyme and the flux through it, under two condi-
tions, according to:
q
h
¼
D log V
max
D log J
ð3Þ
The metabolic regulation coefficient can then be
calculated from the summation law (q
m
=1) q
h
).
For a more elaborate description and discussion of the
method, see Rossell et al. [6].
Time-dependent regulation analysis is an extended
version that quantifies the regulation coefficients as a
function of time [10]. For this study, we used the inte-
grative version of time-dependent regulation analysis,
which integrates all the regulation between time points
t
0
(the start of the perturbation) and t. This results in
the following equations:
1 ¼ q
h
ðtÞþq
m
ðtÞð4Þ
q
h
ðtÞ¼
log V
max
ðtÞÀlog V
max
ðt
0
Þ
log vðtÞÀlog vðt
0
Þ
ð5Þ
We denote the in vivo rate through the enzyme with
v rather than J because we are now considering
transient rather than steady states.
In this study, we applied time-dependent regulation
analysis to the case of the nitrogen starvation of yeast
cells. A brief period of nitrogen starvation is applied at
the end of the production process of industrial baker’s
yeast (S. cerevisiae) in order to increase its carbohy-
drate content, which in turn increases the storage sta-
bility of the yeast [11,12]. This period of nitrogen
starvation leads to partial loss of the fermentative
capacity, which is defined as the specific rate of carbon
dioxide and ethanol production immediately upon
introduction of the yeast into an anaerobic, glucose
excess environment (i.e. the dough). The production of
carbon dioxide plays a major role in leavening of the
dough and gives bread its open structure. It is believed
that the loss in fermentative capacity is mainly caused
by the degradation of proteins. Unspecific bulk degra-
dation of cytosolic proteins and small organelles via
autophagy is enhanced [13,14] within 30 min of nitro-
gen starvation and protein half-lives of < 1 h are mea-
sured [15,16]. If autophagy is the primary cause of the
observed changes in fermentative flux, one would
expect that regulation of the loss of the fermentative
flux is mainly at hierarchical level. However, several
studies have shown strong changes in glycolytic meta-
bolites, notably adenine nucleotides and fructose-
1,6-bisphosphate upon nitrogen starvation [17,18]. In
general, metabolic regulation is known to be relatively
fast. However, these studies do not analyse the extent
to which the observed metabolite changes actually
affect enzyme rates. Therefore, regulation analysis is
Experimental time-dependent regulation analysis K. van Eunen et al.
5522 FEBS Journal 276 (2009) 5521–5536 ª 2009 The Authors Journal compilation ª 2009 FEBS
fundamentally different from other types of analysis
because it quantifies the overall importance of meta-
bolism versus gene expression before examining
specific metabolites.
Earlier regulation analysis studies of nitrogen starva-
tion in yeast revealed mixed and diverse regulation [9].
Both gene expression and metabolism contributed to
the overall regulation, but to different extents for dif-
ferent enzymes. However, because this analysis was
not time resolved, but rather measured the endpoint of
regulation, secondary regulation events may have
taken place, obscuring a more decisive regulation
strategy put in place by the cells immediately upon
starvation.
In this study, we investigated how regulation devel-
ops over time while yeast adapts to nitrogen starva-
tion. If unspecific bulk degradation of proteins is the
primary reason for the loss of fermentative capacity,
we hypothesize that the initial regulation will be purely
hierarchical. Such ‘multisite regulation’ [19] would lead
to initial metabolite homeostasis and a lack of meta-
bolic regulation. Alternatively, metabolic regulation
may be involved from the beginning, which will
become visible as a mixed regulation or even a com-
plete metabolic regulation in the early time points. To
our knowledge, this is the first experimental study ever
in which regulation is studied in this way with quanti-
tative time resolution.
Results
Growth and perturbation condition
S. cerevisiae strain CEN.PK113-7D was grown in aero-
bic glucose-limited chemostat cultures at a dilution
rate of 0.35 h
)1
. Under these conditions, a respiro-
fermentative metabolism was observed (Table 1), in
agreement with literature data [20]. To induce nitrogen
starvation, cells were transferred from steady-state
chemostat cultures to a batch culture in medium lack-
ing nitrogen but with excess glucose. The addition of
glucose served to prevent additional starvation for the
carbon source. To discriminate between the effects
caused by nitrogen starvation and by the shift from
glucose limitation to glucose excess, control experi-
ments were performed in which cells were shifted to
glucose excess, but in the continued presence of nitro-
gen. Samples were taken from steady-state cultures
and at 0, 1, 2, 3, 4 and 24 h after the start of the per-
turbation. The 24-h sample was only taken during
nitrogen starvation, because in the presence of nitro-
gen, glucose was depleted within 5–6 h of the start of
the perturbation.
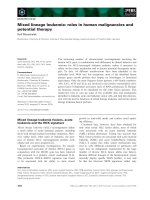
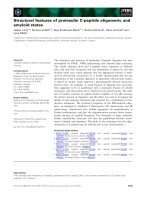
Figure 1A shows that the total cell protein remained
constant during nitrogen starvation. In cells shifted to
glucose excess in the presence of nitrogen, the total
protein in the cultures increased with time (Student’s
t-test, P < 0.05). In both cultures, cell numbers
increased over time (Fig. 1B). However, the cell num-
ber increased exponentially in cells shifted to glucose
excess in the continued presence of nitrogen, whereas
the cells stopped dividing after 4 h of nitrogen starva-
tion. This suggests that the cells finished their division
during nitrogen starvation, and further growth did not
occur. This was substantiated by Coulter counter data
that during nitrogen starvation a peak of smaller cells
occurred and persisted, indicating that the cells after
division did not grow anymore in volume (data not
shown).
Fermentative capacity and steady-state fluxes
First, the fermentative capacity, i.e. the ethanol flux
under anaerobic conditions at glucose excess, was mea-
sured in an off-line assay. Because the fermentative
capacity was measured in an off-line assay after trans-
fer to fresh medium, the extracellular metabolic condi-
tions were equal for all samples. This implies that any
metabolic regulation can only be caused by changes in
intracellular metabolite concentrations.
Samples were taken from the perturbed cultures at
the different time points. The cells were washed and
transferred to an anaerobic vessel containing fresh and
complete (with 38 mm ammonium sulfate) defined min-
eral medium [21] with an excess amount of glucose
(56 mm). This condition mimics the situation of
baker’s yeast in dough [2]. Apart from the ethanol
flux, the fluxes of glucose, glycerol, acetate, succinate,
Table 1. Physiological parameters of the aerobic glucose-limited chemostat cultures from which cells were taken to be subjected to nitro-
gen starvation and glucose excess conditions or glucose and nitrogen excess conditions. Dilution (growth) rate was set to 0.35 h
)1
. Errors
represent SEM of seven independent chemostat cultures.
Yield
glu,X
(gÆg
)1
) q
O
2
a
q
CO
2
b
RQ
c
q
glucose
a
q
ethanol
b
Dry weight(gÆL
)1
) Carbon recovery(%)
0.29 ± 0.01 7.2 ± 0.2 12.9 ± 0.4 1.8 ± 0.0 6.8 ± 0.1 5.2 ± 0.2 2.2 ± 0.1 93 ± 1
a
mmol consumed per gram biomass per hour.
b
mmol produced per gram biomass per hour.
c
Respiratory quotient (q
CO
2
=q
O
2
).
K. van Eunen et al. Experimental time-dependent regulation analysis
FEBS Journal 276 (2009) 5521–5536 ª 2009 The Authors Journal compilation ª 2009 FEBS 5523
pyruvate and trehalose were also measured over a per-
iod of 30 min. In these 30 min, biomass production
was not measurable, consistent with earlier research
[22], and therefore we neglected fluxes in biomass in
our calculations (see Experimental procedures). The
production fluxes of acetate, pyruvate and succinate
were always < 1% of the rate of glucose consumption
(Tables S1 and S2); the other fluxes are given in
Table 2. In the nitrogen-starvation experiment, the car-
bon consumed in the off-line assay matched that
produced, within the bounds of experimental error
(Table S1). In the experiment in which cells were
shifted to glucose excess in the presence of nitrogen,
the carbon balance matched only in the 0-h sample. In
the other samples the assessed carbon production rates
were 17–21% lower than the carbon consumption rates
(Table S2). The assumption that the difference is in
the glycogen flux is not realistic in this case, because
glycogen is usually consumed rather than produced
during glucose excess conditions. The most likely
explanation is that the missing carbon ends up in bio-
mass and biomass-related CO
2
. Note that CO
2
was not
measured in the fermentative-capacity assay and the
reported CO
2
flux is calculated based on the catabolic
fluxes. We recalculated the fluxes through the enzymes
by assuming that the gap in the carbon balance was
caused by a flux from pyruvate to biomass. Although
this had an effect on the absolute fluxes, it had little
impact on the regulation analysis reported below.
However, if the gap was caused by drainage at other
points in glycolysis and if the relative flux through
such a branch differed between time points, this may
somewhat affect the reported regulation coefficients in
the control experiment.
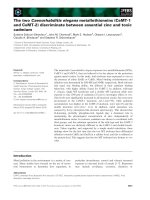
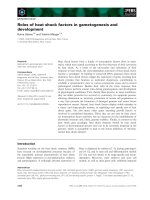
The fluxes through the individual enzymes were cal-
culated from the measured off-line fluxes (Table 2) as
described in Experimental procedures. Figure 2 shows
the results. A shift to glucose excess resulted in an
upregulation of the fluxes through all glycolytic and
fermentative enzymes. The same shift in glucose con-
centration but accompanied by nitrogen starvation
resulted in a downregulation of the same fluxes. In
Fig. 2, the flux through alcohol dehydrogenase and
through the enzymes in the lower branch of glycolysis
Fig. 1. Whole-cell protein and cell numbers per liter of cell culture were measured after a shift to nitrogen-starvation and glucose-excess
(closed circles) or glucose- and nitrogen-excess conditions (open circles), from glucose-limited chemostat conditions. The error bars in the
figure of whole-cell protein represent the SEM of four independent nitrogen-starvation experiments and of three independent glucose-excess
experiments carried out on a total of seven different chemostat cultures. The error bars in the figure of cell number represent SEM of two
independent experiments of both perturbation conditions carried out on a total of four different chemostat cultures.
Table 2. Experimentally measured fluxes expressed in mmolÆmin
)1
Æg
)1
for the various time points (t
n
denoted as n hours after the start of
the perturbation) for both perturbations. Negative values represent consumption of the metabolite by the pathway, and positive values repre-
sent the production of the metabolite. The errors represent SEM of three independent experiments carried out on different chemostat
cultures (two for t
24
in nitrogen-starvation experiment). Fluxes were not determined (n.d.) at t
24
in the glucose excess experiment.
Experiment Metabolite t
0
t
1
t
2
t
3
t
4
t
24
Nitrogen starvation Glucose )0.40 ± 0.02 )0.40 ± 0.02 )0.37 ± 0.00 )0.33 ± 0.02 )0.31 ± 0.02 )0.17 ± 0.02
Ethanol 0.66 ± 0.04 0.60 ± 0.02 0.56 ± 0.01 0.54 ± 0.01 0.56 ± 0.03 0.53 ± 0.01
Glycerol 0.08 ± 0.00 0.08 ± 0.00 0.09 ± 0.00 0.08 ± 0.00 0.08 ± 0.00 0.05 ± 0.01
Trehalose 0.00 ± 0.00 0.00 ± 0.00 0.00 ± 0.00 )0.01 ± 0.00 )0.01 ± 0.00 )0.04 ± 0.01
Glucose excess Glucose )0.37 ± 0.03 )0.52 ± 0.01 )0.56 ± 0.02 )0.57 ± 0.02 )0.60 ± 0.06 n.d.
Ethanol 0.62 ± 0.04 0.71 ± 0.02 0.77 ± 0.04 0.84 ± 0.04 0.89 ± 0.10 n.d.
Glycerol 0.08 ± 0.00 0.09 ± 0.00 0.09 ± 0.00 0.09 ± 0.01 0.09 ± 0.01 n.d.
Trehalose 0.00 ± 0.00 0.00 ± 0.00 0.00 ± 0.00 0.00 ± 0.00 0.00 ± 0.00 n.d.
Experimental time-dependent regulation analysis K. van Eunen et al.
5524 FEBS Journal 276 (2009) 5521–5536 ª 2009 The Authors Journal compilation ª 2009 FEBS
corresponds to the fermentative capacity. Upon the
shift from glucose limited to glucose excess conditions
(in the presence of nitrogen) the fermentative capacity
increased by 40%. When the same shift was accompa-
nied by the shift to nitrogen starvation a 20% decrease
in fermentative capacity was observed. This suggests
that the decrease in fermentative capacity is an effect
of the nitrogen starvation itself, but was counteracted
by the shift from glucose-limited to glucose excess
conditions. Both the decrease in the fermentative
capacity during nitrogen starvation and the increase
during glucose excess (in the presence of nitrogen) in
glucose consumption and ethanol production were
significant (Student’s t-test, P < 0.05).
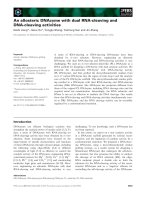
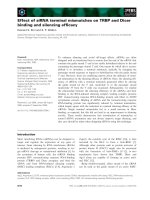
Enzyme capacities
We also measured how the catalytic capacities (V
max
)
of the enzymes involved in fermentation developed in
time. Figure 3 shows these V
max
values as a percentage
of their values at t
0
(absolute enzyme capacities are
presented in Tables S3 and S4). During the first 4 h of
nitrogen starvation, all enzymes except for phospho-
glucose isomerase (PGI) and glyceraldehyde 3-phos-
phate dehydrogenase (GAPDH) were downregulated
significantly. Importantly, after 24 h of nitrogen star-
vation the capacities of the enzymes 3-phosphoglycer-
ate kinase (PGK), phosphoglycerate mutase (GPM)
and pyruvate kinase (PYK) had returned to their
original levels of t
0
(Fig. 3 and Table S3).
When the cells were transferred from glucose limited
to glucose excess conditions in the presence of nitro-
gen, the capacities of hexokinase (HXK), aldolase
(ALD), PGK, GPM, PYK and pyruvate decarboxylase
(PDC) were upregulated. The capacity of alcohol dehy-
drogenase (ADH) was downregulated and the capaci-
ties of PGI, phosphofructokinase (PFK) and GAPDH
remained constant. PGI was only downregulated at
Fig. 2. Fluxes through the glycolytic and fermentative pathways under anaerobic glucose excess conditions in cells that had undergone the
shift to nitrogen starvation and glucose excess or to glucose excess conditions in the presence of nitrogen. Cells were transferred to the off-
line assay system at various time points during nitrogen-starvation and glucose-excess (closed circles) or during glucose- and nitrogen-excess
conditions (open circles). In this simplified scheme of the glycolytic and fermentative pathways, enzymes with the same flux are depicted in
the same box. Measured fluxes are depicted in bold. Branching metabolites connect the boxes. Fluxes were calculated based on the stoichi-
ometry of the glycolytic and fermentative pathways (described under Experimental procedures). In the graphs, the fluxes through the glyco-
lytic and fermentative pathways are plotted as a function of time. Fluxes are depicted in percentage with respect to the flux at t
0
. The error
bars represent the SEM of three independent experiments carried out on cells from different chemostat cultures (two for t
24
in the nitrogen-
starvation experiment).
K. van Eunen et al. Experimental time-dependent regulation analysis
FEBS Journal 276 (2009) 5521–5536 ª 2009 The Authors Journal compilation ª 2009 FEBS 5525
4 h. The trend, that more enzymes were upregulated
than downregulated, parallels the observed upregula-
tion of the fluxes under this condition.
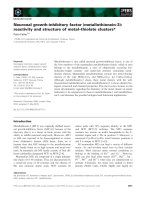
Time-dependent regulation analysis during the
first 4 h
If the initial regulation during nitrogen starvation was
dominated by unspecific bulk degradation of cytosolic
proteins and small organelles, all hierarchical regula-
tion coefficients should be equal to 1 initially. Accord-
ing to the summation theorem (Eqn 4) all metabolic
regulation coefficients should then equal zero. If, alter-
natively, metabolic regulation comes into play early
on, one might expect mixed or pure metabolic regula-
tion, exemplified by hierarchical regulation coeffi-
cients < 1 in the early time points. To test these
possibilities quantitatively, time-dependent regulation
analysis was applied to the data to assess how the
fluxes under the conditions of the fermentative capac-
ity were regulated as a function of the time into nitro-
gen starvation (or, in the control experiment the time
into glucose and nitrogen excess).
Hierarchical coefficients were calculated as a func-
tion of time into starvation according to the integrative
form of time-dependent regulation analysis (Eqns 4
and 5). The results for the two perturbations are
shown in Fig. 4 (shift from glucose limitation to nitro-
gen starvation and glucose excess) and Fig. 5 (relief
from glucose limitation only). Instead of the antici-
pated hierarchical regulation, a diversity of regulation
was observed in the first 4 h of nitrogen starvation and
even within the first hour (Fig. 4). In the shift to glu-
cose excess experiments, in the presence of nitrogen,
the regulation was different, but again diverse. Below,
the different categories of regulation and the shifts
from one to another that were observed during the
first 4 h, are discussed.
Purely metabolic regulation
Enzymes with a metabolic regulation coefficient (q
m
)
close to 1 and a hierarchical regulation coefficient (q
h
)
close to 0 were found in cells adjusting to nitrogen
starvation, as well as in cells accommodating excess
glucose. The changes in fluxes through these enzymes
ABC
EFGH
D
IJ
Fig. 3. The V
max
values of the glycolytic and fermentative enzymes expressed as percentages with respect to their values at t
0
, during shift
to nitrogen-starvation and glucose-excess (closed circles) or to glucose-excess conditions in the presence of nitrogen (open circles). Error
bars represent the SEM of three (two for t
24
in nitrogen-starvation experiment) independent experiments carried out on cells from different
chemostat cultures. Absolute values are reported in Tables S3 and S4.
Experimental time-dependent regulation analysis K. van Eunen et al.
5526 FEBS Journal 276 (2009) 5521–5536 ª 2009 The Authors Journal compilation ª 2009 FEBS
were regulated purely by interactions with their sub-
strate(s), product(s) or other metabolites and not by
changes of V
max
. GAPDH was regulated metabolically
in both perturbations, PGI only upon nitrogen starva-
tion and PFK only after the shift to glucose-excess
conditions in the presence of nitrogen.
Purely hierarchical regulation
Few enzymes were found to have a q
h
value close to 1
during the first 4 h. The flux through these enzymes
was mainly regulated through the change in V
max
. The
contribution of their interaction with their substrate(s)
and product(s) to the regulation of their capacity was
thereby negligible. During nitrogen starvation, only
PGK was regulated hierarchically and GPM came
closest in the shift to glucose excess, in the presence of
nitrogen (Fig. 5).
Antagonistic regulation directed by metabolism
A negative q
h
value is obtained when the flux changes
in the opposite direction compared with the V
max
. This
implied that metabolic regulation dominated and was
counteracted by hierarchical regulation. The regulation
of ADH during glucose-excess conditions in the pres-
ence of nitrogen was the prime example of this
category, to an extent increasing with time.
Progression towards more hierarchical regulation
In this category, any time profile was classified that
showed an increasing contribution by hierarchical reg-
ulation. This could be a shift of q
h
from 0 to $ 1, but
also any other time profile in which q
h
increased. This
means that, as time progressed, changes in V
max
became more important at the cost of metabolic regu-
lation. The enzymes PFK, GPM and ADH belonged
to this category when the cells were starved of nitro-
gen. PGK was regulated in this way in the cells shifted
to glucose excess in the presence of nitrogen. HXK,
ALD, PYK and PDC showed increasing hierarchical
regulation upon both perturbations. However, upon
the shift from limiting to excess glucose with excess
nitrogen throughout, all these enzymes showed
decreased hierarchical regulation after 3 or 4 h.
ABCD
EFGH
IJ
Fig. 4. Hierarchical regulation coefficients quantifying the regulation upon shift to nitrogen-starvation and glucose-excess conditions. Regula-
tion coefficients were calculated according to the integrative time-dependent regulation analysis (see Introduction). The error bars represent
SEM of three independent experiments carried out on cells from four different chemostat cultures. The dashed lines indicate a q
h
of 1.0 and
the dotted lines indicate a q
h
of 0.
K. van Eunen et al. Experimental time-dependent regulation analysis
FEBS Journal 276 (2009) 5521–5536 ª 2009 The Authors Journal compilation ª 2009 FEBS 5527
Progression towards metabolic regulation
This category is the opposite of the previous one. In
this case, metabolic regulation becomes more impor-
tant over time. The behaviour of PGI during glucose-
excess conditions in the presence of nitrogen is an
example of this form of regulation.
A summary of all regulation is given in Table 3. This
shows visually that 5 of 10 enzymes exhibit a similar regu-
lation pattern upon the two different perturbations.
Furthermore, there is large variation between the condi-
tions, although under starvation conditions, 7 of 10
enzymes tend to an increased contribution by gene
expression as a function of time. Altogether, the results
indicate that at no point into starvation did the enzyme
capacities reduce proportional to each other and to the
flux. With initially four enzymes predominantly regu-
lated metabolically (HXK, PGI, PFK, GAPDH, q
h
close
to zero at 1 h), five enzymes dominated by gene expres-
sion (ALD, PGK, GPM, PDC, ADH, q
h
‡ 1 at 1 h) and
one enzyme with cooperative regulation (PYK,
0<q
h
< 1 at 1 h), one cannot state that autophagy
Table 3. Categories of regulation. Enzymes were classified to the various categories based on the regulation during the first 4 h after the
start of the perturbations, i.e. nitrogen-starvation and glucose-excess conditions (closed circles) or glucose- and nitrogen-excess conditions
(open circles). ADH, alcohol dehydrogenase; ALD, aldolase; GAPDH, glyceraldehyde 3-phosphate dehydrogenase; GPM, phosphoglycerate
mutase; HXK, hexokinase; PDC, pyruvate decarboxylase; PFK, phosphofructokinase; PGI, phosphoglucose isomerase; PGK, 3-phosphoglycer-
ate kinase; PYK, pyruvate kinase.
Category of regulation HXK PGI PFK ALD GAPDH PGK GPM PYK PDC ADH
Purely metabolic • o • o
Purely hierarchical • o
Antagonistic directed by metabolism o
Towards hierarchical regulation • o ••oo••o • o •
Towards metabolic regulation o
A
E
I
B
F
J
C
G
D
H
Fig. 5. Hierarchical regulation coefficients quantifying the regulation upon the transition to glucose-excess conditions in the presence of
nitrogen. Regulation coefficients were calculated according to the integrative time-dependent regulation analysis (see Introduction). The error
bars represent SEM of three independent experiments carried out on ditto-different chemostat cultures. The dashed lines indicate a q
h
of
1.0 and the dotted lines indicate a q
h
of 0.
Experimental time-dependent regulation analysis K. van Eunen et al.
5528 FEBS Journal 276 (2009) 5521–5536 ª 2009 The Authors Journal compilation ª 2009 FEBS
precedes metabolic regulation or vice versa (Fig. 4).
Apparently, both mechanisms contribute from the begin-
ning. Seven of ten enzymes exhibited a shift in regulation
between 1 and 4 h, always in the direction of hierarchical
regulation.
Integrated regulation after 24 h
In this study, the growth condition prior to the nitrogen
starvation differed from the conditions used in the ear-
lier study of Rossell et al. [9]. Here, we have grown
yeast under glucose-limited conditions (chemostat culti-
vation at a high dilution rate), whereas in the study of
Rossell et al. [9] cells were grown in glucose excess
(batch cultivation). To compare the two studies, we cal-
culated the regulation coefficients after 24 h of nitrogen
starvation from our data and compared the results to
those from the earlier batch study. Table 4 shows the
results. The initial growth condition did not have any
effect on the type of regulation of HXK, PGI, ALD,
PDC and ADH. In both cases, regulation was domi-
nated by gene expression (q
h
close to 1 or higher),
although the precise numbers differed substantially
between the two conditions. Under both initial growth
conditions, PGK was regulated by metabolism (q
h
close
to 0). Because the SEM of the enzyme GAPDH was
considerable in the study by Rossell et al. [9] is unclear
whether the discrepancy between the two studies in the
regulation of GAPDH is real. However, the enzymes
PFK, GPM and PYK were clearly regulated differently
under the two growth conditions. Apparently, the regu-
lation of the flux through these enzymes upon the intro-
duction of nitrogen starvation is sensitive to the growth
conditions prior to nitrogen starvation.
Transcript levels
The diversity in the time profiles of the V
max
values
suggested that, apart from unspecific bulk degradation
of proteins, other more specific regulation mechanisms
of protein regulation were involved in the response to
nitrogen starvation. To investigate the extent to which
such regulation took place at the mRNA level, we
measured the transcript levels of nearly all glycolytic
and fermentative genes using qPCR (Fig. 6). First, the
V
max
levels of PGI and GAPDH remained constant.
We wondered whether (possible) degradation of these
proteins would be compensated for by increased syn-
thesis driven by increased transcription, but we found
no increase in the mRNA levels of these enzymes.
Figure 6A shows that the transcript level of PGI1 did
not change significantly. The transcript levels of the
TDH genes, which code for GAPDH, were changed
significantly (Student’s t-test, P < 0.05). TDH1 was
increased, and TDH2 and TDH3 were both decreased
(Fig. 6B). However, because TDH3 was the most
abundant of the three, the total transcript level of the
TDH genes was decreased. Second, trends observed in
the V
max
during the first 4 h were sometimes reversed
at the 24 h time point. For example, the V
max
values
of PGK, GPM and PYK decreased during the first
4 h, but recovered to their original values at 24 h.
Recovery of the V
max
of PGK was, however, not pre-
ceded by a significant increase in transcript level. In
the case of PYK, one isoform increased and the other
decreased at the mRNA level. Again one of the tran-
scripts, in this case PYK1, was highly abundant, which
resulted in lower total PYK mRNA levels. Because of
problems with the primer sets, transcript levels of
GPM were not measured. Finally, in most cases, the
changes in transcript levels predicted changes in isoen-
zyme distributions, but no overall up- or downregula-
tion. It seems that the hierarchical part of the
regulation is quite subtle and cannot be attributed to a
single process in the gene expression cascade.
Discussion
Time-dependent regulation analysis quantifies the rela-
tive importance of metabolism and gene expression in
Table 4. Comparison of the regulation coefficients after 24 h of
nitrogen starvation of cells that started off as respiro-fermentative
growing cells in a chemostat culture at D = 0.35 h
)1
and cells that
started off as growing exponentially in a batch culture [9]. The
errors represent, SEM of two independent experiments carried out
on different chemostat cultures (this study) and SEM of four inde-
pendent experiments carried out on different batch cultures. ADH,
alcohol dehydrogenase; ALD, aldolase; GAPDH, glyceraldehyde
3-phosphate dehydrogenase; GPM, phosphoglycerate mutase;
HXK, hexokinase; PDC, pyruvate decarboxylase; PFK, phosphofruc-
tokinase; PGI, phosphoglucose isomerase; PGK, 3-phosphoglycer-
ate kinase; PYK, pyruvate kinase.
Enzyme
Respiro-fermentative
growing cells (this
study)
Exponential growing
cells Rossell et al. [9]
q
h
SEM q
m
q
h
SEM q
m
HXK 0.8 0.1 0.2 1.0 0.2 0.0
PGI 3.5 0.9 )2.5 0.8 0.3 0.2
PFK 1.9 0.2 )0.9 0.4 0.2 0.6
ALD 2.0 0.3 )1.0 1.1 0.5 )0.1
GAPDH 0.0 0.2 1.0 0.7 0.5 0.3
PGK 0.1 0.0 0.9 0.0 0.2 1.0
GPM )0.2 0.0 1.2 1.0 0.4 0.0
PYK 0.5 0.2 0.5 1.4 0.3 )1.4
PDC 3.6 0.2 )2.6 2.3 0.6 )1.3
ADH 3.9 0.2 )2.9 1.7 0.4 )0.7
K. van Eunen et al. Experimental time-dependent regulation analysis
FEBS Journal 276 (2009) 5521–5536 ª 2009 The Authors Journal compilation ª 2009 FEBS 5529
flux regulation. In this study, we applied the method
to dissect the primary mechanism(s) of flux regulation
when yeast cells were adapting to nitrogen starvation.
Our results showed that after 1 h of nitrogen star-
vation some enzymes were dominated by metabolic
regulation, whereas others were predominantly hierar-
chically regulated. GPM, PGK and to a lesser degree
PYK exhibited hierarchical regulation during the first
hour of nitrogen starvation and metabolic regulation
after 24 h, which would be in line with a primary role
for autophagy. HXK, PFK and PGI, however, were
initially rather regulated by metabolism and showed
more hierarchical regulation after 24 h. This shows
that on its own, neither autophagy nor metabolism
could be the primary cause of the loss of fermentative
capacity. Rather, a subtle interplay between the two
was observed from the beginning.
The diversity of regulation observed during the first
few hours of nitrogen starvation cannot be explained
simply from the addition of high glucose to the starva-
tion medium. Not only did we observe a decrease in
many enzyme capacities during nitrogen starvation in
the presence of high glucose and an increase upon glu-
cose excess in a full growth medium, there was no
(inverse) correlation between the degree of downregu-
lation under nitrogen starvation and the degree of
upregulation upon glucose excess.
We compared the measured flux and V
max
data to
earlier reports. Both fermentative capacity and enzyme
capacities measured at time point 0 h (nonstarved
yeast cells) were highly comparable to the data
obtained by Van Hoek et al. for yeast grown under
identical conditions [20]. In addition, we calculated
whether the measured V
max
values can support the
fluxes measured under both perturbations. This is true
for all enzymes, with the exception of PFK in the
nitrogen-excess experiment. The fact that PFK has
quite a few allosteric regulators, i.e. ATP, citrate,
fructose-2,6-bisphosphate, etc., might complicate mea-
suring the actual V
max
. However, fructose-2,6-bisphos-
phate is no longer commercially available, which limits
the possibilities for rapid further measurements. Alto-
gether our results were similar to literature data and
make sense to the yeast cell physiology.
Because both metabolic and hierarchical regulation
played a role in the adaptation of the yeast cell to
nitrogen starvation, we discuss the mechanisms acting
at each level. The hierarchical regulation can be
divided into several levels, i.e. mRNA synthesis and
degradation, protein synthesis and degradation and
protein modification.
The finding that some V
max
values decreased faster
than others is not consistent with the simple view of
unspecific bulk degradation of cytosolic proteins. The
simplest explanation might be that degradation of
some enzymes is rapidly compensated by new synthe-
sis. The synthesis of proteins can be regulated via the
concentrations of the corresponding mRNAs or the
translation of these mRNAs. Although we observed
some regulation of glycolytic mRNA levels (Fig. 6),
there was no direct correlation with the time profiles
of the corresponding V
max
values. Notably, restoration
A
B
C
Fig. 6. The ratios of [mRNA]t ⁄ [mRNA]t
ss
of the glycolytic and fer-
mentative genes during nitrogen starvation. Data were normalized
to the mean of the control gene PDI1 and the steady-state samples
of the nitrogen starvation experiments. The error bars represent
the SEM of three independent experiments carried out on different
chemostat cultures (two for time point t
24
).
Experimental time-dependent regulation analysis K. van Eunen et al.
5530 FEBS Journal 276 (2009) 5521–5536 ª 2009 The Authors Journal compilation ª 2009 FEBS
of the V
max
values of PGK and PYK after 24 h could
not be predicted from changes in their mRNA concen-
trations. Similarly, the constant V
max
values of PGI
and GAPDH could not be simply predicted from the
corresponding mRNA levels. We did observe an
increase in the TDH1 mRNA level, encoding one of
the GAPDH isoenzymes, in line with earlier reports of
induction of this transcript in heat-shocked cells and
under glucose starvation conditions [23]. However, in
our experiments, the decreased expression of TDH3,
the most abundant of the three TDH transcripts, prob-
ably caused an overall decrease in TDH mRNA levels.
The fact that hardly any correlation was observed
between the transcript levels and the enzyme capacities
is consistent with earlier observations [8,24,25].
The lack of correlation between the transcript levels
and enzyme capacities, suggests that the regulation of
the V
max
values may be at the post-transcriptional
level, i.e. protein synthesis, degradation and modifica-
tion. It has been shown that during nitrogen starvation
the rate of protein synthesis is limited by the size of
the free amino acid pool and that autophagy is
required to provide the cell with amino acids for new
protein synthesis [26]. During the first 2 h of nitrogen
starvation, the total free amino acid levels are dramati-
cally decreased. After 3–6 h, the amino acid levels and
the rate of protein synthesis are partly restored [26].
The quantitative analysis presented here suggests that
protein breakdown and new synthesis cannot simply
be separated in time. To understand the patterns of
enzyme capacities over time, we should rather consider
them as the result of a balance between protein synthe-
sis and breakdown from the beginning. The differences
between the different enzyme capacities over time can
result simultaneously from differences in their rates of
synthesis and breakdown. The nitrogen starvation con-
ditions, however, make it difficult to measure these
rates for all the individual proteins involved. For med-
ium- or high-throughput experiments of protein turn-
over stable-isotope-labelled amino acids or ammonium
are commonly used [27–30]. Under nitrogen starvation
this is not an option. Alternatively, the incorporation
of
13
C from
13
C-labelled glucose into new proteins
could be monitored [31], but the recycling of amino
acids that occurs during nitrogen starvation [26,32]
may preclude reliable calculations of protein synthesis
rates from such experiments.
If the different time profiles of the V
max
values are
caused by differences in the degradation rates of the
corresponding proteins, there are two main scenarios.
Either, some proteins are hidden from the protein-
degradation machinery or this machinery recognizes
the different proteins and distinguishes between them.
There is evidence for both mechanisms. First, GAP-
DH, one of the enzymes with a stable capacity during
the first hour of nitrogen starvation, can be incorpo-
rated into the cell wall under stress conditions such as
starvation and ⁄ or a temperature upshift. This incorpo-
ration of GAPDH into the cell wall in response to
stress does not require de novo protein synthesis [33],
indicating that this mechanism could work under
nitrogen starvation and shield GAPDH effectively
from unspecific breakdown of cytosolic proteins by
autophagy. In our study, we did not distinguish
between different subcellular localizations of the glyco-
lytic proteins, but it should be noted that such relocal-
ization may also preclude participation of the enzyme
in glycolysis and may therefore provide an additional
layer of regulation.
Second, specificity of protein degradation is also a
plausible mechanism to explain our data. In general,
not all proteins are degraded to the same extent and at
the same rate. The autophagy route to degradation,
which is often considered to be unspecific, has been
reported to exhibit some specificity. For example, one
of the isoenzymes of acetaldehyde dehydrogenase
(Ald6p), is degraded preferentially by autophagy [34].
Similarly, under some conditions, autophagy can selec-
tively remove certain organelles, such as endoplasmic
reticulum, mitochondria or peroxisomes [35–37]. Auto-
phagy of mitochondria and peroxisomes occurs during
nitrogen starvation [16,38,39]. It has been suggested
that the specificity of autophagy may depend on the
kinetics of uptake by the vacuole and on the sensitivi-
ties of proteins to vacuolar proteases [40], which again
may provide an additional layer of regulation. In addi-
tion, highly specific protein degradation occurs via
proteasome-mediated proteolysis of ubiquitin-tagged
proteins [41]. Ubiquitination of proteins is catalysed by
three enzymes: ubiquitin-activating enzyme (E1),
ubiquitin-conjugating enzyme (E2) and ubiquitin pro-
tein ligase (E3). E3 ubiquitin ligase binds directly to
the substrate proteins and thereby regulates the speci-
ficity of the process [42,43]. The glycolytic proteins,
PFK2, TDH3, GPM1 and -3, ENO2, PDC5 and
ADH6 showed interaction with the yeast E3 ubiquitin
ligase RSP5 in a binding assay using protein chips [44].
For PFK, GPM, PDC and ADH this is in agreement
with the results for enzyme capacity. It is not known if
proteasome-mediated proteolysis is enhanced when
the cells are starved for nitrogen. However, it has
been shown that catalytic activity of the Ubp3p ⁄
Bre5p ubiquitin protease is required for selective deg-
radation of ribosomes during nutrient starvation [45].
In principle, regulation analysis allows us to dissect
which part of the V
max
regulation is caused by post-
K. van Eunen et al. Experimental time-dependent regulation analysis
FEBS Journal 276 (2009) 5521–5536 ª 2009 The Authors Journal compilation ª 2009 FEBS 5531
translational modifications of proteins, such as phos-
phorylation. This extension of the method [8] requires
precise measurements of protein concentrations.
Despite improvements in quantitative proteomics, the
accuracy is probably insufficient to dissect the initial
kinetics in this study. The flux reduction is only 20%
in the first 4 h and for example, to quantify a partial
regulation by posttranslational modification at 20%
accurately, would require 4% accuracy in protein
measurements.
To quantitatively explain the metabolic regulation
observed for several enzymes would require not only
metabolite concentrations, but also quantitative assess-
ment of their impact on the enzyme rates. Two studies
showed decreased levels of fructose-1,6-bisphosphate
during the first hour of nitrogen starvation [17,18].
Because fructose-1,6-bisphosphate is known as an allo-
steric activator of PFK and PYK [46,47], this is in line
with the decreased fermentative capacity found under
nitrogen starvation. Another allosteric regulator cit-
rate, which is an inhibitor of PFK [48], is increased
when yeast cells are starved of nitrogen [18]. However,
this is a small sample of all metabolites that might pos-
sibly affect the rates of glycolytic enzymes and the cor-
relation is only qualitative. We are currently working
on a quantitative analysis based on new metabolite
measurements and a quantitative kinetic model [49].
In conclusion, the quantitative approach of time-
dependent regulation analysis applied in this study,
enabled us to demonstrate the importance of both met-
abolic regulation and hierarchical regulation in an early
time window of nitrogen starvation. Furthermore, we
provided (indirect) evidence for a diversity of regula-
tion within the gene expression cascade in this early
time window. This study provides an important first
step towards a full dissection of the biochemical mecha-
nisms during the initial response of yeast upon an envi-
ronmental perturbation. The results should guide more
precise analysis of the regulation of individual enzymes.
Experimental procedures
Strain and growth conditions
The haploid, prototrophic Saccharomyces cerevisiae strain
CEN.PK113-7D (MATa, MAL2-8
c
, SUC2; from P. Ko
¨
tter,
Frankfurt, Germany) was cultivated in an aerobic glucose-
limited chemostat culture at 30 °C in a laboratory fermen-
tor (Applikon, Schiedam, The Netherlands). The working
volume of the culture was kept at 1 L by an effluent pump
coupled to a level sensor. Chemostat cultures were fed with
defined mineral medium [21] in which glucose (42 mm) was
the growth-limiting nutrient and ammonium sulfate the sole
nitrogen source at 37.8 mm. Yeast cells were grown under
respiro-fermentative conditions at a dilution rate of
0.35 h
)1
. The stirring speed was 800 rpm. The pH was kept
at 5.0 ± 0.1 by an ADI 1010 controller, via automatic
addition of aliquots of 2 m KOH. The fermentor was aer-
ated by flushing with air at a flow rate of 30 LÆh
-1
. Chemo-
stat cultures were assumed to be in a steady state when,
after at least five volume changes, the culture dry weight,
the specific carbon dioxide production rate and the oxygen
consumption rate had changed by < 2% after at least one
volume change. The number of generations after the start
of the chemostat cultivation was kept < 20, because it is
known that changes in the cell population occur during
prolonged chemostat cultivation [50,51]: the perturbation
was performed after 18–19 generations.
Perturbation conditions
For the nitrogen-starvation experiments, the same defined
mineral medium was used as for the chemostat culture,
except that ammonium sulfate was lacking and glucose was
in excess (195 mm). Also in the case of the nitrogen-excess
conditions, the same defined mineral medium was used but
now in the presence of ammonium sulfate (38 mm) and
with 195 mm glucose. Yeast cells were harvested from the
steady-state chemostat as described above, washed with
equal volumes of ice-cold (4 °C) nitrogen starvation or
nitrogen excess medium, and resuspended in the corre-
sponding medium to a volume equal to that harvested from
the chemostat culture (loss of cells was < 5%). These cells
were brought back into a new fermentor under batch con-
ditions at 30 °C, the pH being kept at 5.0 ± 0.1 and the
stirring speed at 800 rpm. Again, the culture was flushed
with air at a flow rate of 30 LÆh
)1
. Samples were taken to
measure the whole-cell protein concentration, fermentative
capacity, mRNA levels and the capacities of the glycolytic
and fermentative enzymes. After all samples had been
taken, the remaining culture volume was $ 500 mL. In this
and earlier studies the fermentative capacity is measured as
the rate of ethanol production in an off-line assay in which
cells are transferred to a complete growth medium under
anaerobic conditions at excess of glucose [2].
The results from steady-state samples and time point zero
immediately after the perturbations were similar. When we
normalized our data, we always used the zero hour time
point as the reference.
Analytical methods
Culture dry weights were determined as described in Postma
et al. [52], with the modification that the filters were dried
over night in a 60 ° C incubator. Cell numbers were counted
using a Coulter counter (Multisizer 3, Beckman Coulter
Inc., Fullerton, CA, USA), using a 30 lm aperture.
Experimental time-dependent regulation analysis K. van Eunen et al.
5532 FEBS Journal 276 (2009) 5521–5536 ª 2009 The Authors Journal compilation ª 2009 FEBS
For whole-cell protein measurement, 1 mL of cell culture
was spun down and washed once with demineralized water.
The cell pellet was resuspended in 1 mL (final volume) of
1 m NaOH, incubated at 100 °C for 10 min and subse-
quently cooled on ice. The protein concentration was deter-
mined according to the Lowry method with BSA
(2 mgÆmL
)1
stock solution, Pierce, Thermo Fisher Scienti-
fic, Rockford, IL, USA) in 1 m NaOH as standard (final
concentration of BSA stock solution in 1 m NaOH was
1.8 mgÆmL
)1
).
Fermentative capacity and steady-state fluxes
The fermentative capacity is measured as the rate of etha-
nol production in an off-line assay in which cells are trans-
ferred to a complete growth medium under anaerobic
conditions at excess of glucose. Culture samples were taken
and cells were washed and taken up in defined mineral
medium [21] lacking glucose. In previous studies, we did
not observe significant alterations in enzyme activities dur-
ing the washing of cells and transfer to the new medium.
The fermentative capacity and the steady-state fluxes were
measured under anaerobic conditions with an excess of glu-
cose (56 mm, added at time 0) for 30 min in a 6% wet
weight cell suspension at 30 °C. The set-up used for the
determination of fermentative capacity was as described in
Van Hoek et al. [2], with the modification that the head-
space was flushed with water-saturated N
2
(0.6 LÆh
)1
)
instead of with CO
2
. The concentrations of ethanol, glu-
cose, glycerol, succinate, pyruvate, acetate and trehalose
were measured by HPLC analysis [300 · 7.8 mm ion-
exchange column Aminex-HPX 87H (Bio-Rad, Hercules,
CA, USA) kept at 55 °C, with 22.5 mm H
2
SO
4
as eluent at
a flow rate of 0.5 mLÆmin
)1
]. The HPLC was calibrated for
all the metabolites measured.
After a brief lag time, the production of ethanol was con-
stant over the entire 30 min. We assume that the lag time is
caused by the system coming to a metabolic steady state.
Because the time-dependent regulation during the assay is
not the focus of our study, we did not investigate further.
We cannot exclude, however, that more permanent modifi-
cations to the enzymes occur. Such modifications will be
scored as part of the metabolic regulation. Previously,
Rossell et al. found that this might be the case for pyruvate
kinase, but not for any of the other enzymes [9]. The fluxes
through the enzymes of the glycolytic and fermentative
pathways were calculated from steady-state rates of glucose
consumption and ethanol and glycerol production, based
on the stoichiometric scheme in Fig. 2. We assumed that, if
the consumed carbon did not completely match the pro-
duced carbon, the difference was in the glycogen flux,
which we did not measure for reasons of limited accuracy.
In Fig. 2, enzymes with same flux are boxed together. The
flux through HXK is equal to the glucose flux. Fluxes
through PGI, PFK and ALD were calculated by dividing
the sum of the glycerol and ethanol fluxes by 2. The fluxes
through the enzymes from GAPDH to ADH were taken to
be equal to the measured ethanol flux. As the fluxes were
determined under anaerobic conditions, there was no flux
into the citric acid cycle and respiration. Other fluxes,
which may have contributed (acetate, pyruvate and
biomass) were negligible (see Results).
Enzyme capacity measurements
To prepare the cell-free extracts, samples were harvested,
washed twice with 10 mm potassium phosphate buffer (pH
7.5) containing 2 mm Na
2
H
2
-EDTA, concentrated 10-fold
and stored at )20 °C. Samples were thawed, washed and
resuspended in an equal volume of 100 mm potassium
phosphate buffer (pH 7.5) containing 2 mm MgCl
2
and
1mm dithiothreitol. Cell-free extracts were prepared by
using the FastPrep
Ò
method with acid-washed glass beads
(425–600 lm; Sigma Aldrich, St Louis, MO, USA). Eight
bursts of 10 s each at a setting of 6.0 were administered. In
between the bursts, samples were cooled on ice for at least
1 min. NAD(P)H-linked enzyme capacity assays were car-
ried out on freshly prepared extracts [2]. The extract was
used at four different dilutions, to check for proportionality
of the assays. In nearly all cases, the rate was proportional
to the amount of extract for at least two or three dilutions
and only these data points were used for further calcula-
tions. Proportionality depended strongly on the capacity of
the enzyme, i.e. when the capacity was high, the capacity of
the less-diluted samples was not proportional to that of the
other samples. In a few cases, the capacity of the enzyme
was so low that only the undiluted sample could be mea-
sured.
The Novostar (BMG Labtech, Offenburg, Germany) was
used as an analyser for spectroscopic measurements. All
enzyme capacities were expressed as moles of substrate con-
verted per min per mg of extracted protein. The protein
concentration in the extract was measured with a Bicincho-
ninic Acid kit (BCAÔ Protein assay kit; Pierce) with BSA
(2 mgÆmL
)1
stock solution; Pierce) containing 1 mm dith-
iothreitol as standard.
Regulation analysis
To study the dynamics of regulation in time, integrative
time-dependent regulation analysis was used [10]. Time-
dependent hierarchical regulation coefficients [q
h
(t)] were
calculated according to Eqn (5) (see Introduction). Time
point t
0
is defined as the time at which the perturbation
was started after washing the cells. In total four experi-
ments, in which the cells were shifted to nitrogen starvation
with excess of glucose, were carried out starting from inde-
pendent chemostat cultures and the cultures were moni-
tored during the first 4 h of starvation. V
max
values were
determined in three of the nitrogen-starvation experiments
K. van Eunen et al. Experimental time-dependent regulation analysis
FEBS Journal 276 (2009) 5521–5536 ª 2009 The Authors Journal compilation ª 2009 FEBS 5533
and for three parallel experiments, the steady-state fluxes
were estimated. Averages and SD were calculated separately
for the numerator and the denominator of Eqn (5). Based
on the SD of the numerator and the denominator the SEM
of q
h
was computed, assuming statistical independence of
the two. The time-dependent metabolic regulation coeffi-
cients [ q
m
(t)] were calculated according to the summation
law (Eqn 4). The same procedure was followed for time
point 24 h of the nitrogen starvation, based on two data-
sets, and for the nitrogen-excess conditions, based on three
datasets.
Transcript levels measured by qPCR
Total RNA was isolated by the hot-phenol method [53].
Genomic DNA was removed using DNase I (Applied Bio-
systems/Ambion, Austin, TX, USA) and cDNA was made
using random primers (Bioke Leiden, The Netherlands).
Oligonucleotide primers were designed to amplify an
80–120 bp amplicon. PDI1 (protein disulfate isomerase)
was chosen as an internal standard. Primers were designed
with primer express software 1.0 (PE Applied Biosystems,
Foster City, CA, USA). PCR (20 lL) were set up and run
as described by the manufacturer. The reactions contained
5 lL of SYBR Green PCR Core Kit (Bioke, Leiden, The
Netherlands), 3 pmol of each primer (Isogen, De Meern,
The Netherlands or Biolegio, Nijmegen, The Netherlands)
and 3 lL of cDNA template (equivalent to 1 ng of RNA).
Amplification, data acquisition, and data analysis were car-
ried out in the ABI 7900 Prism Sequence Detector (once at
2 min, 50 °C; 10 min, 95 °C; followed by 40 cycles at
95 °C, 15 s; 60 °C, 1 min). The calculated cycle threshold
values (Ct) were exported to Microsoft excel for analysis
using the DDCt method [54]. Briefly, cycle threshold (Ct)
values were used to calculate the relative level of gene
expression of a certain gene (X) normalized to the mean of
the control gene PDI1 and the steady-state sample of the
chemostat culture (Eqns 6 and 7). We have normalized to
steady state and not to the t
0
because differences between
these two points were observed. The reason for the differ-
ences is probably that changes in mRNA levels occur much
faster than, for example, differences in protein levels. Disso-
ciation curves (dissociation curves 1.0 f. software, PE
Applied Biosystems) of PCR products were run to verify
that only the correct product was amplified.
DDCt ¼ ÀððCt
X;t
À Ct
PDI1;t
ÞÀðCt
X;ss
À Ct
PDI1;ss
ÞÞ ð6Þ
½mRNA
X
t
½mRNA
X
ss
¼ 2
DDCt
ð7Þ
Acknowledgements
This project was supported financially by the IOP
Genomics program of Senter Novem. The work of
BM Bakker and HV Westerhoff is further supported
by STW, NGI-Kluyver Centre, NWO-SysMO, BBSRC
(including SysMO), EPSRC, AstraZeneca, and EU
grants BioSim, NucSys, ECMOAN, and UniCellSys.
The CEN.PK113-7D strain was kindly donated by
PKo
¨
tter, Euroscarf, Frankfurt.
References
1 Daran-Lapujade P, Jansen ML, Daran JM, van Gulik
W, de Winde JH & Pronk JT (2004) Role of transcrip-
tional regulation in controlling fluxes in central carbon
metabolism of Saccharomyces cerevisiae. A chemostat
culture study. J Biol Chem 279, 9125–9138.
2 Van Hoek P, Van Dijken JP & Pronk JT (1998) Effect
of specific growth rate on fermentative capacity of
baker’s yeast. Appl Environ Microbiol 64, 4226–4233.
3 Rossell S, Lindenbergh A, van der Weijden CC,
Kruckeberg AL, van Eunen K, Westerhoff HV &
Bakker BM (2008) Mixed and diverse metabolic and
gene-expression regulation of the glycolytic and fermen-
tative pathways in response to a HXK2 deletion in
Saccharomyces cerevisiae. FEMS Yeast Res 8, 155–164.
4 Nilsson A, Pahlman IL, Jovall PA, Blomberg A,
Larsson C & Gustafsson L (2001) The catabolic
capacity of Saccharomyces cerevisiae is preserved to a
higher extent during carbon compared to nitrogen
starvation. Yeast 18, 1371–1381.
5 Postmus J, Canelas AB, Bouwman J, Bakker BM, van
Gulik W, Teixeira de Mattos MJ, Brul S & Smits GJ
(2008) Quantitative analysis of the high temperature
induced glycolytic flux increase in Saccharomyces cerevi-
siae reveals dominant metabolic regulation. J Biol Chem
283, 23524–23532.
6 Rossell S, van der Weijden CC, Kruckeberg AL,
Bakker BM & Westerhoff HV (2005) Hierarchical and
metabolic regulation of glucose influx in starved
Saccharomyces cerevisiae. FEMS Yeast Res 5, 611–619.
7 ter Kuile BH & Westerhoff HV (2001) Transcriptome
meets metabolome: hierarchical and metabolic regula-
tion of the glycolytic pathway. FEBS Lett 500, 169–
171.
8 Daran-Lapujade P, Rossell S, van Gulik WM, Luttik
MA, de Groot MJ, Slijper M, Heck AJ, Daran JM, de
Winde JH, Westerhoff HV et al. (2007) The fluxes
through glycolytic enzymes in Saccharomyces cerevisiae
are predominantly regulated at posttranscriptional
levels. Proc Natl Acad Sci USA 104, 15753–15758.
9 Rossell S, van der Weijden CC, Lindenbergh A, van
Tuijl A, Francke C, Bakker BM & Westerhoff HV
(2006) Unraveling the complexity of flux regulation: a
new method demonstrated for nutrient starvation in
Saccharomyces cerevisiae. Proc Natl Acad Sci USA 103,
2166–2171.
Experimental time-dependent regulation analysis K. van Eunen et al.
5534 FEBS Journal 276 (2009) 5521–5536 ª 2009 The Authors Journal compilation ª 2009 FEBS
10 Bruggeman FJ, de Haan J, Hardin H, Bouwman J,
Rossell S, van Eunen K, Bakker BM & Westerhoff HV
(2006) Time-dependent hierarchical regulation analysis:
deciphering cellular adaptation. Syst Biol (Stevenage)
153, 318–322.
11 Caron C (1995) Commercial production of baker’s yeast
and wine yeast. In Enzymes, Biomass, Food and Feed
(Reed G & Nagodawithana TW eds), pp. 322–351.
VCH, Weinheim.
12 Reed G & Nagodawithana TW (1991) Baker’s yeast
production. In Yeast Technology (Reed G & Nagodawi-
thana TW eds), pp. 261–314. Van Nostrand Reinhold,
New York.
13 Klionsky DJ (2007) Autophagy: from phenomenology
to molecular understanding in less than a decade. Nat
Rev Mol Cell Biol 8, 931–937.
14 Mizushima N & Klionsky DJ (2007) Protein turnover
via autophagy: implications for metabolism. Annu Rev
Nutr 27, 19–40.
15 Krampe S & Boles E (2002) Starvation-induced degra-
dation of yeast hexose transporter Hxt7p is dependent
on endocytosis, autophagy and the terminal sequences
of the permease. FEBS Lett 513, 193–196.
16 Takeshige K, Baba M, Tsuboi S, Noda T & Ohsumi Y
(1992) Autophagy in yeast demonstrated with protein-
ase-deficient mutants and conditions for its induction.
J Cell Biol 119, 301–311.
17 Brauer MJ, Yuan J, Bennett BD, Lu W, Kimball E,
Botstein D & Rabinowitz JD (2006) Conservation of
the metabolomic response to starvation across two
divergent microbes. Proc Natl Acad Sci USA 103,
19302–19307, doi: 0609508103 [pii] 10.1073/pnas.060950
8103 [doi].
18 Lagunas R, Dominguez C, Busturia A & Saez MJ
(1982) Mechanisms of appearance of the Pasteur effect
in Saccharomyces cerevisiae: inactivation of sugar trans-
port systems. J Bacteriol 152, 19–25.
19 Fell DA & Thomas S (1995) Physiological control of
metabolic flux: the requirement for multisite modula-
tion. Biochem J 311, 35–39.
20 Van Hoek P, Van Dijken JP & Pronk JT (2000) Regu-
lation of fermentative capacity and levels of glycolytic
enzymes in chemostat cultures of Saccharomyces cerevi-
siae. Enzyme Microb Technol 26, 724–736.
21 Verduyn C, Postma E, Scheffers WA & Van Dijken JP
(1992) Effect of benzoic acid on metabolic fluxes in
yeasts: a continuous-culture study on the regulation of
respiration and alcoholic fermentation. Yeast 8, 501–
517.
22 van den Brink J, Canelas AB, van Gulik WM, Pronk
JT, Heijnen JJ, de Winde JH & Daran-Lapujade P
(2008) Dynamics of glycolytic regulation during adapta-
tion of Saccharomyces cerevisiae to fermentative metab-
olism. Appl Environ Microbiol 74, 5710–5723.
23 Boucherie H, Bataille N, Fitch IT, Perrot M & Tuite
MF (1995) Differential synthesis of glyceraldehyde-3-
phosphate dehydrogenase polypeptides in stressed yeast
cells. FEMS Microbiol Lett 125, 127–133.
24 Greenbaum D, Colangelo C, Williams K & Gerstein M
(2003) Comparing protein abundance and mRNA
expression levels on a genomic scale. Genome Biol 4,
117.
25 Griffin TJ, Gygi SP, Ideker T, Rist B, Eng J, Hood L
& Aebersold R (2002) Complementary profiling of gene
expression at the transcriptome and proteome levels in
Saccharomyces cerevisiae. Mol Cell Proteomics 1, 323–
333.
26 Onodera J & Ohsumi Y (2005) Autophagy is required
for maintenance of amino acid levels and protein syn-
thesis under nitrogen starvation. J Biol Chem
280,
31582–31586.
27 Beynon RJ & Pratt JM (2005) Metabolic labeling of
proteins for proteomics. Mol Cell Proteomics 4, 857–
872.
28 Doherty MK, Whitehead C, McCormack H, Gaskell SJ
& Beynon RJ (2005) Proteome dynamics in complex
organisms: using stable isotopes to monitor individual
protein turnover rates. Proteomics 5, 522–533.
29 Julka S & Regnier F (2004) Quantification in proteo-
mics through stable isotope coding: a review. J Prote-
ome Res 3, 350–363.
30 Pratt JM, Petty J, Riba-Garcia I, Robertson DH,
Gaskell SJ, Oliver SG & Beynon RJ (2002) Dynamics
of protein turnover, a missing dimension in proteomics.
Mol Cell Proteomics 1, 579–591.
31 Cargile BJ, Bundy JL, Grunden AM & Stephenson JL
Jr (2004) Synthesis ⁄ degradation ratio mass spectrometry
for measuring relative dynamic protein turnover. Anal
Chem 76, 86–97.
32 Yang Z, Huang J, Geng J, Nair U & Klionsky DJ
(2006) Atg22 recycles amino acids to link the degrada-
tive and recycling functions of autophagy. Mol Biol Cell
17, 5094–5104.
33 Delgado ML, Gil ML & Gozalbo D (2003) Starvation
and temperature upshift cause an increase in the enzy-
matically active cell wall-associated glyceraldehyde-3-
phosphate dehydrogenase protein in yeast. FEMS Yeast
Res 4, 297–303.
34 Onodera J & Ohsumi Y (2004) Ald6p is a preferred
target for autophagy in yeast, Saccharomyces cerevisiae.
J Biol Chem 279, 16071–16076.
35 Bernales S, McDonald KL & Walter P (2006) Auto-
phagy counterbalances endoplasmic reticulum expan-
sion during the unfolded protein response. PLoS Biol 4,
e423.
36 Sakai Y, Oku M, van der Klei IJ & Kiel JA (2006)
Pexophagy: autophagic degradation of peroxisomes.
Biochim Biophys Acta 1763, 1767–1775.
K. van Eunen et al. Experimental time-dependent regulation analysis
FEBS Journal 276 (2009) 5521–5536 ª 2009 The Authors Journal compilation ª 2009 FEBS 5535
37 Tal R, Winter G, Ecker N, Klionsky DJ & Abeliovich
H (2007) Aup1p, a yeast mitochondrial protein phos-
phatase homolog, is required for efficient stationary
phase mitophagy and cell survival. J Biol Chem 282,
5617–5624.
38 Kissova I, Salin B, Schaeffer J, Bhatia S, Manon S
& Camougrand N (2007) Selective and non-selective
autophagic degradation of mitochondria in yeast. Auto-
phagy 3, 329–336.
39 Wang CW, Kim J, Huang WP, Abeliovich H, Stromh-
aug PE, Dunn WA Jr & Klionsky DJ (2001) Apg2 is a
novel protein required for the cytoplasm to vacuole
targeting, autophagy, and pexophagy pathways. J Biol
Chem 276, 30442–30451.
40 Klionsky DJ (1998) Nonclassical protein sorting to the
yeast vacuole. J Biol Chem 273, 10807–10810.
41 Hilt W (2004) Targets of programmed destruction: a
primer to regulatory proteolysis in yeast. Cell Mol Life
Sci 61, 1615–1632.
42 Fang S & Weissman AM (2004) A field guide to ubiqui-
tylation. Cell Mol Life Sci 61, 1546–1561.
43 Pickart CM (2001) Mechanisms underlying ubiquitina-
tion. Annu Rev Biochem 70, 503–533.
44 Gupta R, Kus B, Fladd C, Wasmuth J, Tonikian R,
Sidhu S, Krogan NJ, Parkinson J & Rotin D (2007)
Ubiquitination screen using protein microarrays for
comprehensive identification of Rsp5 substrates in
yeast. Mol Syst Biol 3, 116.
45 Kraft C, Deplazes A, Sohrmann M & Peter M (2008)
Mature ribosomes are selectively degraded upon star-
vation by an autophagy pathway requiring the
Ubp3p ⁄ Bre5p ubiquitin protease. Nat Cell Biol 10,
602–610.
46 Goncalves P & Planta RJ (1998) Starting up yeast
glycolysis. Trends Microbiol 6, 314–319.
47 Nghiem NP & Cofer TM (2007) Effect of a nonmeta-
bolizable analog of fructose-1,6-bisphosphate on glycol-
ysis and ethanol production in strains of
Saccharomyces cerevisiae and Escherichia coli. Appl
Biochem Biotechnol 141, 335–347.
48 Salas ML, Vinuela E, Salas M & Sols A (1965) Citrate
inhibition of phosphofructokinase and the Pasteur
effect. Biochem Biophys Res Commun 19, 371–376.
49 Teusink B, Passarge J, Reijenga CA, Esgalhado E, van
der Weijden CC, Schepper M, Walsh MC, Bakker BM,
van Dam K, Westerhoff HV et al. (2000) Can yeast gly-
colysis be understood in terms of in vitro kinetics of the
constituent enzymes? Testing biochemistry Eur J
Biochem 267, 5313–5329.
50 Jansen ML, Diderich JA, Mashego M, Hassane A, de
Winde JH, Daran-Lapujade P & Pronk JT (2005) Pro-
longed selection in aerobic, glucose-limited chemostat
cultures of Saccharomyces cerevisiae causes a partial
loss of glycolytic capacity. Microbiology 151, 1657–
1669.
51 Mashego MR, Jansen ML, Vinke JL, van Gulik WM &
Heijnen JJ (2005) Changes in the metabolome of
Saccharomyces cerevisiae associated with evolution in
aerobic glucose-limited chemostats. FEMS Yeast Res 5,
419–430.
52 Postma E, Kuiper A, Tomasouw WF, Scheffers WA &
van Dijken JP (1989) Competition for glucose between
the yeasts Saccharomyces cerevisiae and
Candida utilis.
Appl Environ Microbiol 55, 3214–3220.
53 Schmitt ME, Brown TA & Trumpower BL (1990) A
rapid and simple method for preparation of RNA from
Saccharomyces cerevisiae. Nucleic Acids Res 18, 3091–
3092.
54 Spijker S, Houtzager SW, De Gunst MC, De Boer WP,
Schoffelmeer AN & Smit AB (2004) Morphine exposure
and abstinence define specific stages of gene expression
in the rat nucleus accumbens. FASEB J 18, 848–850.
Supporting information
The following supplementary material is available:
Table S1. C-flux in mmolÆCÆmin
)1
ÆgÆprotein
)1
during
fermentative capacity assay in samples from the nitro-
gen-starvation experiments.
Table S2. C-flux in mmolÆCÆmin
)1
ÆgÆprotein
)1
during
fermentative capacity assay in samples from the
glucose excess experiments in the presence of nitrogen.
Table S3. Capacities of the glycolytic and fermentative
enzymes in lmolÆmin
)1
ÆmgÆprotein
)1
during nitrogen
starvation.
Table S4. Capacities of the glycolytic and fermentative
enzymes in lmolÆmin
)1
ÆmgÆprotein
)1
during glucose
excess conditions in the presence of nitrogen.
This supplementary material can be found in the
online article.
Please note: As a service to our authors and readers,
this journal provides supporting information supplied
by the authors. Such materials are peer-reviewed and
may be re-organized for online delivery, but are not
copy-edited or typeset. Technical support issues arising
from supporting information (other than missing files)
should be addressed to the authors.
Experimental time-dependent regulation analysis K. van Eunen et al.
5536 FEBS Journal 276 (2009) 5521–5536 ª 2009 The Authors Journal compilation ª 2009 FEBS