Tài liệu Báo cáo khoa học: Toggle switches, pulses and oscillations are intrinsic properties of the Src activation/deactivation cycle doc
Bạn đang xem bản rút gọn của tài liệu. Xem và tải ngay bản đầy đủ của tài liệu tại đây (656.95 KB, 17 trang )
Toggle switches, pulses and oscillations are intrinsic
properties of the Src activation/deactivation cycle
Nikolai P. Kaimachnikov
1,2
and Boris N. Kholodenko
1,3
1 Department of Pathology, Anatomy and Cell Biology, Thomas Jefferson University, Philadelphia, PA, USA
2 Institute of Cell Biophysics, Russian Academy of Sciences, Pushchino, Moscow Region, Russia
3 Systems Biology Ireland, University College Dublin, Ireland
Introduction
Members of the Src-family tyrosine kinases (SFKs) are
expressed in essentially all vertebrate cells and regulate
pivotal cellular processes, such as cytoskeleton rear-
rangements and motility, initiation of DNA synthesis
pathways, cell differentiation, mitosis and survival.
SFKs are stimulated by a multitude of cell-surface
receptors, including receptor tyrosine kinases (RTKs)
and phosphatases, integrins, cytokine receptors and
G-protein coupled receptors. Activated SFKs phos-
phorylate different effectors, such as the focal adhesion
kinase, small GTPases (Rho, Rac and Cdc42) and
phospholipase Cc, thereby acting as critical switches of
downstream pathways [1,2]. Related to the central
roles of SFKs in cellular regulation, their aberrant
Keywords
autophosphorylation; bistability; excitable
behavior; oscillations; Src-family kinases
Correspondence
B. N. Kholodenko, Systems Biology Ireland,
University College Dublin, Belfield, Dublin 4,
Ireland
Fax: +353 1 716 6713
Tel: + 353 1 716 6919
E-mail:
Note
The mathematical model described here
has been submitted to the Online Cellular
Systems Modelling Database and can be
accessed at: />database/kaimachnikov/index.html
(Received 5 December 2008, revised 16
April 2009, accepted 28 May 2009)
doi:10.1111/j.1742-4658.2009.07117.x
Src-family kinases (SFKs) play a pivotal role in growth factor signaling,
mitosis, cell motility and invasiveness. In their basal state, SFKs maintain a
closed autoinhibited conformation, where the Src homology 2 domain inter-
acts with an inhibitory phosphotyrosine in the C-terminus. Activation
involves dephosphorylation of this inhibitory phosphotyrosine, followed by
intermolecular autophosphorylation of a specific tyrosine residue in the acti-
vation loop. The spatiotemporal dynamics of SFK activation controls cell
behavior, yet these dynamics remain largely uninvestigated. In the present
study, we show that the basic properties of the Src activation/deactivation
cycle can bring about complex signaling dynamics, including oscillations,
toggle switches and excitable behavior. These intricate dynamics do not
require imposed external feedback loops and occur at constant activities of
Src inhibitors and activators, such as C-terminal Src kinase and receptor-
type protein tyrosine phosphatases. We demonstrate that C-terminal Src
kinase and receptor-type protein tyrosine phosphatase underexpression or
their simultaneous overexpression can transform Src response patterns into
oscillatory or bistable responses, respectively. Similarly, Src overexpression
leads to dysregulation of Src activity, promoting sustained self-perpetuating
oscillations. Distinct types of responses can allow SFKs to trigger different
cell-fate decisions, where cellular outcomes are determined by the stimula-
tion threshold and history. Our mathematical model helps to understand
the puzzling experimental observations and suggests conditions where
these different kinetic behaviors of SFKs can be tested experimentally.
Abbreviations
Csk, C-terminal Src kinase; FAK, focal adhesion kinase; MAPK, mitogen-activated protein kinase; PTP1B, protein tyrosine phosphatase 1B;
QSS, quasi steady-state; RPTP, receptor-type protein tyrosine phosphatase; RTK, receptor tyrosine kinase; SFK, Src-family kinase; SH2, Src
homology 2; SH3, Src homology 3; Y, tyrosine residue.
4102 FEBS Journal 276 (2009) 4102–4118 ª 2009 The Authors Journal compilation ª 2009 FEBS
signaling leads to cell transformation [3]. However,
despite src being the first oncogene to be discovered,
and the Src kinase having been studied for many years,
the SFK signaling dynamics and their role in cell phys-
iology and diseases, such as cancer, is not yet under-
stood [4,5].
All SFKs have common structural and regulatory
features. In the present study, we do not distinguish
between different family members, but rather explore
the generic properties of their complex signaling
dynamics. Two tyrosine (Y) residues are critical regula-
tors of SFKs: (a) the inhibitory site Y
i
located at the
C-terminal (Y527/530 for chicken/human c-Src and
Y507 for Lyn) and (b) activatory site Y
a
(Y416/419
for chicken/human c-Src and Y396 for Lyn) located
within the activation loop in the catalytic domain.
Phosphorylation of Y
i
promotes an autoinhibited con-
formation, whereas autophosphorylation of Y
a
corre-
lates with high kinase activity [6–8]. In the case of
c-Src, Y
i
is phosphorylated by the C-terminal Src
kinase (Csk) and its homolog Chk. Reduced Csk
expression was suggested to play a role in Src activa-
tion in human cancer [5]. Receptor-type protein tyro-
sine phosphatases (RPTPs), including PTPa, PTPk and
PTPe, can dephosphorylate Y
i
, leading to Src activa-
tion [9–12]. Cytoplasmic phosphatases, such as protein
tyrosine phosphatase 1B (PTP1B) and the Src homol-
ogy 2 (SH2) domain-containing phosphatases (SHP1/
2), can also activate Src, although less effectively than
RPTPs [5,7]. Other Src activators, such as phosphory-
lated RTKs, can bind the Src SH2 domain, facilitating
dephosphorylation of the inhibitory tyrosine pY
i
. The
phosphatases that dephosphorylate the activating site
pY
a
include the C-terminal site phosphatases, as well
as others, such as PTP-BL [2]. In addition, all SFKs
have other phosphorylation sites, which can alleviate
the intramolecular interactions that lead to an autoin-
hibited conformation [2].
SFKs can associate with the plasma membrane and
intracellular membranes, such as the endoplasmic retic-
ulum, endosomes and other structures. Myristoylation
of the N-terminal is necessary, but not sufficient for
the membrane localization, which also requires SFK
basic residues. For myristoylated SFKs that lack such
basic residues, membrane localization is shown to be
additionally facilitated by post-translational palmitoy-
lation [13]. Although recruitment of doubly-acylated
SFKs into lipid rafts and caveolae has been reported
[13,14], whether this Src localization is predominant
remains controversial.
SFKs can display a variety of temporal activity
patterns, differentially controlling the cell behavior.
For example, growth factor stimulation may lead to a
transient or sustained SFK activity, whereas the assem-
bly and disassembly of focal adhesions during cell
migration, mediated by integrin receptors, involves
periodic Src activation and deactivation [5,15], and
periodic SFK activation was also reported in the cell
cycle [16]. These complex dynamics might be explained
by multiple feedback loops because SFKs can phos-
phorylate their regulators, affecting their catalytic
activities. Recent theoretical models by Fuss et al. [17–
19] incorporated positive feedback that can occur as a
result of Src-induced phosphorylation and activation
of PTPa, and negative feedback that is exerted via the
Csk-binding protein, Cbp, which, when phosphory-
lated by SFKs, can target Csk to Src, promoting inhib-
itory phosphorylation of Src. These feedback loops
may induce the complex dynamic behaviors of both
Src kinases and their effectors and regulators. For
example, the positive feedback loop mediated by PTPa
can result in abrupt switches of Src kinase between
low and high activity states, which may explain the
activation of Src during mitosis [17]. Such a system
that switches between two distinct stable states, but
cannot rest in intermediate states, is termed bistable,
and there has been emerging interest in bistability as a
ubiquitous and unifying principle of cellular regulation
[20–23]. In the present study, we show that Src cycle
bistability arises merely from intermolecular autophos-
phorylation, which is a salient feature of many protein
kinases [24–26]. Other dynamic regimes brought about
by external feedback loops include excitable behavior,
where a transient stimulation causes Src activity to
overshoot before it returns to the basal level, as well as
oscillations [17–19]. Autocatalytic phosphorylation of
the focal adhesion kinase (FAK) together with FAK-
Src reciprocal activation was predicted to result in
switch-like amplification of integrin signaling and also,
under the assumption of rapid FAK synthesis and
degradation, in slow oscillations of FAK activity [27].
The present study shows that extremely complex
dynamic behaviors can be brought about by the intrin-
sic properties of the minimal Src activation/deactiva-
tion cycle in the absence of any external regulatory
loops, which is in contrast to earlier conclusions [17].
Using computational modeling to elucidate these
dynamic properties, we demonstrate that SFK can dis-
play oscillatory, bistable and excitable behaviors. We
show that overexpression or mutation of SFKs (or
their activators/inhibitors) do not merely change the
amplitude of responses to external stimuli, but dramat-
ically transform the response dynamics. For example,
when Csk activity is suppressed, a transient stimulus,
which normally causes a transient Src activation (in
the stable low-activity regime), can bring about oscilla-
N. P. Kaimachnikov and B. N. Kholodenko Switches, pulses and oscillations in Src signaling
FEBS Journal 276 (2009) 4102–4118 ª 2009 The Authors Journal compilation ª 2009 FEBS 4103
tory Src activity patterns or, when Csk and RPTP
activities are in the proper regions, abrupt switches to
a sustained, high Src activity state (within the bistable
domain). Our findings unveil the intrinsic complexity
of the Src dynamics and allow for direct experimental
testing.
The mathematical model described here has been
submitted to the Online Cellular Systems Modelling
Database and can be accessed free of charge at: http://
jjj.biochem.sun.ac.za/database/kaimachnikov/index.
html.
Results
Kinetic analysis background: basic properties of
the Src activation/deactivation cycle
Kinetic scheme of the Src cycle
Src activity is regulated by intramolecular and inter-
molecular interactions that are controlled by tyrosine
phosphorylation [15,28]. If the negative-regulatory
tyrosine residue Y
i
is phosphorylated, whereas the acti-
vatory residue Y
a
is dephosphorylated, Src is catalyti-
cally inactive. In this autoinhibited conformation, the
SH2 domain binds to pY
i
on the C-terminal tail, and
the Src homology 3 (SH3) domain binds to the linker
between the SH2 and kinase domains at the back of
the small lobe, preventing the formation of a produc-
tive catalytic cleft [29]. Thus, these interactions clamp
the kinase domain in an inactive conformation [30].
We refer to this inactive Src form as S
i
(pY
i
,Y
a
)or
simply S
i
(Fig. 1). Under the basal conditions observed
in vivo, 90–95% of Src can be in this dormant state
[12]. Dephosphorylation of pY
i
by transmembrane
phosphatases (PTPa, PTP k or PTPe) or by cyto-
plasmic phosphatases yields the partially active form,
S, where both sites Y
i
and Y
a
are dephosphorylated,
S(Y
i
,Y
a
) [31]. This reaction is shown as step 1 in the
kinetic scheme presented in Fig. 1. Phosphorylation of
SonY
i
by Csk inactivates S, yielding S
i
(step 2 in
Fig. 1).
A hallmark of the Src kinetic cycle is autophospho-
rylation of the activation site Y
a
, which was reported
to be intermolecular catalysis [28,32]. This is shown as
step 3, which yields the fully active form S
a1
(Y
i
,pY
a
).
Phosphatases, including PTP1B, dephosphorylate pY
a
and convert S
a1
back to S (step 4). For at least two
SFKs (Src and Yes), it was reported that autophos-
phorylation prevents deactivation, but not phosphory-
lation of S
a1
by Csk [5,7]. Step 5 in Fig. 1 represents
the phosphorylation of S
a1
on site Y
i
, resulting in the
dually phosphorylated form S
a2
(pY
i
,pY
a
) with cata-
lytic activity comparable to that of S
a1
[7,8,33].
Dephosphorylation on pY
i
or pY
a
converts S
a2
into
S
a1
(step 6) or S
i
(step 7), respectively. The transition
from the catalytically inactive form S
i
(pY
i
,Y
a
) to the
dually phosphorylated form S
a2
(pY
i
,pY
a
) was not
observed [7], and there is no such reaction in Fig. 1.
The resulting kinetic scheme consists of two cycles of
opposing activation/deactivation reactions (steps 1–4)
and a ‘bypass’ from an active S
a1
/S
a2
conformation to
an inactive S
i
conformation (steps 5–7); a structure
that hints at the complex input–output dynamics [34].
Kinetic equations
The rates of reactions catalyzed by ‘external’ phospha-
tases and kinases (Fig. 1) are described by Michaelis–
Menten type expressions. When the Michaelis constant
for a particular reaction of the SFK (de)activation
cycle is substantially larger than the concentration of
the corresponding SFK form (or the total SFK abun-
dance), the rate is approximated by a linear expression.
Although a detailed description at the level of elemen-
tary steps that uses the mass-action kinetics would be
more precise, it would require a much greater number
of variables and unknown parameters. Importantly,
the complex Src cycle dynamics demonstrated in the
present study holds true for a mass-action description
of all elementary steps.
Using a model, we delineate essential features that
generate bistability, sustained oscillations or excitable
behavior of Src temporal responses. Interestingly, these
essential properties arise largely from the interaction
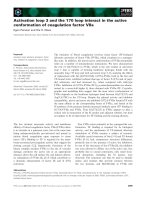
Fig. 1. Kinetic scheme of the Src activation/deactivation cycle. Four
possible forms of the Src molecule are shown. S
i
is the autoinhibit-
ed conformation, where the inhibitory tyrosine residue is phosphor-
ylated and the activatory residue is dephosphorylated; S is the
partially active form, where both the inhibitory and activatory resi-
dues are dephosphorylated; S
a1
is the fully active conformation,
where the inhibitory tyrosine residue is dephosphorylated and the
activatory residue is phosphorylated; and S
a2
is the fully active
form, where both the inhibitory and activatory residues are phos-
phorylated. The solid lines with arrows present the Src cycle reac-
tions catalyzed by the indicated enzymes. The dotted green lines
specify intermolecular autophosphorylation reactions.
Switches, pulses and oscillations in Src signaling N. P. Kaimachnikov and B. N. Kholodenko
4104 FEBS Journal 276 (2009) 4102–4118 ª 2009 The Authors Journal compilation ª 2009 FEBS
circuitry of the Src (de)activation cycle and not only
from the reaction kinetics. A critical nonlinearity is
brought about by intermolecular autophosphorylation
of Y
a
on S. Any of the partially or fully active Src
forms, S, S
a1
or S
a2
, can catalyze this reaction (step 3
in Fig. 1), which involves the following processes:
SþS Ð
k
f
S
k
r
S
S Á S À!
k
cat
S
S þ S
a1
S
a1
þS Ð
k
f
a1
k
r
a1
S
a1
Á S À!
k
cat
a1
S
a1
þ S
a1
S
a2
þS Ð
k
f
a2
k
r
a2
S
a2
Á S À!
k
cat
a2
S
a2
þ S
a1
ð1Þ
The autophosphorylation rate (v
3
) is the sum of the
rates catalyzed by each form. Applying quasi steady-
state (QSS) approximation for the intermediate com-
plexes, we obtain a simple expression for v
3
:
v
3
¼
k
cat
S
K
S
½Sþ
k
cat
a1
K
a1
½S
a1
þ
k
cat
a2
K
a2
½S
a2
½Sð2Þ
where k
cat
S
; k
cat
a1
; k
cat
a2
and K
S
¼ðk
r
S
þ k
cat
S
Þ=k
f
S
; K
a1
¼
ðk
r
a1
þ k
cat
a1
Þ=k
f
a1
; K
a2
¼ðk
r
a2
þ k
cat
a2
Þ=k
f
a2
are the catalytic
and Michaelis constants, respectively, of component
processes involved in step 3. Because the forms S
a1
and
S
a2
were reported to have approximately similar cata-
lytic activities [7,33], we assume that k
cat
a1
=K
a1
$ k
cat
a2
=K
a2
for illustrative purposes. Notably, Src association with
the plasma membrane can lead to a significant increase
in the k
cat
/K
M
ratio of intermolecular autophosphoryla-
tion, making this ratio larger than such ratios for solu-
ble kinases and phosphatases [35].
Given the rate v
3
nonlinearity that arises from inter-
molecular interactions (Eqn 2), we next show that the
only remaining prerequisite for bistable, excitable and
oscillatory Src responses is the saturability of step 4
or/and steps 5 or 7 (regardless whether step 3 is far
from saturation or not). Because recent evidence indi-
cates that PTP1B activity can be saturable in live cells
[36], we first assume the saturability of step 4 (as a
minimal requirement for the complex dynamics) and
consider other nonlinear rate dependencies later.
Together with Eqn (2), the rate expressions for a basic
model are described as:
v
1
¼ k
1
½S
i
; v
2
¼ k
2
½S; v
4
¼
V
max
4
½S
a1
K
4
þ½S
a1
;
v
5
¼ k
5
½S
a1
; v
6
¼ k
6
½S
a2
; v
7
¼ k
7
½S
a2
ð3Þ
The first-order rate constants, k
1
, k
2
, k
5
, k
6
and
k
7
, approximate the k
cat
½E=K
M
¼ V
max
=K
M
ratios for
the corresponding enzyme reactions and have dimen-
sion of 1/time. Although linear approximation of the
enzyme rate allows lumping three parameters k
cat
,
[E] and K
M
into the apparent first-order constant,
below we also use the enzyme concentrations, such
as [RPTP], [Csk] and [PTP1B], as parameters that
mirror stimulation or changes in the external condi-
tions.
We consider the time scale on which the total Src
concentration (S
tot
) is conserved. Neglecting the con-
centrations of dimers, S Á S; S
a1
Á S; S
a2
Á S(i.e.
assuming unsaturated condition for step 3; this simpli-
fying assumption is relaxed below), [S] is expressed
as a linear combination of the following independent
concentrations:
½S¼S
tot
À½S
i
À½S
a1
À½S
a2
ð4Þ
It is convenient to introduce dimensionless concen-
trations equal to the relative fractions of Src in each
form:
s
i
¼½S
i
=S
tot
; s ¼½S=S
tot
; s
1
¼½S
a1
=S
tot
; s
2
¼½S
a2
=S
tot
ð5Þ
The conservation of the total Src concentration
(Eqn 4) leaves only three independent variables in the
kinetic scheme of Fig. 1, and using Eqns (2–5) allows
Src dynamics to be described as:
ds
i
dt
¼
v
2
À v
1
þ v
7
S
tot
¼ k
2
ð1 À s
i
À s
1
À s
2
ÞÀk
1
s
i
þ k
7
s
2
ð6Þ
ds
1
dt
¼
v
3
Àv
4
þv
6
Àv
5
S
tot
¼ k
3
1 Às
i
Às
1
Às
2
ðÞdð1 Às
i
Às
1
Às
2
Þþs
1
þ s
2
ðÞ
À
k
4
s
1
bþs
1
þk
6
s
2
Àk
5
s
1
ð7Þ
ds
2
dt
¼
v
5
Àv
6
Àv
7
S
tot
¼k
5
s
1
Àðk
6
þk
7
Þs
2
ð8Þ
k
3
¼
k
cat
a1
K
a1
S
tot
; d ¼
k
cat
S
K
S
=
k
cat
a1
K
a1
; k
4
¼ V
max
4
=S
tot
; b ¼ K
4
=S
tot
Note that a completely dimensionless differential
equation system can be obtained by introducing
dimensionless rates (w) and time (s), for example, as:
w
i
¼ v
i
=V
max
4
; s ¼ k
4
t. Although this reduces the num-
ber of parameters by one (giving a minimal number of
independent parameter combinations), perturbation to
the rate of a single step, V
max
4
, will change many other
N. P. Kaimachnikov and B. N. Kholodenko Switches, pulses and oscillations in Src signaling
FEBS Journal 276 (2009) 4102–4118 ª 2009 The Authors Journal compilation ª 2009 FEBS 4105
parameters and, for clarity of exposition, we present
the analysis of the Src cycle in terms of Eqns (6–8).
Intrinsic regulatory properties of the Src (de)activation
cycle responsible for toggle switches and oscillations
The available experimental data show wide ranges of
kinetic parameters for the kinases and phosphatases
that catalyze the Src cycle reactions (see, Table S1)
and warrant a detailed exploration of Src responses
under various conditions that encompass the vast
parameter space. Variation of the apparent first-order
rate constants k
1
and k
2
mimic Src activation and
deactivation. These (de)activation processes are
brought about by stimulation of a plethora of cellular
receptors and signaling pathways. For example, after
growth factor stimulation, the SH2 domain of SFK
can bind to phosphotyrosines on activated RTKs [37].
This releases the intramolecular association of the
SFK SH2 domain with an inhibitory phosphotyrosine
(pY
i
) in the C-terminus, facilitating pY
i
dephosphory-
lation, which is modeled as an increase in k
1
. Simi-
larly, other SH2 and SH3 domain-containing proteins
that are recruited to the membrane by activated
receptors can interact with pY
i
, alleviating the intra-
molecular inhibition of SFK [2,38]. The changes in
the active RPTP and Csk fractions correspond to
varying rate constants k
1
, k
6
and k
2
, k
5
, respectively
(Fig. 1). The model accounts for the apparent first-
order rate constant (k
3
) of the intermolecular
phosphorylation step being greater than the other
first-order rate constants as a result of Src membrane
localization [35].
A central result of the present study is that the com-
plex dynamics of Src responses can be understood in
terms of a simple basic model of the Src (de)activation
cycle in the absence of any imposed external feedback.
To explain how toggle switches (bistability) and oscil-
lations arise, we first examine the steady-state proper-
ties of the Src cycle. The analysis can be perceived
readily if we plot two QSS dependencies of variables
(which are the relative Src fractions) on one plane.
This graphical representation is useful because all
steady states of the Src cycle correspond to the points
where these curves intersect. For example, we can
immediately detect bistability as the case when these
curves intersect in three different points. We consider
two of three independent variables under stationary
conditions, whereas the remaining variable changes
with time. Because of the algebraic structure of Eqns
(6–8), it is convenient to consider the variable s
2
at
steady state for each of the two QSS curves, where
either s
i
or s
1
are allowed to change. Equating the time
derivative in Eqn (8) to zero (ds
2
/dt = 0), s
2
is
expressed in terms of s
1
, as:
s
2
¼ ns
1
; n ¼ k
5
=ðk
6
þ k
7
Þð9Þ
We see now that nonlinearities of the rates v
3
(brought about by intermolecular interactions) and v
4
lead to a Z-shaped QSS dependence of the active Src
fraction (s
1
or s
2
) on the inactive fraction (s
i
). After
substitution of Eqn (9) into Eqn (7) and equating the
time derivative to zero (ds
1
/dt = 0), we obtain a qua-
dratic equation, which determines the first QSS curve:
k
3
1 Às
i
Àð1þnÞs
1
ðÞdð1 Às
i
Þþð1ÀdÞð1þnÞs
1
ðÞ
À
k
4
s
1
bþs
1
À k
7
ns
1
¼0
ð10Þ
The solution to this quadratic equation is given in
the legend to Fig. S1. A simple graphical analysis
shows that up to three different s
1
values can corre-
spond to a single s
i
value. This Z-shaped plot of this
first QSS curve, s
1
versus s
i
, is illustrated in Fig. 2 (see
also the Fig. S1). The second QSS curve is obtained
from the condition ds
i
/dt = 0 (Eqn 6). Because, in our
basic model, both Eqns (6 and 9) are linear, this QSS
curve is a straight line on the s
i
, s
1
plane (Fig. 2)
(a nonlinear case is considered in a separate section):
s
1
¼ as
i
À b; a ¼
k
1
þ k
2
k
7
n À k
2
ð1 þ nÞ
; b ¼
k
2
k
7
n À k
2
ð1 þ nÞ
ð11Þ
The slope of this line can be positive or negative,
depending on the inter-relationship between the rate
constants of the following steps in Fig. 1: S fi S
i
(k
2
), S
a1
M S
a2
(k
5
, k
6
) and S
a2
fi S
i
(k
7
). The slope
is positive, when:
1=k
2
>1=k
7
þ 1=k
5
þ k
6
=k
5
k
7
ð12Þ
and is negative otherwise. It was reported that auto-
phosphorylation facilitates the phosphorylation of
SFK by Csk [39,40], implying that 1/k
2
>1/k
5
(Fig. 1). Therefore, at least for sufficiently large k
7
(PTP1B concentrations), Eqn (12) is satisfied, resulting
in a positive slope of the second QSS curve.
Figure 2 shows that there can be from one (O)to
three (O
1
, O
2
, O
3
) points of intersection between the
two QSS curves (a Z-shaped and linear), which present
all steady states of the Src cycle. When there are three
intersections, the steady state O
1
at the lower branch of
the Z-shaped curve (i.e. low Src activity) and the state
O
3
at the upper branch (i.e. high Src activity) are both
Switches, pulses and oscillations in Src signaling N. P. Kaimachnikov and B. N. Kholodenko
4106 FEBS Journal 276 (2009) 4102–4118 ª 2009 The Authors Journal compilation ª 2009 FEBS
stable, whereas the intermediate state O
2
is unstable
(Fig. 2A, B). At the stable lower or upper steady-state
branches of the Z-shaped curve, Src behaves as a toggle
switch that responds abruptly to gradually increasing
or decreasing stimuli. In Fig. 3, the stimulus is pre-
sented as a series of relatively small, stepwise changes
in the active level of receptor-type phosphatase RPTP
(indicated by numerals 1–3). The initial increase in
[RPTP] from level 1 to 2 leads to a small increase in the
Src activity, which remains low (at the lower branch of
the steady-state dependence of Src activity on [RPTP];
Fig. 3A). The next incremental increase in [RPTP] to
level 3 that is higher than a critical value, correspond-
ing to point P
1
in Fig. 3A (termed the turning point),
changes Src activity dramatically. The time course
(Fig. 3B) shows a rapid jump (with an overshoot) from
the low-activity branch in Fig. 3A (Off state) to the
high-activity branch (On state). Importantly, the rever-
sal of stimulus to level 2 does not return the Src activity
to its Off state. Bistable systems always display hystere-
sis, meaning that the stimulus must exceed a threshold
to switch the system to another steady state, at which it
may remain, when the stimulus decreases. To return to
the initial Off state, [RPTP] should decrease below the
critical value that corresponds to turning point P
2
in
Fig. 3A. Thus, Src activity can be high or low under
exactly the same conditions depending on whether the
stimulus was higher or lower than the threshold (i.e.
the stimulation history). Similarly, bistable switches in
Src activity may be observed for gradual changes in
active Csk concentration.
When there is only one point of intersection between
the two QSS curves and, thus, one steady state, this
state can be either stable or unstable. Depending on
the stimulation level and other conditions, in a stable
steady state, Src activity can be low or high (Fig. 2A,
B). In the resting state observed in vivo, Src activity is
very low, s
1
$ 0.9–0.95 [12]. An increase in the stimu-
lus level can gradually increase Src activity, or transfer
the system into a bistable domain, where a further
increase in the stimulus results in a switch-like change
in Src activity. When the condition expressed by Eqn
(12) holds true (i.e. the slope of the second QSS curve
is positive), a single steady state can be unstable, sur-
rounded by a limit cycle (Fig. 2C), which corresponds
to sustained oscillations in Src activity (Fig. 3C, D).
Toggle switches in Src activity are likely to occur when
the activities of both activatory phosphatase (RPTP)
and inhibitory kinase (Csk) are high, whereas Src oscil-
lations may occur when these activities are low (Figs 2
and 3; see also in more detail below). Close to this sta-
ble oscillatory pattern, a stepwise increase in stimulus
can lead to oscillations, whereas, at higher RPTP and
A
B
C
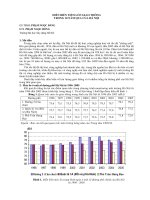
Fig. 2. Different types of QSS curve intersections determine the
Src cycle steady states and dynamics. One stable steady state (O)
or three steady states (stable O
1
and O
3
and unstable O
2
) exist for
both positive (A, C) and negative (B) slopes of the linear (blue) QSS
curve (Eqn 11), which intersects the Z-shaped (black) QSS curve
(Eqn 10). The parameter values are: (A) k
1
= 0.2 s
)1
(line 1),
0.34 s
)1
(line 2) and 0.6 s
)1
(line 3), k
2
= 0.3 s
)1
; (B) k
1
= 0.5 s
)1
(line 1), 0.8 s
)1
(line 2) and 1.5 s
)1
(line 3), k
2
=1s
)1
and (C) a sin-
gle unstable steady state (O) surrounded by a limit cycle (red),
which corresponds to stable oscillatory pattern of Src activity,
k
1
= 0.1 s
)1
, k
2
= 0.01 s
)1
, k
5
= 2s
)1
and k
6
= 1s
)1
. The resting
state in vivo (s
i
= 0.916, s
1
= s
2
= 7.32 · 10
)5
) was taken as the
initial condition (‘rest’); the movement direction is shown by
arrows. For all curves in (A) to (C), the remaining parameters are,
k
3
=20s
)1
, k
4
=1s
)1
and k
7
=1s
)1
, b = 0.01, d = 0.05, n =1.
N. P. Kaimachnikov and B. N. Kholodenko Switches, pulses and oscillations in Src signaling
FEBS Journal 276 (2009) 4102–4118 ª 2009 The Authors Journal compilation ª 2009 FEBS 4107
Csk activities, such an increase triggers switch-like
behavior.
Src excitable behavior in response to transient
stimuli
Under proper conditions, a single stable steady state
with low basal Src activity can become excitable. In
this case, the Src protein behaves as an excitable device
with a built-in excitability threshold. Depending on the
magnitude and duration of a transient stimulus, Src
activation responses fit into one of two distinct classes
of either low or high amplitude responses, whereas
there are no intermediate responses that are merely
proportional to the stimulus. Figure 4A shows that, if
the duration of a step-like increase in the stimulus (k
1
)
is below a critical threshold value, the magnitude of
Src response is low. In this case, after a small raise,
active Src fractions (s
1
and s
2
) remain near the basal
state. If the stimulus duration exceeds the threshold
value, a large overshoot in Src activity occurs before it
returns to the low, basal state.
Figure 4B helps us understand this excitable behav-
ior by presenting the pulse of Src activity in the plane
of the inactive and active fractions, s
i
and s
1
. If the
duration of the stimulus exceeds the critical value, the
trajectory in the (s
i
, s
1
) plane (shown in red) passes the
turning point at the lower branch of the Z-shaped QSS
curve (shown in black). Because its intermediate
branch harbors unstable states, the trajectory makes
an overshoot, yielding a high-amplitude response.
Instructively, this also explains a relatively large lag
period for the Src activity spike to occur (Fig. 4A)
because the basal state of Src at the lower branch
(point 1) is far from the turning point. If the initial Src
state is closer to the turning point, both the threshold
stimulus duration and lag period become shorter (see,
Fig. S2). In this case, there is also a recovery period.
After the pulse amplitude decreases, the same stimulus
cannot excite the system again, until the trajectory
returns to the initial state. Sub-threshold durations of
the stimulus give low-amplitude responses because tra-
jectories remain near the lower branch of stable steady
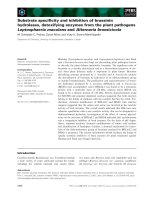
A
B
C
Fig. 3. Bistability and oscillations in the Src cycle. (A) Hysteresis in
steady-state responses of active Src fraction (s
1
) to changes in the
active RPTP concentration ([RPTP]). The dotted line corresponds to
unstable steady states located at the intermediate branch of the
curve between turning points P
1
and P
2
(shown in bold). (B) The
time dependence of s
1
responses to stepwise changes in active
[RPTP]; these changes are conditionally taken as 9 n
M variations.
Arrows in (B) show the time point of step changes in [RPTP]. The
corresponding [RPTP] values, 117.5, 126.5 and 135.5 n
M, are indi-
cated by dashed lines 1–3 in (A) and shown by upper line in (B).
The catalytic efficiency of RPTP (steps 1 and 6) is k
cat
/
K
M
= 3.6 · 10
)3
and 0.02 n M
)1
Æs
)1
); the first-order rate constants,
k
1
and k
6
are calculated as k
cat
[RPTP]/K
M
(Eqn 3); k
2
= 0.5 s
)1
,
k
5
=10s
)1
. (C) Sustained oscillations of Src fractions (s
1
, black; s
2
,
red; s
i
, black; s, blue). The time behavior corresponds to the limit
cycle trajectory shown in Fig. 2C, arrows indicate the onset of stim-
ulation, k
1
= 0.1 s
)1
; k
2
= 0.01 s
)1
, k
5
= 2s
)1
, k
6
= 1s
)1
. For all
curves in (A–C), the remaining parameters are given in the legend
to Fig. 2.
Switches, pulses and oscillations in Src signaling N. P. Kaimachnikov and B. N. Kholodenko
4108 FEBS Journal 276 (2009) 4102–4118 ª 2009 The Authors Journal compilation ª 2009 FEBS
states. Interestingly, this excitable behavior of the solu-
tions of Src kinetic equations parallels, on a different
time scale, the dynamics of the solutions to the classi-
cal Hodgkin–Huxley and FitzHugh–Nagumo equa-
tions that describe neural excitation and firing of
neuron impulses.
Figure 4C illustrates Src excitable behavior in
response to perturbations to the initial concentrations
of the active form (which could correspond to an
in vitro experiment where a small amount of activated
Src is added to the medium). Similar to parameter
perturbations, sub-threshold changes in the active
Src concentration yield small amplitude responses,
whereas any perturbation that exceeds the threshold
results in a large response with almost standard, high
amplitude. This over-threshold excitation leads to a
large excursion of the trajectory in the (s
i
, s
1
) plane,
before returning to the initial steady state (Fig. 4D).
A pulse of Src activity, which is pivotal for mitosis,
can be explained by Src excitability that follows grad-
ual activation by cyclin-dependent kinases [16,41].
Activation of Src kinases initiates signaling pathways
that are required for DNA synthesis. Therefore, the
Src excitable behavior, which yields either a low-
activity response or high-activity pulse, responding to
stimuli under or over threshold, respectively, can be
implicated into cell-fate decision processes [42].
A
B
C
D
Fig. 4. Src excitable behavior in response to rectangular pulse
inputs (A, B) and perturbations to the initial concentrations (C, D).
Initially, Src resides in a stable, but excitable steady state. For sub-
threshold or over threshold stimuli, responses of the active Src
fractions, s
1
and s
2
, remain small or undergo large excursions, gen-
erating high-amplitude responses, before returning to the same
basal steady state. (A) At time t
0
= 5 s (marked by arrow), the rate
constant k
1
was increased from the basal level of 0.001 to 0.1 s
)1
[from point 1 in (B) to the level that corresponds to the unstable
steady state, point 2]. After time t
1
= t
0
+ 9 s (bold line 1) or
t
2
= t
0
+ 10 s (bold line 2), k
1
was decreased to the basal level.
The time-dependent responses of the active Src fractions, s
1
(black) and s
2
(blue), are shown by dashed and solid lines for 9 and
10 s stimulation periods, respectively. (B) The trajectories (red) that
correspond to the time-dependent responses in (A) and the QSS
curves (black and blue) are shown in the plane of s
1
and s
2
. (C) At
time t
0
= 5 s, a perturbation (Ds
1
) to the steady state increased s
1
from 0.0082 to 0.03 (point 1) or 0.04 (point 2). Accordingly, the
equation used for the total of the normalized concentrations was:
s
i
+ s + s
1
+ s
2
=1+Ds
1
. The time-dependent responses to a
sub-threshold perturbation (starting from point 1) and to a perturba-
tion over threshold (starting from point 2) are shown by dashed and
solid lines, respectively. (D) The trajectories (red) that correspond
to the time-dependent responses in (C) and the QSS curves (black
and blue) are shown in the plane of s
i
and s
1
. k
1
= 0.03 s
)1
. For all
plots shown in (A–D), the remaining parameters are given in the
legend to Fig. 2C.
N. P. Kaimachnikov and B. N. Kholodenko Switches, pulses and oscillations in Src signaling
FEBS Journal 276 (2009) 4102–4118 ª 2009 The Authors Journal compilation ª 2009 FEBS 4109
Revealing different types of Src dynamics by
partitioning the parameter space
The dynamic behavior of the Src cycle in relationship
to various kinetic parameters can be conveniently
described by dividing a plane of two selected parame-
ters into areas, which represent different types of
dynamic responses. This partitioning of the parameter
space helps us to perceive how changes in the stimulus,
Src activators and inhibitors, and the Src abundance
affect the basal low activity state of Src and bring
about oscillations, pulses and toggle switches in Src
activity.
Figure 5 shows regions in the plane representing
different concentrations of active Csk and RPTP,
which correspond to distinct Src dynamics, including
monostable, bistable, oscillatory and excitable behav-
ior. These regions are separated by so-called bifurca-
tion boundaries, where abrupt, dramatic changes in
the steady-state and dynamic behavior of the Src cycle
occur. In Fig. 5, these boundaries are determined by
two different bifurcations. One is a saddle-node bifur-
cation where an unstable steady state (termed saddle)
merges with another steady state (node). This event
corresponds to the abrupt change (presence or
absence) of switch-like, bistable behavior [43]. The
other is the Hopf bifurcation, where a steady state
changes its stability, accompanied by the appearance
or disappearance of a limit cycle (see Experimental
procedures). A stable limit cycle presents an oscillatory
pattern of Src activity, as shown in Fig. 3C.
A single, stable steady state of Src activity exists
within two large areas that are marked by number 1 in
the plane of the Csk and RPTP concentrations. Within
these two regions of monostability, there are parameter
sets where the QSS dependence of the active Src frac-
tion on the inactive fraction given by Eqn (10)
becomes a monotonically decreasing curve. For exam-
ple, this happens for the large n values, corresponding
to s
2
/s
1
>> 1 [(Eqn 9); see also the Fig. S3E]. In this
case, changes in the Src activity follow changes in the
stimulus, so that an increase or decrease in the stimu-
lus amplitude merely causes Src activity to increase or
decrease. However, within other parts of monostable
region 1, Src activity displays excitable behavior where
Fig. 5. Bifurcation diagrams unveil different Src dynamics. (A) In
the plane of active RPTP and Csk concentrations, bifurcation
boundaries separate regions of different types of Src dynamics,
determined by the Hopf (red lines) and saddle-node (black lines)
bifurcations. These regions are numbered: 1, a single stable steady
state; 2, bistability domain, two stable states separated by a sad-
dle; 3, oscillations, a single unstable steady state; 4, oscillations,
three unstable steady states; 5, one stable and two unstable
steady states. The dashed line parallel to the [RPTP] axis crosses
the plane at 25 n
M [Csk]. The insert shows the zoomed-in region 4.
(B) One parameter bifurcation diagrams represent steady-state
dependencies of Src active and inactive fractions s
1
and s
i
on
[RPTP] at four different constant [Csk] values, indicated near each
curve (i.e. curves have different colors). Closed circles are turning
points; dotted lines correspond to unstable steady states. Csk cata-
lytic efficiency is, k
cat
/K
M
= 0.002 and 0.04 nM
)1
Æs
)1
for steps 2 and
5; the first-order rate constants, k
2
and k
5
are calculated as
k
cat
[Csk]/K
M
(Eqn 3). The remaining parameters are the same as in
the legend to Fig. 3.
A
B
Switches, pulses and oscillations in Src signaling N. P. Kaimachnikov and B. N. Kholodenko
4110 FEBS Journal 276 (2009) 4102–4118 ª 2009 The Authors Journal compilation ª 2009 FEBS
similar, high-amplitude responses occur for any stimu-
lus amplitude over a certain threshold (Fig. 4). The
next large area, which is marked by numeral 2, corre-
sponds to bistable behavior. In this region, there are
three steady states: two stable (Off and On) states and
one intermediate unstable (saddle) state. A typical bio-
logical scenario for an abrupt transition (saddle-node
bifurcation) from a single steady state in region 1 to
three steady states in region 2 is shown in Fig. 3A,
where two new steady states emerge when gradually
increasing [RPTP] passes the turning point P
2
, whereas
Src activity switches to a high state only after [RPTP]
passes the turning point P
1
(Fig. 3B). Similar to region
1, region 2 spreads out to arbitrary large activities
of Csk and RPTP, demonstrating robustness of the
bistable behavior.
Oscillations occurring within regions 3 and 4 corre-
spond to lower concentrations of active Csk and RPTP
than the values that characterize the bistable region.
Similar to a bistable regime, oscillatory behavior is
robust, although it occupies smaller region in this
parameter plane (Fig. 5). In region 3, there is a single
unstable steady state, whereas, in a smaller region 4,
there are three unstable steady states; yet, within each
region, there is a stable limit cycle that surrounds one
(region 3) or three (region 4) unstable states, present-
ing sustained oscillations in Src activity. The remaining
regions 5 and 6 harbor a stable steady state with low
or high Src activity, respectively, and two unstable
steady states each. In both areas, excitable Src
responses to changes in the initial active Src fraction
are observed (region 6 is too small to be seen on the
scale of Fig. 5).
By crossing the parameter plane parallel to the
[RPTP] axis at a different constant [Csk], we obtain
one-parameter bifurcation diagrams, which present dif-
ferent scenarios of how changes in active RPTP can
influence the steady-state magnitudes and dynamics of
Src fractions. At relatively low [Csk] = 25 nm, a grad-
ual increase in the stimulus (expressed in terms of
active [RPTP]), first leads to a gradual increase in the
active Src fraction s
1
and a decrease in the inactive
fraction s
i
(Fig. 5B. left black curves). This [RPTP]
range corresponds to region 1 (see dashed line parallel
to the [RPTP] axis at [Csk] = 25 nm in Fig. 5A).
With further increase in the stimulus, the steady state
loses its stability, which coincides with entering region
3, where Src displays oscillatory behavior (parts of the
black curves shown by a dotted line), and then the sta-
tionary regime becomes again stable at high [RPTP].
Monotonic and sharply nonmonotonic changes in s
1
and s
i
, respectively, reflect the progression along a
Z-shaped QSS curve in the (s
i
, s
1
) plane shown in
Fig. 2. A larger variety of Src responses to changes in
[RPTP] is observed at higher [Csk], where crossing the
parameter plane in Fig. 5A involves entering more
regions with different dynamics. For example, the blue
curves (second from the left in Fig. 5B) capture
dynamics that corresponds to crossing regions 1, 5, 4,
3 and again region 1 with a gradual increase in
[RPTP]. An increase in the stimulus first brings about
excitable Src behavior and then, when [RPTP] passes
the turning point (marked bold), lands the system into
the oscillatory domain, whereas, with a further
increase in the stimulus, a single steady state regains
stability. The remaining curves in Fig. 5B (red and
green) display bistability domains; however, red curves
(155 nm [Csk]) also have parts with one stable and two
unstable states displaying excitable Src responses.
How are the period and amplitude of Src oscilla-
tions controlled by external cues? Signals, such as
growth factor and cytokines, lead to dephosphoryla-
tion of the inhibitory phosphotyrosine pY
i
, which is
modeled as an increase in the RPTP activity, whereas
an increase in the Csk activity raises the pY
i
level (see
kinetic scheme in Fig. 1). Figure 6 demonstrates signif-
icant frequency modulation by both activating and
inhibitory stimuli and more moderate changes in the
amplitude of the oscillations. An increase in the acti-
vating signal or decrease in the inhibitory signal
decreases the period of Src oscillations. This frequency
modulation resembles the previously described modu-
lation of Ca
2+
oscillations by increasing agonist con-
centration [44]. The dependences of the period of
oscillations on the RPTP and Csk concentrations
almost mirror each other, although there are quantita-
tive differences in the changes of the period within the
oscillatory domain: a 2.7-fold decrease (from the high-
est to the lowest values) with a 1.5-fold RPTP increase
and a 2.1-fold increase with a 1.7-fold Csk increase.
Interestingly, the frequency modulation turns into the
opposite mode near one of the borders where the
unstable steady state (shown by the dotted line)
becomes stable, although the oscillations continue to
persist within a small range after the Hopf bifurcation.
The coexistence of oscillations (limit cycle) and a stable
steady state implies subcritical Hopf bifurcation and
the appearance of an unstable limit cycle. The unstable
and stable limit cycles collide and annihilate in a
global bifurcation near the oscillatory borders.
Saturability and consequent nonlinear rate dependen-
cies do not change the repertoire of Src responses
A detailed analysis of the model shows that relaxing
the simplifying assumption that steps 1, 2 and 5–7
N. P. Kaimachnikov and B. N. Kholodenko Switches, pulses and oscillations in Src signaling
FEBS Journal 276 (2009) 4102–4118 ª 2009 The Authors Journal compilation ª 2009 FEBS 4111
follow linear, unsaturated kinetics (Eqn 3) does not
change the repertoire of Src dynamic responses dis-
cussed above. Moreover, saturability of step 4 (transi-
tion from the active S
a1
to inactive S
i
conformation) is
critical for bistability and oscillations only when other
steps follow linear kinetics, as was assumed initially
for illustrative purposes. This condition can be
replaced by saturability of step 5 or step 7 in the
bypass from S
a1
to S
i
(Fig. 1). In Fig. S4A, B, it is
shown that both Src oscillatory patterns and bistability
are observed when step 7 is saturable, whereas step 4
is not. However, because both steps 4 and 7 are cata-
lyzed by the same enzyme (PTP1B), we also demon-
strated that all different types of the Src dynamics
continue to occur when rates v
4
and v
7
are saturated
by their substrates (see, Fig. S4C, D).
Next, we examined how saturation of RPTP-cata-
lyzed reactions 1 and 6 influences Src responses and
found that all dynamic regimes described above still
persist (see, Fig. S4E, F). Interestingly, our calcula-
tions suggest that nonlinearities arising from saturabili-
ty of steps catalyzed by PTP1B and Csk enlarge the
bistability domain and decrease the oscillatory region
in the parameter space, whereas saturability of RPTP-
catalyzed steps exhibits the opposite effect. Similarly,
the use of a more precise total QSS approximation
[45,46] that considers explicitly the concentrations of
enzyme–enzyme complexes generated in autophospho-
rylation step 3 does not change our conclusions about
the diverse dynamics of the Src cycle. As shown in
Fig. S5 and taking into account the high concentra-
tions of Src dimers, which results in the saturability of
step 3, bistability, Src excitable switches and oscilla-
tions can be observed for some degree of saturation.
Proposed experimental verification and
conclusions
Our findings of potentially bistable, oscillatory and
excitable behavior of the Src cycle await experimental
A
B
C
D
Fig. 6. Control of the period and amplitude of Src oscillations by
the activities of the activatory phosphatase RPTP and inhibitory
kinase Csk. Dependence of the oscillation amplitude (A) and period
(B) on the active RPTP concentration at constant Csk concentration
(25 n
M). The amplitude is the difference between maximal (s
1max
)
and minimal (s
1min
) values of the relative active Src fraction (red
curves). The black solid line indicates stable steady states, whereas
the dotted black line shows unstable steady states (steady state
values are designated as s
1SS
). Dependence of the oscillation ampli-
tude (C) and period (D) on the active Csk concentration at constant
RPTP concentration (30 n
M). The parameter values are indicated in
the legend to Fig. 5.
Switches, pulses and oscillations in Src signaling N. P. Kaimachnikov and B. N. Kholodenko
4112 FEBS Journal 276 (2009) 4102–4118 ª 2009 The Authors Journal compilation ª 2009 FEBS
testing. The results based on the mathematical model
suggest a feasible experimental design for in vitro tests
of predictions about the Src dynamics. An advantage
of an in vitro system with purified Src, Csk and rele-
vant phosphatases is that it can be used to explore
wide ranges of precisely set down enzyme concentra-
tions. Although Src (de)activation reactions can pro-
ceed in solution [28,31], the membrane localization of
proteins will facilitate the formation of protein com-
plexes and increase reaction rates [35]. To mimic the
in vivo situation, Src and other proteins can be embed-
ded into a phospholipid membrane bilayer or lipo-
somes. The Src cycle can be started by the addition of
relevant phosphatases (or other Src activators, such as
the SH2/SH3-ligands) [38] to activate step 1, followed
by the addition of Csk and ATP to the reaction med-
ium. At the selected time points, aliquots are taken,
and the different phosphotyrosine levels that corre-
spond to different Src conformations are measured by
immunoblotting using specific antibodies (note that
quantification of only the pY
a
level is sufficient to
obtain the kinetics of the active Src fractions). In addi-
tion, fluorescent resonance energy transfer biosensors
[47] can be exploited for high temporal resolution mea-
surements of Src kinetics (e.g. oscillatory or excitable
responses).
A pivotal condition for complex Src dynamics is
intermolecular autophosphorylation that leads to a spe-
cific shape of the QSS dependence of the active Src frac-
tion (s
1
) on the inactive fraction (s
i
), where a single s
i
value can correspond to three different s
1
values (Eqn
10; see also Fig. 2). Therefore, we examined how this
shape (generally referred to as a Z-shape) is affected by
changes in each of the six kinetic parameters involved
(see, Fig. S3). We found that, when the ratio d of the
catalytic efficiencies of the partially and fully active
forms (S and S
a1
) is too large, the QSS curve of Eqn (10)
becomes monotonic and loses its Z-shape (see ,
Fig. S3A). This phenomenon can be understood readily.
Indeed, the important prerequisite for bistability is posi-
tive feedback [48], which is brought about by intermo-
lecular phosphorylation of S by S
a1
and S
a2
in the Src
cycle (Fig. 1). This autophosphorylation is equivalent to
product activation that facilitates biological switches
[34], whereas autophosphorylation of S catalyzed by the
same form S counteracts this positive feedback and off-
sets bistable behavior. Similarly, small values of
k
4
¼ V
max
4
=S
tot
will halt Src in a single high activity state
(see Fig. S3B). In addition, the loss of a Z-shape by the
QSS curve and, therefore, the lack of complex dynamic
regimes can result from increases in (a) b ¼ K
4
=S
tot
; (b)
the ratio n of quasi steady-state concentrations s
2
and s
1
;
and (c) the rate constants k
3
and k
7
(see, Fig. S3C–F).
This analysis of the parameter variation effects on the
QSS curve is useful for experimental manipulations of
the concentrations of both Src effectors and their
competitive inhibitors (e.g. inactive mutants that lack
catalytic activity, but bind Src), which will change the
K
M
values.
In an in vitro system, the values of parameters, k
3
,
k
4
and b can be regulated by changing the Src abun-
dance (S
tot
). The analysis of regions with diverse Src
dynamics in the plane of the Src abundance and k
1
demonstrates that both bistability and oscillatory
regions exist above a threshold value of S
tot
(Fig. 7).
As shown in Fig. 7, changing the Src abundance and
stimulus amplitude (k
1
) ensues different Src dynamics,
including monostable, bistable, oscillatory and excit-
able behavior.
We showed that Src biological switches and bistabil-
ity might occur for both positive and negative slopes
of the QSS curve determined by Eqn (11), whereas sus-
tained oscillations and excitable Src behavior requires
a positive slope. Thus, the sign of this slope is a critical
parameter that determines the entire range of potential
dynamics displayed by the Src cycle. The slope is posi-
tive, when Eqn (12) is satisfied, and inactive Src is
regenerated preferentially from the double phosphory-
lated form of Src. Indeed, this condition is supported
by data from previous studies [39,40]. Instructively, the
negative versus positive slope is implicated in a reverse
relationship between inactive (s
i
) and active (s
1
, s
2
) Src
Fig. 7. Bifurcation diagram in the plane of the rate constant k
1
and
total Src abundance. k
1
is the rate constant of dephosphorylation of
inhibitory tyrosine in the Src C-terminus. Types of bifurcation
boundaries and the numbering of regions with different Src dynam-
ics are the same as those shown in Fig. 5. Src autocatalytic effi-
ciency is k
cat
a1
=K
a1
= 0.05 nM
)1
Æs
)1
, V
max
4
= 400 nMÆs
)1
, K
4
=4nM.
The remaining parameters are the same as those shown in the
legend to Fig. 3. The insert shows the zoomed-in region 4.
N. P. Kaimachnikov and B. N. Kholodenko Switches, pulses and oscillations in Src signaling
FEBS Journal 276 (2009) 4102–4118 ª 2009 The Authors Journal compilation ª 2009 FEBS 4113
fractions during a switch-like transition from the Off
state to On state (in the bistability domain). Regardless
of the slope, the active Src fractions increase during
the Off to On transition, whereas the value of the inac-
tive fraction (s
i
) decreases if the slope is negative and
increases otherwise (Figs 2A, B), highlighting a charac-
teristic feature to be tested against the experiment.
Discussion
Src and other SFKs are known as proto-oncogenes,
and altered Src activity is associated with human
malignancies [3,5]. In the present study, we unveil
novel, intrinsic features of the Src kinetic cycle and
show that Src overexpression, increased stimulation by
membrane receptors or decreased inhibition do not
merely hyperactivate Src, but can completely transform
its temporal behavior and cellular responses. Our find-
ings can help understand and explore deregulation of
Src signaling in cancer. A central result of our study
reveals that all necessary prerequisites for the diverse,
baroque dynamics of Src responses already exist in the
absence of external feedback regulations. The Src
(de)activation cycle alone can display bistable, oscilla-
tory and excitable behaviors, whereas external effectors
and complex regulatory loops are necessary to control
potential Src responses in the cellular context.
The reaction topology of the Src kinetic cycle
(Fig. 1) displays an illuminating structure, embracing
two cycles of opposing (de)activation reactions and a
‘bypass’ from an active conformation to an inactive
conformation. We show that biological switches (bista-
bility), oscillations and excitable behavior are intrinsic
to this kinetic structure. Even in the absence of bypass
reactions (steps 5–7 in Fig. 1), intermolecular auto-
phosphorylation (step 3) can bring about bistability
and hysteresis (results not shown),which arise from
implicit positive feedback that is equivalent to product
activation [34]. Remarkably, intermolecular autophos-
phorylation is a recurrent topic in activation of a
plethora of mammalian kinases [24–26], which war-
rants the exploration of the potential bistable behavior
for many kinases. Interestingly, a reduced Src (de)acti-
vation cycle with only one active Src form (S
a1
) can
exhibit the complex dynamics. If, for a moment, we
assume that steps 5 and 6 (Fig. 1) are much faster than
the other steps in the Src cycle, the concentrations (s
2
and s
1
) of two active Src forms become connected by
the quasi-equilibrium relationship, s
2
= K
eq
s
1
, which
formally coincides with Eqn (9) where n = K
eq
. The
reduced (planar) system with two independent vari-
ables (s
i
and s
1
) exhibits qualitatively the same complex
dynamics as that of our original model (data not
shown). We conclude that the presence of an addi-
tional, third independent variable is not absolutely
essential for the complex dynamic behavior of Src.
In small membrane compartments, where the num-
ber of SFK and effector molecules can be low, noise
influences signaling dynamics. For example, in the
bistable regime, where deterministic equations predict
that Src activity is sustained at the high level or low
level, depending on stimulus history, external or inter-
nal noise can lead to random switches between these
two stable activity states. Interestingly, imposed posi-
tive feedback increases robustness to stochastic fluctua-
tions and parameter variations. For example, although
double phosphorylation in the mitogen-activated pro-
tein kinase (MAPK) cascade can lead to bistability in
the absence of any imposed positive feedback loops
[21], positive feedback greatly enhances the robustness
of the MAPK bistable switch to noise [49].
The results of the present study shed light on recent
findings of propagating waves of Src activation along
the plasma membrane [50]. In these experiments, human
umbilical vein endothelial cells were mechanically stimu-
lated by applying the laser-tweezer traction to fibronec-
tin-coated beads adhering to the cells. As fibroneciton
binds to integrins, the local pulling force stimulated
integrins that subsequently activated Src. Intriguingly,
the local Src activation triggered the long-range propa-
gation of active Src wave into the distal cell areas away
from the site of mechanical stimulation [50]. The mecha-
nism of this wave propagation is unknown and may
include Src interactions with small GTPases and the
cytoskeleton. Instructively, purely diffusive propagation
of active Src is ruled out. Indeed, in the absence of bio-
chemical activation within the cell, Src will be deacti-
vated by inhibitory Csk phosphorylation already in the
areas that are only at a small distance from the local
stimuli [51]. Our findings suggest that Src traveling
waves can be brought about by intrinsic bistable and/or
excitable properties of the Src activation/deactivation
cycle, just as trigger waves of kinase activity arise from
bistability in kinase/phosphatase cascades [52].
Emerging evidence shows that SFKs are nonran-
domly distributed on the plasma and intracellular
membranes, often localizing to specific microdomains
with specialized functions, such as lipid rafts, caveolae,
focal adhesions and other membrane microdomains
[53]. Provided that SFK molecules do not exchange
rapidly between these microdomains, the bistable or
oscillatory behavior will be manifested in each microd-
omain, converting an analog input signal into a
defined digital signal. At the whole cell level, this sig-
nal can become analog again. Thus, a cell can build a
high-fidelity analogue–digital–analogue circuit to relay
Switches, pulses and oscillations in Src signaling N. P. Kaimachnikov and B. N. Kholodenko
4114 FEBS Journal 276 (2009) 4102–4118 ª 2009 The Authors Journal compilation ª 2009 FEBS
Src activity to downstream targets. Similarly, recently
described Ras-GTP nanoswitches generate a high-fidel-
ity analogue–digital–analogue circuit that transmits
MAPK activation [54].
Importantly, phosphatases that regulate SFK activ-
ity are also distributed inhomogeneously. It was
recently shown that there is a steady-state gradient of
PTP1B activity across the cell with lower activity in
the proximity of the plasma membrane and higher
activity in the perinuclear area [36]. Such regulation of
PTPB1 activity may generate distinct cellular environ-
ments for SFK signaling. For example, in resting cells,
Src is localized in the perinuclear area and, when cells
are stimulated with growth factors, Src moves to the
periphery [5,55]. The plasma membrane recruitment
and activation of Src kinase is required for focal adhe-
sion. It is also considered to be essential for cellular
transformation and is reported to be involved in the
alignment of early endosomes along actin filaments
[56]. These changes in Src localization that follow cell
stimulation expose Src to different phosphatase activi-
ties, which may result in different dynamic behaviors
in different cellular compartments.
We can usefully ask whether our findings can be
applicable to other protein kinase families. Interest-
ingly, the tetrameric subunit structure of the Abl/Arg
and Tec kinase families (in particular, of the c-Abl
kinase) resembles the SFK structures. The c-Abl kinase
possesses three domains (SH2, SH3 and the two-lobe
kinase domain), which can group in a precisely similar
manner as the corresponding SFK domains. For both
c-Abl and SFK, the SH2-SH3 clamp prevents the two-
lobe kinase domain to switch from a closed autoinhib-
ited conformation to an open active conformation.
Not surprisingly, it has long been considered that a
Src-like switching mechanism might control the c-Abl
kinase [30]. Furthermore, the diagrams of transitions
between the different conformational states are similar
for both kinases. Most importantly, the phosphoryla-
tion of tyrosine in the c-Abl activation loop, which is
necessary for a transition into the fully active form,
comprises intramolecular autophosphorylation [25].
We suggest that the findings of the present paper are
also applicable to the c-Abl kinase, which thus can
exhibit the intricate dynamic behavior, although such a
hypothesis awaits experimental verification.
Many SFKs initiate pathways required for DNA
synthesis [57]. The complex signaling dynamics of SFK
increases the repertoire of cellular responses to external
cues. Indeed, cell-fate decisions are often associated
with the existence of two (or several) stable steady
states. Bistability (or multistability) implies that, under
the same conditions, the state of the cell can be very
different (e.g. with high or low activity of kinases and
the expression of particular genes). Instructively, excit-
able systems can also display two distinct kinds of out-
puts, exhibiting either a low or high amplitude of
responses to a stimulus. Importantly, Src can show
both bistable and excitable behavior, thus emerging as
a robust manager of cell fate.
Experimental procedures
Software
Numerical integration, solving of implicit algebraic equa-
tions and bifurcation analysis were performed using
dbsolve software () [58]. This
software is based on previously developed numerical tech-
niques [59]. The mathematical model described here has
been submitted to the Online Cellular Systems Modelling
Database and can be accessed at .
za/database/kaimachnikov/index.html free of charge.
Calculation of the QSS curves and steady states
The QSS curves were calculated using explicit expressions
(Eqns 10, 11; see also the Fig. S1). The dependencies of
steady states on parameters were calculated by continuation
techniques, as previously described [59], and implemented
in dbsolve [58].
Determination of bifurcation boundaries
The numerical algorithms that were implemented in
dbsolve use a continuation approach and find local bifur-
cations [59]. The saddle-node bifurcation curve is found by
equating the determinant of the Jacobian matrix of Eqns
(6–8) to zero (fold bifurcation). The Hopf bifurcation curve
is determined by equating the sum of the two eigenvalues
to zero and taking only those parts of the curve where both
eigenvalues are purely imaginary.
Acknowledgements
We thank Dr W. Kolch for discussions and critical read-
ing of the manuscript. BN Kholodenko is a SFI Stokes
Professor in Systems Biology. Supported by the SFI
Centre for Science Engineering and Technology grant
and the NIH grants GM059570 and R33HL088283.
References
1 Parsons SJ & Parsons JT (2004) Src family kinases, key
regulators of signal transduction. Oncogene 23, 7906–
7909.
N. P. Kaimachnikov and B. N. Kholodenko Switches, pulses and oscillations in Src signaling
FEBS Journal 276 (2009) 4102–4118 ª 2009 The Authors Journal compilation ª 2009 FEBS 4115
2 Roskoski R Jr (2005) Src kinase regulation by phos-
phorylation and dephosphorylation. Biochem Biophys
Res Commun 331, 1–14.
3 Frame MC (2002) Src in cancer: deregulation and con-
sequences for cell behaviour. Biochim Biophys Acta
1602, 114–130.
4 Martin GS (2001) The hunting of the Src. Nat Rev Mol
Cell Biol 2, 467–475.
5 Yeatman TJ (2004) A renaissance for SRC. Nat Rev
Cancer 4, 470–480.
6 Donella-Deana A, Cesaro L, Ruzzene M, Brunati AM,
Marin O & Pinna LA (1998) Spontaneous autophos-
phorylation of Lyn tyrosine kinase at both its activation
segment and C-terminal tail confers altered substrate
specificity. Biochemistry 37, 1438–1446.
7 Sun G, Sharma AK & Budde RJ (1998) Autophospho-
rylation of Src and Yes blocks their inactivation by Csk
phosphorylation. Oncogene 17, 1587–1595.
8 Boerner RJ, Kassel DB, Barker SC, Ellis B, DeLacy P
& Knight WB (1996) Correlation of the phosphoryla-
tion states of pp60c-src with tyrosine kinase activity: the
intramolecular pY530-SH2 complex retains significant
activity if Y419 is phosphorylated. Biochemistry 35,
9519–9525.
9 Chappel J, Ross FP, Abu-Amer Y, Shaw A & Teitel-
baum SL (1997) 1,25-dihydroxyvitamin D3 regulates
pp60c-src activity and expression of a pp60c-src activat-
ing phosphatase. J Cell Biochem 67, 432–438.
10 Gil-Henn H & Elson A (2003) Tyrosine phosphatase-
epsilon activates Src and supports the transformed phe-
notype of Neu-induced mammary tumor cells. J Biol
Chem 278, 15579–15586.
11 Granot-Attas S & Elson A (2004) Protein tyrosine
phosphatase epsilon activates Yes and Fyn in
Neu-induced mammary tumor cells. Exp Cell Res 294,
236–243.
12 Zheng XM, Resnick RJ & Shalloway D (2000) A
phosphotyrosine displacement mechanism for activation
of Src by PTPalpha. EMBO J 19, 964–978.
13 Brown MT & Cooper JA (1996) Regulation, substrates
and functions of src. Biochim Biophys Acta 1287,
121–149.
14 Simons K & Toomre D (2000) Lipid rafts and signal
transduction. Nat Rev Mol Cell Biol 1, 31–39.
15 Thomas SM & Brugge JS (1997) Cellular functions reg-
ulated by Src family kinases. Annu Rev Cell Dev Biol
13, 513–609.
16 Roche S, Fumagalli S & Courtneidge SA (1995)
Requirement for Src family protein tyrosine kinases in
G2 for fibroblast cell division. Science 269, 1567–1569.
17 Fuss H, Dubitzky W, Downes S & Kurth MJ (2006)
Bistable switching and excitable behaviour in the activa-
tion of Src at mitosis. Bioinformatics 22, e158–e165.
18 Fuss H, Dubitzky W, Downes CS & Kurth MJ (2007)
Deactivation of Src family kinases: hypothesis testing
using a Monte Carlo sensitivity analysis of systems-level
properties. J Comput Biol 14, 1185–1200.
19 Fuss H, Dubitzky W, Downes CS & Kurth MJ (2008)
SRC family kinases and receptors: analysis of three acti-
vation mechanisms by dynamic systems modeling. Bio-
phys J 94, 1995–2006.
20 Ferrell JE Jr (2002) Self-perpetuating states in signal
transduction: positive feedback, double-negative feed-
back and bistability. Curr Opin Cell Biol 14, 140–
148.
21 Markevich NI, Hoek JB & Kholodenko BN (2004) Sig-
naling switches and bistability arising from multisite
phosphorylation in protein kinase cascades. J Cell Biol
164, 353–359.
22 Novak B, Tyson JJ, Gyorffy B & Csikasz-Nagy A
(2007) Irreversible cell-cycle transitions are due to sys-
tems-level feedback. Nat Cell Biol 9, 724–728.
23 Qiao L, Nachbar RB, Kevrekidis IG & Shvartsman SY
(2007) Bistability and oscillations in the Huang-Ferrell
model of MAPK signaling. PLoS Comput Biol 3, 1819–
1826.
24 Rogers JA, Read RD, Li J, Peters KL & Smithgall TE
(1996) Autophosphorylation of the Fes tyrosine kinase.
Evidence for an intermolecular mechanism involving
two kinase domain tyrosine residues. J Biol Chem 271,
17519–17525.
25 Brasher BB & Van Etten RA (2000) c-Abl has high
intrinsic tyrosine kinase activity that is stimulated by
mutation of the Src homology 3 domain and by auto-
phosphorylation at two distinct regulatory tyrosines.
J Biol Chem 275, 35631–35637.
26 Donella-Deana A, Cesaro L, Sarno S, Brunati AM,
Ruzzene M & Pinna LA (2001) Autocatalytic tyrosine-
phosphorylation of protein kinase CK2 alpha and
alpha’ subunits: implication of Tyr182. Biochem J 357,
563–567.
27 Caron-Lormier G & Berry H (2005) Amplification and
oscillations in the FAK/Src kinase system during inte-
grin signaling. J Theor Biol 232, 235–248.
28 Barker SC, Kassel DB, Weigl D, Huang X, Luther MA
& Knight WB (1995) Characterization of pp60c-src
tyrosine kinase activities using a continuous assay: auto-
activation of the enzyme is an intermolecular autophos-
phorylation process. Biochemistry 34, 14843–14851.
29 Young MA, Gonfloni S, Superti-Furga G, Roux B &
Kuriyan J (2001) Dynamic coupling between the SH2
and SH3 domains of c-Src and Hck underlies their inac-
tivation by C-terminal tyrosine phosphorylation. Cell
105, 115–126.
30 Harrison SC (2003) Variation on an Src-like theme. Cell
112, 737–740.
31 Sun G, Ramdas L, Wang W, Vinci J, McMurray J &
Budde RJ (2002) Effect of autophosphorylation on the
catalytic and regulatory properties of protein tyrosine
kinase Src. Arch Biochem Biophys 397, 11–17.
Switches, pulses and oscillations in Src signaling N. P. Kaimachnikov and B. N. Kholodenko
4116 FEBS Journal 276 (2009) 4102–4118 ª 2009 The Authors Journal compilation ª 2009 FEBS
32 Smith JA, Francis SH & Corbin JD (1993) Autophos-
phorylation: a salient feature of protein kinases. Mol
Cell Biochem 127–128, 51–70.
33 Hardwick JS & Sefton BM (1997) The activated form
of the Lck tyrosine protein kinase in cells exposed to
hydrogen peroxide is phosphorylated at both Tyr-394
and Tyr-505. J Biol Chem 272, 25429–25432.
34 Kholodenko BN (2006) Cell-signalling dynamics in time
and space. Nat Rev Mol Cell Biol 7, 165–176.
35 Kholodenko BN, Hoek JB & Westerhoff HV (2000)
Why cytoplasmic signalling proteins should be
recruited to cell membranes. Trends Cell Biol 10,
173–178.
36 Yudushkin IA, Schleifenbaum A, Kinkhabwala A, Neel
BG, Schultz C & Bastiaens PI (2007) Live-cell imaging
of enzyme-substrate interaction reveals spatial regula-
tion of PTP1B. Science 315, 115–119.
37 Bromann PA, Korkaya H & Courtneidge SA (2004)
The interplay between Src family kinases and receptor
tyrosine kinases. Oncogene 23, 7957–7968.
38 Yadav SS & Miller WT (2007) Cooperative activation
of Src family kinases by SH3 and SH2 ligands. Cancer
Lett 257, 116–123.
39 Bougeret C, Delaunay T, Romero F, Jullien P, Sabe H,
Hanafusa H, Benarous R & Fischer S (1996) Detection
of a physical and functional interaction between Csk
and Lck which involves the SH2 domain of Csk and is
mediated by autophosphorylation of Lck on tyrosine
394. J Biol Chem 271, 7465–7472.
40 Amrein KE, Molnos J, zur Hausen JD, Flint N, Takacs
B & Burn P (1998) Csk-mediated phosphorylation of
substrates is regulated by substrate tyrosine phosphory-
lation. Farmaco 53, 266–272.
41 Laird AD & Shalloway D (1997) Oncoprotein signalling
and mitosis. Cell Signal 9, 249–255.
42 Kholodenko BN (2007) Untangling the signalling wires.
Nat Cell Biol 9 , 247–249.
43 Kholodenko BN (2000) Negative feedback and ultrasen-
sitivity can bring about oscillations in the mitogen-acti-
vated protein kinase cascades. Eur J Biochem 267,
1583–1588.
44 Rooney TA, Sass EJ & Thomas AP (1989) Character-
ization of cytosolic calcium oscillations induced by
phenylephrine and vasopressin in single fura-2-loaded
hepatocytes. J Biol Chem 264, 17131–17141.
45 Borghans JA, de Boer RJ & Segel LA (1996) Extending
the quasi-steady state approximation by changing vari-
ables. Bull Math Biol 58, 43–63.
46 Tzafriri AR & Edelman ER (2004) The total quasi-
steady-state approximation is valid for reversible
enzyme kinetics. J Theor Biol 226, 303–313.
47 Ouyang M, Sun J, Chien S & Wang Y (2008) Determi-
nation of hierarchical relationship of Src and Rac at
subcellular locations with FRET biosensors. Proc Natl
Acad Sci USA 105 , 14353–14358.
48 Thomas R, Gathoye AM & Lambert L (1976) A com-
plex control circuit. Regulation of immunity in temper-
ate bacteriophages. Eur J Biochem 71, 211–227.
49 Smolen P, Baxter DA & Byrne JH (2008) Bistable
MAP kinase activity: a plausible mechanism contribut-
ing to maintenance of late long-term potentiation. Am J
Physiol Cell Physiol 294
, C503–C515.
50 Wang Y, Botvinick EL, Zhao Y, Berns MW, Usami S,
Tsien RY & Chien S (2005) Visualizing the mechanical
activation of Src. Nature 434, 1040–1045.
51 Kholodenko BN (2003) Four-dimensional organization
of protein kinase signaling cascades: the roles of diffu-
sion, endocytosis and molecular motors. J Exp Biol
206, 2073–2082.
52 Markevich NI, Tsyganov MA, Hoek JB & Kholodenko
BN (2006) Long-range signaling by phosphoprotein
waves arising from bistability in protein kinase
cascades. Mol Syst Biol 2, 61.
53 de Diesbach P, Medts T, Carpentier S, D’Auria L,
Van Der Smissen P, Platek A, Mettlen M, Caplanusi A,
van den Hove MF, Tyteca D et al. (2008)
Differential subcellular membrane recruitment of Src
may specify its downstream signalling. Exp Cell Res
314, 1465–1479.
54 Tian T, Harding A, Inder K, Plowman S, Parton RG &
Hancock JF (2007) Plasma membrane nanoswitches
generate high-fidelity Ras signal transduction. Nat Cell
Biol 9, 905–914.
55 Sandilands E, Brunton VG & Frame MC (2007) The
membrane targeting and spatial activation of Src, Yes
and Fyn is influenced by palmitoylation and distinct
RhoB/RhoD endosome requirements. J Cell Sci 120 ,
2555–2564.
56 Gasman S, Kalaidzidis Y & Zerial M (2003) RhoD
regulates endosome dynamics through Diaphanous-
related Formin and Src tyrosine kinase. Nat Cell Biol 5,
195–204.
57 Choudhury GG, Mahimainathan L, Das F, Venkatesan
B & Ghosh-Choudhury N (2006) c-Src couples PI 3
kinase/Akt and MAPK signaling to PDGF-induced
DNA synthesis in mesangial cells. Cell Signal 18, 1854–
1864.
58 Goryanin I, Hodgman TC & Selkov E (1999) Mathe-
matical simulation and analysis of cellular metabolism
and regulation. Bioinformatics 15, 749–758.
59 Khibnik AI, Kuznetsov YA, Levitin VV & Nikolaev
EV (1993) Continuation techniques and interactive soft-
ware for bifurcation analysis of ODEs and iterated
maps. Physica D 62, 360–371.
Supporting information
The following supplementary material is available.
Fig. S1. Graphical and analytical solutions of the QSS
equations for the kinetic model.
N. P. Kaimachnikov and B. N. Kholodenko Switches, pulses and oscillations in Src signaling
FEBS Journal 276 (2009) 4102–4118 ª 2009 The Authors Journal compilation ª 2009 FEBS 4117
Fig. S2. Proximity of the Src initial state to the excit-
ability threshold decreases the lag period.
Fig. S3. Complete numerical investigation of the
dependence of the Z-shaped QSS curve on each kinetic
parameter involved.
Fig. S4. Effects of saturabilities of reaction rates on
the QSS dependencies.
Fig. S5. Effects of large concentrations of Src dimers
on the QSS dependence.
Table S1. Range of kinetic parameters.
This supplementary material can be found in the
online version of this article.
Please note: As a service to our authors and
readers, this journal provides supporting information
supplied by the authors. Such materials are peer-
reviewed and may be re-organized for online deliv-
ery, but are not copy-edited or typeset. Technical
support issues arising from supporting information
(other than missing files) should be addressed to the
authors.
Switches, pulses and oscillations in Src signaling N. P. Kaimachnikov and B. N. Kholodenko
4118 FEBS Journal 276 (2009) 4102–4118 ª 2009 The Authors Journal compilation ª 2009 FEBS