Tài liệu Báo cáo khoa học: Structural effects of a dimer interface mutation on catalytic activity of triosephosphate isomerase The role of conserved residues and complementary mutations pptx
Bạn đang xem bản rút gọn của tài liệu. Xem và tải ngay bản đầy đủ của tài liệu tại đây (766.09 KB, 15 trang )
Structural effects of a dimer interface mutation on
catalytic activity of triosephosphate isomerase
The role of conserved residues and complementary mutations
Mousumi Banerjee1, Hemalatha Balaram2 and Padmanabhan Balaram1
1 Molecular Biophysics Unit, Indian Institute of Science, Bangalore, India
2 Molecular Biology and Genetics Unit, Jawaharlal Nehru Centre for Advanced Scientific Research, Jakkur, Bangalore, India
Keywords
aromatic cluster; dimer stability;
Plasmodium falciparum; subunit interface;
triosephosphate isomerase
Correspondence
P. Balaram, Molecular Biophysics Unit,
Indian Institute of Science, Bangalore
560012, India
Fax: +91 80 23600535
Tel: +91 80 22932337
E-mail:
(Received 14 March 2009, revised 4 May
2009, accepted 1 June 2009)
doi:10.1111/j.1742-4658.2009.07126.x
The active site of triosephosphate isomerase (TIM, EC: 5.3.1.1), a
dimeric enzyme, lies very close to the subunit interface. Attempts to
engineer monomeric enzymes have yielded well-folded proteins with dramatically reduced activity. The role of dimer interface residues in the
stability and activity of the Plasmodium falciparum enzyme, PfTIM, has
been probed by analysis of mutational effects at residue 74. The PfTIM
triple mutant W11F ⁄ W168F ⁄ Y74W (Y74W*) has been shown to dissociate at low protein concentrations, and exhibits considerably reduced stability in the presence of denaturants, urea and guanidinium chloride.
The Y74W* mutant exhibits concentration-dependent activity, with an
approximately 22-fold enhancement of kcat over a concentration range of
2.5–40 lm, suggesting that dimerization is obligatory for enzyme activity.
The Y74W* mutant shows an approximately 20-fold reduction in activity compared to the control enzyme (PfTIM WT*, W11F ⁄ W168F).
Careful inspection of the available crystal structures of the enzyme,
together with 412 unique protein sequences, revealed the importance of
conserved residues in the vicinity of the active site that serve to position
the functional K12 residue. The network of key interactions spans the
interacting subunits. The Y74W* mutation can perturb orientations of
the active site residues, due to steric clashes with proximal aromatic residues in PfTIM. The available crystal structures of the enzyme from
Giardia lamblia, which contains a Trp residue at the structurally equivalent position, establishes the need for complementary mutations and
maintenance of weak interactions in order to accommodate the bulky
side chain and preserve active site integrity.
Structured digital abstract
l
MINT-7137586: TIM (uniprotkb:Q07412) and TIM (uniprotkb:Q07412) bind (MI:0407) by
molecular sieving (MI:0071)
l
MINT-7137703, MINT-7137792: TIM (uniprotkb:Q07412) and TIM (uniprotkb:Q07412)
bind (MI:0407) by circular dichroism (MI:0016)
l
MINT-7137739: TIM (uniprotkb:Q07412) and TIM (uniprotkb:Q07412) bind (MI:0407) by
classical fluorescence spectroscopy (MI:0017)
Abbreviations
GlTIM, Giardia lamblia triosephosphate isomerase; PfTIM, Plasmodium falciparum triosephosphate isomerase; TIM, triosephosphate
isomerase; WT*, PfTIM W11F ⁄ W168F double mutant; Y74W*, PfTIM W11F ⁄ W168F ⁄ Y74W triple mutant.
FEBS Journal 276 (2009) 4169–4183 ª 2009 The Authors Journal compilation ª 2009 FEBS
4169
Effect of mutation on the dimer interface of PfTIM
M. Banerjee et al.
Introduction
The glycolytic enzyme triosephosphate isomerase occupies a central position in the development of structural
and mechanistic enzymology [1–3]. As the first wellcharacterized protein exhibiting a (b ⁄ a)8 barrel fold [2],
TIM has been a subject of extensive study over the
past five decades [4–9]. The enzyme is a dimer in all
organisms, with the exception of thermophilic archaebacteria, in which it exists as a tetramer [10–12]. The
TIM dimer interface consists mainly of four loops [13].
TIM is an extremely tight dimer, with an estimated Kd
value for the wild-type trypanosomal TIM of approximately 10)11 m [14]. The overall surface area buried at
the dimeric interface of TIMs from diverse sources is
˚
approximately 1600–1800 A2 per subunit. In an early
study using yeast TIM, Casal et al. examined N78T,
N78I and N78D mutants. The mutants had an appreciably lower kcat value and were significantly less stable
at elevated temperatures and in the presence of denaturants and proteolytic agents [15]. Engineered monomeric TIM constructed from a mutant from which
loop 3 had been deleted showed negligible activity,
suggesting that dimerization may be important for
both stability and function [13,14]. To establish the
relationship between dimerization and catalytic activity, several site-directed mutants of various TIMs have
been generated. An H47N variant of Trypanosoma brucei TIM was found to form monomers at low
protein concentration (£ 3 mgỈmL)1), with considerable impairment of activity [16]. Similarly, the mutant
T75G ⁄ G76R was also found to dissociate at low protein concentration, resulting in a 1000-fold reduction
of activity [17]. The human TIM mutants R98Q and
M14Q ⁄ R98Q showed enzyme inactivation as well as
strongly affected subunit association [18].
Plasmodium falciparum triosephosphate isomerase
(PfTIM) has been the subject of study in our laboratory
for a number of years [19]. Interest in this enzyme stems
from the fact that the plasmodial enzyme exhibits unusual properties, especially with respect to the conformation of the active site loop [20] and differences in the
nature of the dimer interface compared to the human
enzyme. The fact that a cysteine residue is found at position 13 in the pathogens, compared to methionine in
human enzyme, has stimulated studies involving selective inhibition using sulfhydryl-modifying reagents
[21] in the TIMs from Trypanosoma brucei, Trypanosoma cruzi and Leishmania mexicana [22–24].
Previously, Tyr74 of PfTIM was replaced by Cys in
order to introduce a symmetry-related disulfide bond
with the Cys residue at position 13 of the other subunit [25,26], yielding a covalently bridged dimer. The
4170
oxidized and reduced forms of the Y74C mutant had
very different thermal stabilities. While the stability of
the Y74Cox mutant was comparable to that of wildtype enzyme, the Y74Cred mutant was very labile [26].
Thus it was concluded that the reduction in residue
volume at position 74 at the dimer interface created a
cavity, with consequent destabilization. Formation of
the cavity and its consequences were further tested by
introducing the smallest residue, glycine, at position 74. The Y74G mutant was considerably less stable
than the wild-type enzyme at elevated temperature and
in the presence of denaturants [27].
Extending these studies, we examine here the effect
of increasing the bulk of the residue at position 74.
Surprisingly, the Y74W mutant exhibited loss of both
activity and stability. There was also evidence of dimer
dissociation at low protein concentration. These results
prompted us to re-examine the role of the dimeric structure in facilitating enzyme activity. Placement of an
intrinsic fluorophore (tryptophan) at the dimer interface also provides the opportunity to monitor subunit
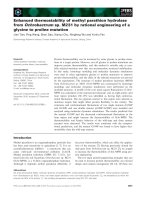
dissociation by fluorescence methods. Figure 1 shows
the environment of the Y74 residue of PfTIM. Y74
appears in a cluster of aromatic residues that might be
anticipated to contribute to dimer stability through
favorable aromatic–aromatic interactions [27]. In order
to examine the effect of introduction of additional
atoms at position 74, we engineered a Y74W mutant of
PfTIM. The wild-type enzyme contains two tryptophan
residues, W11 and W168. In order to simplify the interpretation of fluorescence spectra, we constructed a triple mutant of PfTIM W11F ⁄ W168F ⁄ Y74W (Y74W*).
Previous studies from this laboratory on the single
mutants W11F and W168F have shown that the substitutions at these sites do not significantly impair enzyme
activity [28]. Interestingly, the bulky Trp residue is
found at this position in the sequence of TIM from
Giardia lamblia (GlTIM) whose molecular structure has
also been determined [29]. A direct comparison of Y74
(in PfTIM) and W75 (the Y74-equivalent residue in
GlTIM) revealed a set of complementary mutations in
the near vicinity, which in turn help to accommodate
the bulk of the tryptophan residue in GlTIM without
changing the overall stability or function.
Results
This study primarily focuses on the triple mutant
W11F ⁄ W168F ⁄ Y74W (Y74W*), generated using a
‘tryptophan-less’ template W11F ⁄ W168F (WT*). This
template was chosen in order to use the intrinsic
FEBS Journal 276 (2009) 4169–4183 ª 2009 The Authors Journal compilation ª 2009 FEBS
M. Banerjee et al.
Effect of mutation on the dimer interface of PfTIM
fluorescence of the engineered Trp74 residue to monitor
dimer dissociation. All the mutant proteins were
checked for homogeneity by SDS–PAGE (Fig. S1) and
characterized by precise mass determination using
LC-ESI mass spectrometry (ESI MS, Bruker Daltonics,
Bremen, Germany) (Fig. S2).
PHE-74
A
TYR-101
6.2 Å
4.4 Å
5.8 Å
4.8 Å
Kinetic parameters
TYR-67
6.0 Å
PHE-102
B
TYR-101
TYR-74
5.4 Å
4.9 Å
4.2 Å
PHE-69
6.3 Å
6.2 Å
PHE-102
C
ILE-102
TRP-75
5.4 Å
5.7 Å
MET-103
TYR-68
Fig. 1. The environment of residue 74 (and its structural equivalents) in PfTIM, yeast and GlTIM: side-chain cluster involving residues 69, 74, 101 and 102. (A) PfTIM (Protein Data Bank code
1O5X; F69-Y74-Y101-F102), (B) yeast (Protein Data Bank
code 1NEY; Y67-F74-Y101-F102), and (C) GlTIM (Protein Data Bank
code 2DP3; Y68-W75-I102-M103). The centroid to centroid distances are marked for all aromatic–aromatic pairs. The residues in
green are from subunit A and those in cyan are from subunit B.
The images were generated using PYMOL [57].
The enzymatic activity of the purified protein was measured using a coupled enzyme assay. The kinetic parameters for the mutant proteins are listed in Table 2,
together with the relevant parameters for the WT protein
and related mutants described previously. The Michaelis–
Menten and Lineweaver–Burke plots for the enzymes
are shown in Fig. S3. The W11F ⁄ W168F mutant (WT*)
shows a twofold reduction in kcat values compared to the
PfTIM wild-type. The W168F and W11F single mutants
examined previously have activity comparable to that of
the double mutant. However, the triple mutant Y74W*
shows an approximately 20-fold reduction in kcat
compared to the WT* enzyme. There are two possible
reasons for the low activity of the Y74W* mutant:
(a) introduction of the bulkier residue at the interface in
place of a tyrosine may destabilize the dimer, resulting in
a shift in the equilibrium towards an inactive ⁄ less active
monomeric form, or (b) insertion of the bulkier residue
at the tightly packed interface may result in structural
rearrangements at the proximal active site.
In order to address this issue, the dependence of activity on protein concentration was determined for the
triple mutant Y74W*, the double mutant WT* and the
wild-type (PfTIM WT) enzymes. Enzyme activity was
measured over a wide range of protein concentrations
from 2.5 to 40 lm. It should be noted that the optimum
concentration for the enzyme assay with the WT enzyme
is 370 pm (10 ngỈmL)1); however, under these condition,
the progress of the reaction for the triple mutant
Y74W* is extremely slow, presumably because of the
extremely low population of the catalytically competent
dimeric species. Consequently, enzyme assays for the triple mutant were performed at much higher protein concentration (67.5 lgỈmL)1–1.08 mgỈmL)1; 2.5–40 lm).
Under these conditions, the progress of the reactions of
WT enzyme and other mutants is very fast. The results
are summarized in Fig. 2. It is evident that the Y74W*
mutant shows an enhancement of activity of 21.9-fold
over the concentration range 2.5–40 lm, strongly suggesting that the loss of activity at low concentration may
be attributed to subunit dissociation. In contrast, both
the WT and WT* enzymes show no concentration
dependence of specific activity, suggesting that these
proteins retain their dimeric nature even at the lowest
FEBS Journal 276 (2009) 4169–4183 ª 2009 The Authors Journal compilation ª 2009 FEBS
4171
Effect of mutation on the dimer interface of PfTIM
M. Banerjee et al.
10 000
TWT
Log of specific activity (µmol·min–1·mg–1)
WT*
1000
Y74W*
100
10
1
0
10
20
30
Protein concentration (µM)
40
Fluorescence spectroscopy
Fig. 2. Concentration-dependent enzyme activity of PfTIM wildtype, the double mutant W11F ⁄ W168F (WT*) and the triple mutant
W11F ⁄ W168F ⁄ Y74W (Y74W*). Assays of these three enzymes
were carried out over a concentration range of 2.5–40 lM. The
enzymes were incubated at the various concentrations in 100 mM
triethanolamine ⁄ HCl (pH 7.6) for 1 h. All enzyme activity measurements were performed using the same buffer.
concentration examined. It is important to note that
even at the highest concentration studied (40 lm), the
Y74W* mutant does not reach the same level of activity
as WT*.
Analytical gel filtration
Analytical gel filtration provides a direct means of
assessing the oligomeric status of proteins. Figure 3
shows the gel filtration profiles obtained on an Superdex-200 column for the triple mutant Y74W*. At a protein concentration of 40 lm, a single band is observed,
with an elution volume of 13.9 mL, corresponding to
a dimeric enzyme (54 kDa) with a subunit mass of
27 kDa. PfTIM WT and WT* elute at exactly this position under similar conditions. However, at a much
lower concentration of 5 lm, the gel filtration profile for
the Y74W* mutant clearly shows two distinct species
eluting at 13.9 and 15.3 mL. The later elution volume
corresponds to the expected position for a monomeric
protein with a mass of 27–28 kDa. In contrast, PfTIM
wild-type and WT* elute as a single peak centered at
13.9 mL, the position corresponding to the dimer, even
at the lowest concentration studied. Inspection of the
gel filtration profile in Fig. 3 shows that the peak corresponding to the monomeric species is considerably
broader, presumably due to a distribution of partially
4172
unfolded conformations. At a protein concentration of
5 lm, the monomeric species appears to predominate in
the case of Y74W*. The gel filtration results indicate
that the Y74W* mutant is dimeric at a concentration of
40 lm. However, at the highest concentration studied,
there was an approximately 20-fold difference in the
measured kcat value for Y74W* compared to WT*, with
the former being significantly less active. The activity
measurements, together with the gel filtration results,
suggest that, monomeric Y74W* possesses very low levels of activity, but complete activity is not regained even
upon dimerization. Thus, position 74 is not only critical
for the stability of the dimer, it may also be involved in
maintaining the integrity of the active site. These results
clearly suggest that the dimer interface in the Y74W*
mutant is destabilized to a considerable extent.
As seen from Fig. 1, the Y74 residue of one subunit
makes close contact with Y101 and F102 of the other
subunit. Thus, subunit dissociation in the case of the
triple mutant Y74W* is expected to result in solvent
exposure of the buried Trp74 residue. Figure 4 summarizes the dependence of the emission maxima (kmax) on
protein concentration for Y74W* and the PfTIM WT
protein. The wild-type protein shows no change in the
emission wavelength of 332 nm over the protein concentration range 0.625–40 lm, but the Y74W* mutant
shows a sharp dependence of emission wavelength on
protein concentration. At the lowest concentration
examined, 0.625 lm, the emission maximum is
observed at 343 nm, with a shift to 336 nm at a protein concentration of 40 lm. The observed red shift on
dilution is consistent with subunit dissociation, resulting in transfer of the Trp74 residue from a buried,
hydrophobic environment to a polar aqueous environment. Further evidence for dimer dissociation in the
Y74W* mutant can be obtained by examining the concentration dependence of the collisional quenching
constant obtained from Stern–Volmer plots (Fig. 5)
for the quencher acrylamide [30]. The effect of addition of acrylamide over the concentration range
100 mm–1 m was studied for protein concentrations
ranging from 5 to 40 lm. In the case of the wild-type
protein (PfTIM WT), there is a very little concentration dependence of the quenching curves. In contrast,
the quenching observed for the Y74W* mutant shows
a pronounced concentration dependence, with a much
greater degree of quenching at lower protein concentration. This is fully consistent with subunit dissociation resulting in a much greater accessibility to the
quencher at concentrations < 10 lm. The quenching
FEBS Journal 276 (2009) 4169–4183 ª 2009 The Authors Journal compilation ª 2009 FEBS
M. Banerjee et al.
Effect of mutation on the dimer interface of PfTIM
5.50
Log molecular weight (Da)
Y74W* (40 µM)
140
120
100
Y74W* (5 µM)
Absorbance (mAU)
80
Fig. 3. Analytical gel filtration profiles for
the triple mutant W11F ⁄ W168F ⁄ Y74W at
two concentrations. The column used for
gel filtration was a Superdex-200 (length
30 cm, internal diameter 10 mm. Buffer
containing 20 mM Tris ⁄ HCl (pH 8.0) with
100 mM sodium chloride was used for all
runs at a flow rate of 0.5 mLỈmin)1. The
inset shows the relative retention volumes
of standard molecular weight markers.
β-amylase
Alcohol dehydrogenase
5.25
5.00
BSA
4.75
T I M d im er
TIM monomer
4.50
Carbonic anhydrase
4.25
Cytochrome C
4.00
3.75
10
60
11
12
14
15
16
13
Elution volume (mL)
17
18
40
20
0
10.0
12.0
curves at a protein concentration of 5 lm exhibit a significant deviation from linearity, suggestive of both
static and dynamic quenching.
Stability to denaturants and temperature
The (a ⁄ b)8 barrel fold observed in TIMs is a robust
structure that is incompletely denatured in urea solution. Previous studies of PfTIM wild-type established
that considerable secondary structure is maintained
even in 8 m urea solution [25]. Guanidinium chloride is
a more effective denaturant, yielding a Cm (mid-point
of the unfolding curve) of approximately 2.4 m for
PfTIM WT. The protein also undergoes irreversible
thermal melting and precipitates at 58 °C. Table 3 provides a comparison of the denaturation parameters of
PfTIM wild-type and the Y74W* triple mutant. For
comparison, the measured parameters for the double
mutant W11F ⁄ W168F and previously studied mutants
are also summarized. It is immediately evident that the
Y74W* mutant is considerably less stable in the presence of denaturants such as guanidinium chloride, and
is also thermally more labile.
Discussion
Effects of the Y74W mutation
Residue 74, which lies at the dimer interface of PfTIM,
appears to be important in promoting subunit dissociation [27] and also in maintaining the geometry of the
active site. The availability of crystal structures of
TIMs from 21 sources and the large database of TIM
sequences from various sources facilitate an analysis of
mutational effects. Most importantly, determination of
the crystal structure of yeast TIM with the substrate
14.0
16.0
18.0
mL
Elution volume (mL)
dihydroxyacetone phosphate [31] provides an excellent
starting point for examining the consequence of mutations that may affect substrate binding and catalysis.
Using a database of 380 unique TIM sequences from
non-archaeal sources, we have examined the nature of
substitutions at the position equivalent to residue 74 in
PfTIM. Archaeal TIMs were excluded as they have a
shorter polypeptide length and are anticipated to form
tetrameric structures, as already established for the
enzymes from Pyrococcus woesei [10] and Methanocaldococcus jannaschii [12].
Of the 380 non-archaeal TIM sequences, 339 contain
an aromatic residue at position 74 (126 Tyr, 206 Phe,
7 Trp and 22 His). At position 101, Tyr ⁄ Phe are
observed in 180 sequences, and hydrophobic aliphatic
residues (Ile ⁄ Leu ⁄ Val) are present in as many as 170
sequences. Similarly, at position 102, 223 sequences
have Tyr ⁄ Phe and 96 have a His residue. Thus the aromatic cluster observed in PfTIM is not a conserved
feature in all the available sequences. Of the four aromatic residues that cluster at the dimer interface of
TIM (Fig. 1), residue 69 is the most variable, being
aromatic in only 13 of 380 sequences (including
histidine at seven positions). The other three positions
(74, 101 and 102) are more conserved, with aromatic ⁄
hydrophobic residues in 364 of 380 sequences.
Of the 32 TIM sequences available from archaea
that form tetramers (not included in the 380
sequences), there is a deletion corresponding to positions 101 and 102, resulting in a restructuring of the
dimer interface that appears to be necessary for the
generation of the tetrameric TIMs. There is a resulting
segregation between the archaeal sequences and bacterial and eukaryotic TIM sequences.
Interestingly, Trp is found at position 74 in seven of
the non-archaeal sequences, and the crystal structure of
FEBS Journal 276 (2009) 4169–4183 ª 2009 The Authors Journal compilation ª 2009 FEBS
4173
Effect of mutation on the dimer interface of PfTIM
M. Banerjee et al.
345
TWT
3.5
340
3.0
Y74W*
335
F0 /F
Emission maximum ( λmax nm)
4.0
TWT
W168F
330
2.5
40 µM
20 µM
10 µM
5 µM
2.0
1.5
W11F
325
0
10
20
30
Enzyme concentration (µM)
1.0
40
0
100 200 300 400 500 600 700 800 900 1000 1100
Acrylamide concentration (mM)
W11F/W168F/Y74W
7
40 µM
20 µM
10 µM
5 µM
5
8
3
6
5
1
315
325
335
345
355
365
375
–1
F0 /F
AU
40 µM
20 µM
10 µM
5 µM
7
4
3
2
–3
1
–5
Wavelength (nm)
0
Fig. 4. Concentration-dependent shift in emission maxima for
PfTIM wild-type and single tryptophan mutants: the enzyme concentration range used was 40–1.25 lM (20 mM Tris ⁄ HCl pH 8.0). At
higher concentration the mutant remains as a dimer. However,
with dilution it shows monomer dimer equilibrium. With the
increase of monomeric population the buried W74 gets exposed
and its emission shifts towards higher wavelength. Top panel: comparison of the concentration dependence of fluorescence maxima
for the enzymes TIM wild type (TWT), W11F, W168F and Y74W*.
Bottom panel: first derivative of the fluorescence profile for Y74W*
at various concentrations.
one member of this class is available, from Giardia lamblia [29]. A comparison of the immediate environment of residue 74 in the structures of TIMs from
yeast, P. falciparum (Pf TIM) and G. lamblia (GlTIM)
reveals that the yeast and Pf TIM structures are very
similar, although some subtle differences in aromatic
ring orientation are evident. In contrast, Gl TIM, which
contains Trp at position 75 (which is structurally equivalent to position 74 of Pf TIM), lacks other aromatic
4174
0
100 200 300 400 500 600 700 800 900 1000
Acrylamide concentration (mM)
Fig. 5. Stern–Volmer plots showing concentration-dependent acrylamide quenching of tryptophan fluorescence for (A) TWT (emission
at 332 nm) and (B) Y74W* (emission at 337 nm) at various protein
concentrations. Quenching studies were performed in 20 mM
Tris ⁄ HCl (pH 8.0).
rings in the vicinity. In comparing the three structures, it
should be noted that the residue numbering is the same
for the yeast enzyme and Pf TIM, but is increased by 1
in GlTIM. Two features of the Y74W* mutant of
PfTIM need to be rationalized: (a) the reduced stability
of the dimeric structure, and (b) the significantly lower
value of kcat, suggesting an impairment of the catalytic
efficiency (kcat for Y74W* = 0.06 · 105 min)1; kcat for
PfTIM WT* = 1.28 · 105 min)1) (Table 2). With
regard to stability, inspection of the data in Table 3
reveals that the triple mutant Y74W* has the lowest
Tm value (37 °C) as determined by monitoring CD
FEBS Journal 276 (2009) 4169–4183 ª 2009 The Authors Journal compilation ª 2009 FEBS
M. Banerjee et al.
ellipticity at 222 nm using a protein concentration of
20 lm. Under these conditions, the WT enzyme and all
the other mutants listed in Table 3 show substantially
higher values. The triple mutant also shows pronounced
concentration dependence to gel filtration, consistent
with subunit dissociation. With regard to impairment of
the catalytic efficiency, it is notable that the Km value of
the triple mutant has not altered significantly even
though the kcat value is reduced 40-fold compared to
WT and 20-fold compared to WT* (Table 2). k2 (kcat),
which is the rate-limiting step in TIM catalysis, is much
A
B
Fig. 6. The neighborhood of residues (A) Y74 in PfTIM (Protein
Data Bank code 1O5X) and (B) W75 in GlTIM (Protein Data Bank
code 2DP3), and their interactions across the dimer interface.
Relevant active site residues are also shown. The residue stretch
95–102 is also represented as a ribbon diagram. The residues in
green are from subunit A and residues in cyan are from subunit B
of dimeric triosephosphate isomerase.
Effect of mutation on the dimer interface of PfTIM
slower than k-1 (dissociation of the enzyme–substrate
complex) [32]. Thus the k1 ⁄ k-1 ratio is the actual determinant of Km (binding affinity), and is not affected by
the mutation.
Figure 6 shows the environment of residue 74, including the proximal residues of the TIM active site. The
isomerization of dihydroxyacetone phosphate to glyceraldehyde 3-phosphate involves a proton abstraction
from the substrate by the catalytic carboxylate of E165,
followed by a proton transfer process to the enediol(ate)
intermediate, completing the reaction cycle. While E165
and H95 have been postulated to be key residues
involved in the catalytic process, K12 has also been
implicated in substrate binding [33–36]. This key mechanistic insight into the TIM reaction derives from the
seminal work of J.R Knowles and I. Rose [37–42]. Interestingly, mutation of the K12 residue results in a completely inactive enzyme, as evident from the studies of
the K12M mutant of yeast TIM (kcat = 1.08 min)1,
wild-type kcat = 5.22 · 105 min)1) [35]. A curious feature of the currently accepted mechanism for the TIM
reaction is the involvement of the H95 residue as the
imidazolate anion, despite the extremely unfavorable
pKa (approximately 14) for loss of a proton from neutral imidazole. Indeed Lodi and Knowles noted in 1992:
‘Why the enzyme has evolved to use a neutral histidine
as a general acid is not clear’ [36]. Support for the postulated role of the neutral imidazole as an acid is derived
from ab initio and molecular dynamics calculations [43].
However, Lodi and Knowles introduce a note of caution: ‘Whether or not the details of this analysis will
turn out to be correct, it is interesting that theory and
experiment have agreed upon a result that runs counter
to the initial prejudices of mechanistic chemistry‘
[34,44]. The residues K12, H95 and E165 are completely
conserved in all available TIM sequences. E97 (see
Fig. 6) is the fourth residue in the immediate neighborhood that is completely conserved and whose carboxylate group is within interaction distance for proton
transfer from the e-amino group of K12 and the imidazole of H95. A proton transfer process that involves all
four residues may be envisaged in which H95 is either
neutral or positively charged, eliminating the need to
invoke an imidazolate at residue 95 [M. Banerjee,
P. Balaram & N. V. Joshi (Centre for Ecological
Sciences CES, IISC, Bangalore), unpublished results].
While precise mechanistic details are not central to
the present discussion, it is interesting to note that
three of the four completely conserved residues that lie
close to the substrate binding site (K12, H95 and E97)
are located in the vicinity of residue 74 (Fig. 6).
Figure 7 show that Thr75, which is another completely
conserved residue, forms key hydrogen bonding bonds
FEBS Journal 276 (2009) 4169–4183 ª 2009 The Authors Journal compilation ª 2009 FEBS
4175
Effect of mutation on the dimer interface of PfTIM
M. Banerjee et al.
HOH-8
ND2 Asn-78 (A)
2.84
C'(O) Val-231 (A)
2.78
3.10
GLN-64
ASN-10
N Gly-171 (A)
N Ser-211 (A)
HOH-81
2.97
2.81
3.00
2.90
3.08
2.75
2.86
4.24
3.14
HOH-25
ASN-65
2.91
DHAP
2.88
GLY-76
LYS-12
HOH-35
2.91
THR-75
3.02
2.81
2.89
2.97
2.77
2.78
N Gly-232 (A)
ARG-98
HOH-79
N Gly-233 (A)
GLU-97
3.14
2.78
C'(O) His-95 (A)
4.02
NE2 Arg-99 (A)
through its backbone CO and NH groups to Arg98
and Glu97 of the neighboring subunit. The dimer
interface and the network of hydrogen bond interactions positioning the active site residues are closely
inter-connected. Taken together, Figs 6 and 7 suggest
that dimerization is a prerequisite for construction of a
catalytically competent active site. Subunit dissociation
may thus be expected to result in a loss of enzymatic
activity, as observed at low concentrations for the
Y74W* mutant of PfTIM. There have been several
attempts to engineer monomeric TIMs, some of which
retain the complete fold of the native enzyme [13,14].
However, the catalytic efficiencies of these engineered
monomeric enzymes are reduced (kcat for monoTIM =
312 min)1; kcat for wild-type TIM = 2.6 · 105 min)1).
Figure 7 shows that the residues N10 and Q64 form
hydrogen bonds through their side chains to the backbone NH and CO groups of the completely conserved
K12 residue. Of the 412 unique sequences (including
archaeal sequences), the residues at position 10 (Asn)
and position 64 (Gln) have been replaced by Ser in five
sequences and Glu in 27 sequences, respectively. These
replacements conserve the hydrogen bonding interactions shown in Fig. 7.
A notable feature of all TIM crystal structures
reported to date is the conservation of the unusual
backbone stereochemistry at the K12 residue. As
shown in Fig. 8, K12 adopts unusual Ramachandran
angles of / = 54.3 ± 5.5 and w = )144.1 ± 7.0 [53].
The distribution of the / and w values of all other Lys
residues in the TIM structure is shown for comparison.
The possible role of energetically unfavorable Ramachandran disallowed conformations at enzyme active
sites has been considered previously [45,46].
4176
N Phe-102 (A)
Fig. 7. Environment of Lys12 in the yeast
TIM–dihydroxyacetone phosphate complex
(Protein Data Bank code 1NEY), together
with the dimer interface residues showing
critical hydrogen bonds at the dimer interface. The residues in green are from
subunit B and those in cyan are from
subunit A. The active site residues of
P. falciparum, yeast and G. lamblia TIMs
superpose with an RMSD of approximately
˚
0.8–1.2 A.
From Fig. 6A,B, it is evident that R98 is involved in
key interactions with T75 across the dimer interface,
while T75 interacts with N10 and E97 of the second
subunit. The backbone NH group of R98 forms a
hydrogen bond with the backbone CO of F102. Furthermore, the orientation of the side chain of the two
residues brings the guanidinium plane and the aromatic ring of F102 into close proximity, with an
almost perfectly parallel arrangement of the interacting
groups (Fig. 9A). Interactions between guanidinium
and aromatic residues have been suggested to be energetically stabilizing in both theoretical and experimental studies [47,48]. From Fig. 6, it is evident that the
Y74W mutation in PfTIM must necessarily result in
displacement of the F102 side chain, with consequent
effects on interactions involving R98.
Modeling studies indicated that insertion of a Trp residue at position 74 in the PfTIM structure results in
severe short contacts with neighboring residues in all
possible rotameric states of the side chain. Thus, accommodation of a Trp residue at this position necessarily
involves movement of proximal side chains. A cascade
of side chain movements might then be expected to
influence the precise positioning of the functional groups
involved in catalysis, resulting in a significant reduction
of kcat values in the case of the Y74W* TIM mutant,
even at concentrations at which the mutant enzyme
exists solely in a dimeric form. Thus, restoration of the
quaternary structure does not result in complete restoration of the catalytic efficiency. How does the GlTIM
accommodate the Trp residue at the equivalent position
residue 75? Figure 6B shows a view of the environment
of this residue that facilitates direct comparison with the
PfTIM structure shown in Fig. 6A. The residues that
FEBS Journal 276 (2009) 4169–4183 ª 2009 The Authors Journal compilation ª 2009 FEBS
M. Banerjee et al.
Effect of mutation on the dimer interface of PfTIM
DHAP
Fig. 8. Key backbone hydrogen bonds
between K12 and the side chains of N10
and Q64, which maintain the unusual Ramachandran angles for the K12 residue, and a
Ramachandran scatter plot for the K12 residues in 21 TIM structures from various
sources (available from the Protein Data
Bank and including both free and inhibitorbound structures). The K12 conformations
are clustered in the lower right quadrant.
The distribution of the / and w values of all
other Lys residues (total 1150) is shown for
comparison. None of these Lys residues
adopt the unusual backbone conformation
seen for K12. The amino acid residues from
the enzyme are shown in green. The substrate DHAP is shown in yellow.
K12
180º
φ ∼ + 54º
ψ ∼ – 140º
ψ
–180º
2.92
φ
180º
K12
2.98
N10
–180º
Lys residues from all TIM structures
Q64
A
Fig. 9. The key interactions of a substantially conserved Arg residue (conserved in
353 of 380 sequences) with several residues near the active site and dimer interface. (A) Arg98 in PfTIM (Protein Data Bank
code 1O5X) and (B) Arg99 (the structural
equivalent of Arg98 in PfTIM) in GlTIM
(Protein Data Bank code 2DP3). The
residues in green are from subunit A and
residues in cyan are from subunit B of
dimeric triosephosphate isomerase. Critical
interactions between A¢ and A¢¢ [the
guanidine group and aromatic residues of
PfTIM (R98 ⁄ F102)] and the B¢ guanidine and
sulfur groups of GlTIM (R99 ⁄ M103) are
marked.
B
FEBS Journal 276 (2009) 4169–4183 ª 2009 The Authors Journal compilation ª 2009 FEBS
4177
Effect of mutation on the dimer interface of PfTIM
M. Banerjee et al.
face W75 (equivalent to residue Y74 in PfTIM) across
the dimer interface are the aliphatic residues I102 and
M103. These mutations eliminate the steric crowding
that would have occurred if aromatic residues had been
positioned at these sites as in the case of TIMs from
Plasmodium and yeast. Interestingly, the thioether group
of M103 is positioned to make a potentially stabilizing
contact with the guanidinium group of R99 (equivalent
to R98 of PfTIM and yeast TIM). The shortest distance
from the sulfur atom of M103 to the NH1 nitrogen of
˚
the guanidium group of R99 is 3.23 A, suggestive of a
potentially stabilizing S-H-N interaction (Fig. 9B) [49].
The above discussion rationalizes the observed effects
of the Y74W mutation in PfTIM on the stability of the
dimeric structure and catalytic activity. Examination of
the available TIM sequences provides examples of where
this mutation is indeed found in native enzymes. The
availability of the enzyme from G. lamblia provides an
opportunity to examine the nature of the complementary mutations employed in nature. The growing body
of sequence and structural data on these well-studied
enzymes affords an opportunity to evaluate the consequences of mutations. In the case of TIM, only nine of
the 220–250 residues present in the sequences of the
enzymes from diverse sources are indeed completely
conserved. A relatively small number of positions
accommodate only two or three possible amino acids
(two substitutions are possible in five positions and three
substitutions are possible in four positions). These positions include positions 10 and 64. Interestingly, the completely conserved positions and those exhibiting a very
low diversity of substitution are all very close to the
enzyme active site. This suggests that the driving force
for evolutionary selection of protein sequences is the
catalytic competence of the enzyme active site. The precise orientation of the functional residues is maintained
by a network of interactions that severely limits the
range of mutations that can be accommodated.
which carry a null mutant of the TIM gene. For construction
of the triple mutant Y74W* (W11F ⁄ W168F ⁄ Y74W), a tryptophan-less mutant W11F ⁄ W168F was used as a template.
The W11F ⁄ W168F double mutant was generated on the
W11F template. Briefly, the mutagenic primer was used
together with the C-terminal primer PfTIM to generate a
mega primer containing the mutation. Site-directed mutagenesis was performed using the mega primer PCR method
[51]. The primers used to make this mutant are listed in
Table 1. In addition to the desired mutation, these primers
also contained restriction sites, incorporated by silent mutagenesis, in order to aid selection of recombinants. The sites
incorporated were HaeIII, NcoI and BamHI (Table 1). The
PCR mix contained 200 ng of each primer, 20 ng of the template, 200 lm of each dNTP and 5 units of Taq DNA polymerase in a 50 lL reaction mixture. The PCR cycle used
comprised denaturation at 94 °C for 4 min (hot start), then
93 °C for 25 s, annealing at 48 °C for 50 s and extension at
73 °C for 35 s. The product obtained after 30 cycles of PCR
was purified by elution from agarose gels and used as a mega
primer for the second round of PCR. The other primers used
in the PCR amplification are listed in Table 1. The second
PCR comprised 94 °C for 4 min (hot start), then 93 °C for
30 s, annealing at 52 °C for 50 s and extension at 73 °C for
1 min. After 30 cycles, a final extension of 10 min at 72 °C
was performed. The full-length amplified product (746 bp)
containing the desired mutation was purified using a gene
cleaning kit (Qiagen, Qiagen India, Genetix Biotech Asia,
New Delhi, India), digested with enzymes NcoI and BamHI,
and ligated into the vector pTrc99A, digested using the same
enzymes. Recombinants were selected after transformation
into E. coli strain DH5a on the basis of super-coiled plasmid
mobility [51]. The presence of the correct insert was confirmed by restriction digestion using enzymes specific for the
sites incorporated in the mutagenic primers. The triple
mutant was constructed using the same procedure using the
W11F ⁄ W168F mutant in the pTrc99A template. The primers
Y74W* and TIM were used for the first round of mutagenesis in this case. The presence of mutations was confirmed by
sequencing (Microsynth, Balgach, Switzerland), and the
mutants were found to be free of PCR errors.
Experimental procedures
Protein expression and purification
Site-directed mutagenesis
The wild-type PfTIM gene was first cloned in the pTrc99A
vector and expressed in AA200 Escherichia coli cells [50],
Expression of the TIM gene was performed using the
pTrc99A system. E. coli AA200 cells (containing a null
mutant of the inherent TIM gene) carrying the pTrc99A
Table 1. Oligonucleotides used for site-directed mutagenesis.
Desired mutation
Template gene
Constructed mutant
Primer sequence (5¢- to 3¢)
Restriction site
W11F
W168F
WT*
Y74W*
WT
WT
W11F
WT*
W11F
W168F
W11F ⁄ W168F
W11F ⁄ W168F ⁄ Y74W
CACCATGGCTAGAAAATATTTTGTCGCAGCAAACTTCAAATGTAA
GAACCTTTATTCGCTATTGGTACCGGTAAA
GAACCTTTATTCGCTATTGGTACCGGTAAA
TCACCGGTCCATGATCCATT
NcoI
KpnI
KpnI
HaeIII
4178
FEBS Journal 276 (2009) 4169–4183 ª 2009 The Authors Journal compilation ª 2009 FEBS
M. Banerjee et al.
Effect of mutation on the dimer interface of PfTIM
Table 2. Comparison of kinetic parameters of PfTIM interface mutants with those for wild-type PfTIM, yeast and GlTIM.
Enzymes
kcat (· 105 min)1)a
Km (mM)
kcat ⁄ Km (· 105 min)1ỈmM)1)
References
PfTIM WT
GlTIM
Yeast
W11F
W168F
W11F ⁄ W168F (WT*)
Y74G
W11F ⁄ W168F ⁄ Y74W (Y74W*)a
2.68 ± 0.84
2.9 ± 0.2
1.41 ± 0.36
1.55
1.57
1.28 ± 0.37
0.071 ± 0.016
0.06 ± 0.003
0.35
0.53
0.62
0.41
0.30
0.45
0.34
0.66
7.65
5.47
0.54
3.78
5.23
2.84
0.21
0.09
[25]
[29]
[41]
[28]
[28]
This study
[25]
This study
a
± 0.16
± 0.03
± 0.05
± 0.082
± 0.076
± 0.04
The activity was measured at a protein concentration of 40 lM.
Table 3. Protein stability to chemical denaturants and temperature.
Enzymes
Cm urea (M)a
Cm guanidinium
chloride (M)a
Tm (°C)b
Quaternary structurec
(lowest concentration studied)
References
WT
W11F
W168F
W11F ⁄ W168Fd
Y74G
W11F ⁄ W168F ⁄ Y74W (Y74W*)
>8
4.0
>8
3.4
3.5
2.9
2.4
1.8
2.0
1.2
1.8
0.9
58.0
50
55
44.8
–
37
Dimer
Dimer
Dimer
Dimer
Dimer
Dimer
[25]
[28]
[28]
This study
[25]
This study
(2.5 lM)
(2.5 lM)
(2.5 lM)
(2.5 lM)
+ monomer (20 lM)
+ monomer (5 lM)
a
Cm is the mid-point of the unfolding profile monitored by CD (h222 nm) and fluorescence (k emission for kexcitation of 295 nm) over a denaturant concentration range of 0–8 M for urea and 0–7 M for guanidinium chloride. b Tm is the mid-point of thermal melting curve generated
by monitoring CD ellipticity (h222 nm). Irreversible protein precipitation occurs on thermal denaturation. c The column used for gel filtration
was a Superdex-200 (length 30 cm, internal diameter 10 mm). Buffer containing 20 mM Tris ⁄ HCl (pH 8.0) with 100 mM sodium chloride was
used for all runs at a flow rate of 0.5 mLỈmin)1. d Protein denaturation was monitored only by change in CD ellipticity in the case of this tryptophan-less mutant.
recombinant vector were grown at 37 °C in terrific broth
containing 100 lgỈmL)1 ampicillin. Cells were induced using
300 lm isopropyl-b-d-thiogalactopyranoside until they
reached an attenuance at 600 nm of 0.6–0.8, and were then
harvested by centrifugation (15 min, 7245 g at 4 °C). Cells
were resuspended in lysis buffer containing 20 mm Tris ⁄ HCl
pH 8.0, 1 mm EDTA, 0.01 mm phenylmethanesulfonyl fluoride, 2 mm dithiothreitol and 10% glycerol, and disrupted
using sonication. After centrifugation (45 min, 19 320 g at
4 °C), the protein fraction was precipitated with 60–80%
ammonium sulfate. This precipitate was collected by centrifugation (30 min at 19 320 g at 4 °C) and re-suspended in
buffer A (20 mm Tris ⁄ HCl pH 8.0, 2 mm dithiothreitol and
10% glycerol). Monitoring of each step was performed by
SDS–PAGE analysis (12% polyacrylamide). Nucleic acid
was removed by polyethylene-imine precipitation, and the
subsequent purification steps were performed at 4 °C. The
protein was dialyzed extensively against buffer A at 4 °C
overnight, and purified using an anion exchange Q-Sepharose column (Amersham Biosciences, Uppsala, Sweden)
eluted with a linear gradient of 0–1 m NaCl. The fractions
containing the protein were pooled and precipitated by
addition of ammonium sulfate to a concentration of 75%.
The precipitated protein was dissolved in buffer A, subjected
to gel filtration on a Sephacryl-200 column (Amersham
Biosciences), equilibrated with the same buffer using an
AKTA Basic FPLC system (Amersham Biosciences). Protein purity was checked by 12% SDS–PAGE, and all samples were characterized by LC-ESI mass spectroscopy.
Protein concentrations were determined by the Bradford
method [53] using BSA as a standard.
Enzyme activity
The enzyme activity of TIM was determined by the conversion of glyceraldehyde 3-phosphate to dihydroxyacetone
phosphate in the presence of TIM and a-glycerolphosphate
dehydrogenase [54,55]. Enzymes were freshly prepared in
100 mm triethanolamine ⁄ HCl (pH 7.6). The reaction
mixture (final volume 1 mL) contained 100 mm triethanolamine, 5 mm EDTA, 0.5 mm NADH and a-glycerolphosphate
dehydrogenase (20 lgỈmL)1) and 0.10–3.0 mm glyceraldehyde 3-phosphate. Enzyme activity was determined by
monitoring the decrease in absorbance of NADH at
340 nm. The dependence of the initial rate on the substrate
concentration was analyzed according to the Michaelis–
Menten equation (Eqn 1) as follows:
v ẳ Vmax ẵS=Km ỵ ẵS
1ị
where v and Vmax are the initial velocity and the maximum
velocity, respectively, Km is the Michaelis constant, and S is
the substrate concentration. The values for the kinetic
FEBS Journal 276 (2009) 4169–4183 ª 2009 The Authors Journal compilation ª 2009 FEBS
4179
Effect of mutation on the dimer interface of PfTIM
M. Banerjee et al.
parameters (Km, kcat) were calculated from Lineweaver–
Burke plots. The data were then analyzed using graphpad
prism software, version 4.
Size-exclusion chromatography
Size-exclusion chromatography was performed using a
Superdex-200 column (length 30 cm, internal diameter
10 mm) attached to an AKTA Basic HPLC system at a
flow rate of 0.5 mLỈmin)1. The solvent system was 20 mm
Tris ⁄ HCl at pH 8.0. Protein elution was monitored at a
wavelength of 280 nm. The column was calibrated using
b-amylase (200 kDa), alcohol dehydrogenase (150 kDa),
BSA (66 kDa), carbonic anhydrase (29 kDa) and cytochrome c (12.4 kDa). All chromatographic runs were
performed at 25 °C.
at 222 nm were monitored. A cuvette of path length 1 mm
was used, and the spectra were averaged over four scans at
a scanning speed of 10 nmỈmin)1. The change in ellipticity
was measured as a function of temperature for thermal
melting. Denaturation studies were performed by incubating 4–5 lm protein with various concentrations of urea and
guanidinium chloride for 45–60 min, and spectra (250–
200 nm) are averaged over four scans.
Structure analysis
All structural superpositions were carried out by secondary
structure matching using COOT [56]. Hydrogen bonds and
van der Waals contacts were identified using the contact
program of the CCP4 suite, based on distance criteria of
˚
3.5 and 4.0 A, respectively. The figures were generated
using pymol [57].
Mass spectrometry
Electrospray ionization mass spectra were recorded on an
electrospray mass spectrometer Esquire 3000+ series (Bruker
Daltonics) coupled to an online 1100 series HPLC (Agilent
Technologies, Santa Clara, CA, USA). Nebulization was
assisted by N2 gas (99.8%) at a flow rate of 10 LỈmin)1. The
spray chamber was held at 300 °C. The spectrometer was
tuned using five calibration standards provided by the manufacturer. Data processing was performed using the deconvolution module of the data analysis software to detect the
multiple charge states and obtain derived masses.
Fluorescence spectroscopy
Fluorescence emission spectra were recorded on a Hitachi250 spectrofluorimeter (Hitachi technologies, Tokyo, Japan).
The protein samples were excited at 280 or 295 nm, separately, and the emission spectra recorded from 300–400 nm.
Excitation and emission band passes were set at 5 nm.
Denaturation studies were performed by incubating 10 lm
protein with various concentrations of urea and guanidinium
chloride for 45–60 min, and individual spectra were acquired
from 300–450 nm after exciting the molecule at 295 nm. For
quenching studies, acrylamide was added to the protein
solution and incubated for 5 min, after which fluorescence
spectra were recorded. The fluorescence intensities were
normalized to construct the Stern–Volmer plots [30]. The
excitation wavelength for quenching studies was 295 nm.
Circular dichroism (CD)
Far-UV CD measurements were performed on a JASCO715 spectropolarimeter (JASCO technologies, Tokyo,
Japan) equipped with a thermostatted cell holder. The temperature of the sample solution was controlled using a Peltier device. For thermal melting studies, ellipticity changes
4180
Acknowledgements
We are grateful to Professor N. V. Joshi for the
analysis of TIM sequences and several illuminating
discussions. The mass spectral facility was supported
under the Proteomics program of the Department of
Biotechnology of the Council for Scientific and Industrial Research. M.B. was a senior research fellow of
the Council for Scientific and Industrial Research,
Government of India. This research was supported by
program grants from Department of Biotechnology
(DBT), Department of science and technology (DST),
Council of Scientific and Industrial research (CSIR)
and senior research fellowship from CSIR, Government of India.
References
1 Rieder SV & Rose IA (1959) The mechanism of the
triosephosphate isomerase reaction. J Biol Chem 234,
1007–1010.
2 Banner DW, Bloomer AC, Petsko GA, Phillips DC,
Pogson CI, Wilson IA, Corran PH, Furth AJ, Milman
JD, Offord RE et al. (1975) Structure of chicken muscle
triosephosphate isomerase determined crystallographi˚
cally at 2.5 A resolution using amino acid sequence
data. Nature 255, 609–614.
3 Knowles JR (1991) Enzyme catalysis: not different, just
better. Nature 350, 121–124.
4 Putman SJ, Coulson AF, Farley IR, Riddleston B &
Knowles JR (1972) Specificity and kinetics of triosephosphate isomerase from chicken muscle. Biochem J
129, 301–310.
5 Phillips DC (1981) Crystallographic studies of movement within proteins. Biochem Soc Symp 46, 1–15.
FEBS Journal 276 (2009) 4169–4183 ª 2009 The Authors Journal compilation ª 2009 FEBS
M. Banerjee et al.
6 Rose IA (1981) Chemistry of proton abstraction by
glycolytic enzymes (aldolase, isomerases and pyruvate
kinase). Philos Trans R Soc Lond B Biol Sci 293, 131–
143.
7 Gracy RW (1982) Glucosephosphate and triosephosphate isomerases: significance of isozyme structural differences in evolution, physiology, and aging. Isozymes
6, 169–205.
8 Lolis E & Petsko GA (1990) Transition-state analogues
in protein crystallography: probes of the structural
source of enzyme catalysis. Annu Rev Biochem 59, 597–
630.
´
9 Rodrı´ guez-Almazan C, Arreola R, Rodrı´ guez-Larrea D,
´
´
´
Aguirre-Lopez B, de Gomez-Puyou MT, Perez-Mont´
fort R, Costas M, Gomez-Puyou A & Torres-Larios A
(2008) Structural basis of human triosephosphate isomerase deficiency: mutation E104D is related to alterations of a conserved water network at the dimer
interface. J Biol Chem 283, 23254–23263.
10 Walden H, Bell GS, Russell RJ, Siebers B, Hensel R &
Taylor GL (2001) Tiny TIM: a small, tetrameric, hyperthermostable triosephosphate isomerase. J Mol Biol
306, 745–757.
11 Walden H, Taylor GL, Lorentzen E, Pohl E, Lilie H,
Schramm A, Knura T, Stubbe K, Tjaden B & Hensel R
(2004) Structure and function of a regulated archaeal
triosephosphate isomerase adapted to high temperature.
J Mol Biol 342, 861–875.
12 Gayathri P, Banerjee M, Vijayalakshmi A, Azeez S,
Balaram H, Balaram P & Murthy MRN (2007) Structure of triosephosphate isomerase (TIM) from Methanocaldococcus jannaschii. Acta Crystallogr D Biol
Crystallogr 63, 206–220.
13 Borchert TV, Abagyan R, Kishan KV, Zeelen JP &
Wierenga RK (1993) The crystal structure of an engineered monomeric triosephosphate isomerase, monoTIM: the correct modelling of an eight-residue loop.
Structure 1, 205–213.
14 Borchert TV, Abagyan R, Jaenicke R & Wierenga RK
(1994) Design, creation, and characterization of a
stable, monomeric triosephosphate isomerase. Proc
Natl Acad Sci USA 91, 1515–1518.
15 Casal JI, Ahern TJ, Davenport RC, Petsko GA &
Klibanov AM (1987) Subunit interface of triosephosphate isomerase: site-directed mutagenesis and
characterization of the altered enzyme. Biochemistry 26,
1258–1264.
16 Borchert TV, Zeelen JP, Schliebs W, Callens M, Minke
W, Jaenicke R & Wierenga RK (1995) An interface
point-mutation variant of triosephosphate isomerase is
compactly folded and monomeric at low protein concentrations. FEBS Lett 367, 315–318.
17 Schliebs W, Thanki N, Jaenicke R & Wierenga RK
(1997) A double mutation at the tip of the dimer interface loop of triosephosphate isomerase generates active
Effect of mutation on the dimer interface of PfTIM
18
19
20
21
22
23
24
25
26
27
monomers with reduced stability. Biochemistry 36,
9655–9662.
Mainfroid V, Terpstra P, Beauregard M, Frere JM,
Mande SC, Hol WG, Martial JA & Goraj K
(1996) Three hTIM mutants that provide new
insights on why TIM is a dimer. J Mol Biol 257,
441–456.
Ravindra G & Balaram P (2005) Plasmodium
falciparum triosephosphate isomerase: new insights into
an old enzyme. Pure Appl Chem 77, 281–289.
Parthasarathy S, Ravindra G, Balaram H, Balaram P &
Murthy MRN (2002) Structure of the Plasmodium
falciparum triosephosphate isomerase –
phosphoglycolate complex in two crystal forms:
characterization of catalytic loop open and closed
conformations in the ligand-bound state. Biochemistry
41, 13178–13188.
Maithal K, Ravindra G, Balaram H & Balaram P
(2002) Inhibition of Plasmodium falciparum triosephosphate isomerase by chemical modification of an interface cysteine: electrospray ionization mass spectrometric
analysis of differential cysteine reactivities. J Biol Chem
277, 25106–25114.
´
Gomez-Puyou A, Saavedra-Lira E, Becker I, Zubillaga
´
RA, Rojo- Domı´ nguez A & Perez-Montfort R (1995)
Using evolutionary changes to achieve species-specific
inhibition of enzyme action studies with triosephosphate
isomerase. Chem Biol 2, 847–855.
Ostoa-Saloma P, Garza-Ramos G, Ramirez J, Becker I,
Berzunza M, Landa A, Gomez-Puyou A, Tuena de
Gomez-Puyou M & Perez-Montfort R (1997) Cloning,
expression, purification and characterization of triosephosphate isomerase from Trypanosoma cruzi. Eur J
Biochem 244, 700–705.
´
Garza-Ramos G, Perez-Montfort R, Rojo-Domı´ nguez
´
´
A, de Gomez-Puyou MT & Gomez-Puyou A (1996)
Species-specific inhibition of homologous enzymes by
modification of nonconserved amino acids residues. The
cysteine residues of triosephosphate isomerase. Eur J
Biochem 241, 114–120.
Gokhale RS, Ray SS, Balaram H & Balaram P (1999)
Unfolding of Plasmodium falciparum triosephosphate
isomerase in urea and guanidinium chloride:
evidence for a novel disulfide exchange reaction in a
covalently cross-linked mutant. Biochemistry 38,
423–431.
Gopal B, Ray SS, Gokhale RS, Balaram H, Murthy
MR & Balaram P (1999) Cavity-creating mutation at
the dimer interface of Plasmodium falciparum triosephosphate isomerase: restoration of stability by disulfide cross-linking of subunits. Biochemistry 38,
478–486.
Maithal K, Ravindra G, Nagaraj G, Singh SK,
Balaram H & Balaram P (2002) Subunit interface
mutation disrupting an aromatic cluster in Plasmodium
FEBS Journal 276 (2009) 4169–4183 ª 2009 The Authors Journal compilation ª 2009 FEBS
4181
Effect of mutation on the dimer interface of PfTIM
28
29
30
31
32
33
34
35
36
37
38
39
40
M. Banerjee et al.
falciparum triosephosphate isomerase: effect on dimer
stability. Protein Eng 15, 575–584.
Pattanaik P, Ravindra G, Sengupta C, Maithal K,
Balaram P & Balaram H (2003) Unusual fluorescence
of W168 in Plasmodium falciparum triosephosphate
isomerase, probed by single-tryptophan mutants. Eur J
Biochem 270, 745–756.
Reyes-Vivas H, Diaz A, Peon J, Mendoza-Hernandez
G, Hernandez- Alcantara G, De la Mora-De la Mora I,
Enriquez-Flores S, Dominguez-Ramirez L & LopezVelazquez G (2007) Disulfide bridges in the mesophilic
triosephosphate isomerase from Giardia lamblia are
related to oligomerization and activity. J Mol Biol 365,
752–763.
Lakowicz JR (1999) Principles of Fluorescence Spectroscopy, 2nd edn. Plenum Press, Nw York.
Jogl G, Rozovsky S, McDermott AE & Tong L (2003)
Optimal alignment for enzymatic proton transfer:
structure of the Michaelis complex of triosephosphate
˚
isomerase at 1.2 A resolution. Proc Natl Acad Sci USA
100, 50–55.
Albery WJ & Knowles JR (1976) Free-energy profile of
the reaction catalyzed by triosephosphate isomerase.
Biochemistry 15, 5627–5631.
Raines RT & Knowles JR (1986) The mechanistic pathway of a mutant triosephosphate isomerase. Ann NY
Acad Sci 471, 266–271.
Nickbarg EB, Davenport RC, Petsko GA & Knowles
JR (1988) Triosephosphate isomerase: removal of a
putatively electrophilic histidine residue results in a subtle change in catalytic mechanism. Biochemistry 27,
5948–5960.
Komives EA, Chang LC, Lolis E, Tilton RF, Petsko
GA & Knowles JR (1991) Electrophilic catalysis in
triosephosphate isomerase: the role of histidine-95.
Biochemistry 30, 3011–3019.
Lodi PJ, Chang LC, Knowles JR & Komives EA (1994)
Triosephosphate isomerase requires a positively charged
active site: the role of lysine-12. Biochemistry 33, 2809–
2814.
Hall A & Knowles JR (1975) The uncatalyzed rates of
enolization of dihydroxyacetone phoshate and of
glyceraldehyde 3-phosphate in neutral aqueous
solution. The quantitative assessment of the effectiveness~of an enzyme catalyst. Biochemistry 14, 4348–4353.
Albery WJ & Knowles JR (1976a) Evolution of enzyme
function and the development of catalytic efficiency.
Biochemistry 15, 5631–5640.
Leadlay PF, Albery WJ & Knowles JR (1976) Energetics of triosephosphate isomerase: deuterium isotope
effects in the enzyme-catalyzed reaction. Biochemistry
15, 5617–5620.
Albery WJ & Knowles JR (1977) Efficiency and evolution of enzyme catalysis. Angew Chem Int Ed Engl 16,
285–293.
4182
41 Rose IA (1984) Failure to confirm previous
observation on triosephosphate isomerase intermediate and bound substrate complexes. Biochemistry 23,
5893–5894.
42 Rose IA, Fung WJ & Warms JV (1990) Proton diffusion in the active site of triosephosphate isomerase. Biochemistry 29, 4312–4317.
43 Bash PA, Field MJ, Davenport RC, Petsko GA, Ringe
D & Karplus M (1991) Computer simulation and analysis of the reaction pathway of triosephosphate isomerase. Biochemistry 30, 5826–5832.
44 Cui Q & Karplus M (2003) Catalysis and specificity in
enzymes: a study of triosephosphate isomerase and
comparison with methyl glyoxalsynthase. Adv Protein
Chem 66, 315–372.
45 Gunasekaran K, Ramakrishnan C & Balaram P (1996)
Disallowed Ramachandran conformations of amino
acid residues in protein structures. J Mol Biol 264,
191–198.
46 Jia Z, Vandonselaar M, Quali JW & Delbaere TJ
(1993) Active-centre torsion-angle strain revealed in
˚
1.6 A-resolution structure of histidine-containing phosphor carrier protein. Nature 361, 94–97.
47 Dougherty DA (2007) Cation–p interactions
involving aromatic amino acids. J Nutr 137,
1504S–1508S.
48 Crowley P B & Golovin A (2005) Cation–p interactions
in protein interfaces. Proteins 59, 231–239.
49 Gregoret LM, Rader SD, Fletterick RJ & Cohen FE
(1991) Hydrogen bonds involving sulfur atom in proteins. Proteins 9, 99–107.
50 Ranie J, Kumar VP & Balaram H (1993) Cloning of
the triosephosphate isomerase gene of Plasmodium falciparum and expression in Escherichia coli. Mol Biochem
Parasitol 61, 159–169.
51 Sarkar G & Sommer SS (1990) The ‘megaprimer’
method of site-directed mutagenesis. BioTechniques 8,
404–407.
52 Sambrook J & Russell DW (2001) Molecular Cloning:
A Laboratory Manual, 3rd edn. Cold Spring Harbor
Laboratory Press, Cold Spring Harbor, NY.
53 Bradford MM (1976) A rapid and sensitive method
for the quantitation of microgram quantities of protein
utilizing the principle of protein–dye binding. Anal
Biochem 72, 248–254.
54 Oesper P & Meyerhof O (1950) The determination
of triose phosphate isomerase. Arch Biochem 27,
223–233.
55 Plaut B & Knowles JR (1972) pH-dependence of the
triosephosphate isomerase reaction. Biochem J 129,
311–320.
56 Krissinel E & Henrick K (2004) Secondary-structure
matching (SSM), a new tool for fast protein structure
alignment in three dimensions. Acta Crystallogr D Biol
Crystallogr 60, 2256–2268.
FEBS Journal 276 (2009) 4169–4183 ª 2009 The Authors Journal compilation ª 2009 FEBS
M. Banerjee et al.
57 DeLano WL (2002) The PyMOL Molecular Graphics
System. DeLano Scientific, San Carlos, CA.
Supporting information
The following supplementary material is available:
Fig. S1. Reducing 12% SDS–PAGE for purified
PfTIM wild-type and mutants.
Fig. S2. LC-ESI mass spectra of PfTIM W11F ⁄
W168F and W11F ⁄ W168F ⁄ Y74W mutants, together
with its charge state distribution.
Effect of mutation on the dimer interface of PfTIM
Fig. S3. Michaelis–Menten and Lineweaver–Burke
plots of PfTIM interface mutants.
This supplementary material can be found in the
online version of this article.
Please note: As a service to our authors and readers,
this journal provides supporting information supplied
by the authors. Such materials are peer-reviewed and
may be re-organized for online delivery, but are not
copy-edited or typeset. Technical support issues arising
from supporting information (other than missing files)
should be addressed to the authors.
FEBS Journal 276 (2009) 4169–4183 ª 2009 The Authors Journal compilation ª 2009 FEBS
4183