Tài liệu Báo cáo khoa học: Catabolite repression in Escherichia coli – a comparison of modelling approaches docx
Bạn đang xem bản rút gọn của tài liệu. Xem và tải ngay bản đầy đủ của tài liệu tại đây (216.68 KB, 9 trang )
Catabolite repression in Escherichia coli – a comparison of
modelling approaches
Andreas Kremling, Sophia Kremling and Katja Bettenbrock
Systems Biology Group, Max Planck Institute for Dynamics of Complex Technical Systems, Magdeburg, Germany
Research in systems biology requires experimental
effort as well as theoretical attempts to elucidate the
general principles of cellular dynamics and control
and to help to improve molecular processes for engi-
neering purposes or drug design. This interdisciplinary
approach provides a promising method for advances
in biotechnology and molecular medicine. In systems
biology, quantitative experimental data and mathe-
matical models are combined in an attempt to obtain
information on the dynamics and regulatory structures
of the systems. However, depending on the degree of
biological knowledge and the amount of quantitative
data, the models developed so far differ in their degree
of granularity, starting with a simple on ⁄ off binary
description of the state variables of the system and
ending with fully mechanistic models. Carbohydrate
uptake via the phosphoenolpyruvate-dependent phos-
photransferase system (PTS) in Escherichia coli is one
of the best studied biochemical networks from theo-
retical and experimental points of view, and has
Keywords
Escherichia coli; model verification; modular
modelling; phosphotransferase system; time
hierarchies
Correspondence
A. Kremling, Systems Biology Group, Max
Planck Institute for Dynamics of Complex
Technical Systems, Sandtorstr. 1, 39106
Magdeburg, Germany
Fax: +49 0391 6110 526
Tel: +49 0391 6110 466
E-mail:
(Received 26 September 2008, revised 14
November 2008, accepted 19 November
2008)
doi:10.1111/j.1742-4658.2008.06810.x
The phosphotransferase system in Escherichia coli is a transport and sen-
sory system and, in this function, is one of the key players of catabolite
repression. Mathematical modelling of signal transduction and gene expres-
sion of the enzymes involved in the transport of carbohydrates is a promis-
ing approach in biotechnology, as it offers the possibility to achieve higher
production rates of desired components. In this article, the relevance of
methods and approaches concerning mathematical modelling in systems
biology is discussed by assessing and comparing two comprehensive mathe-
matical models that describe catabolite repression. The focus is thereby on
modular modelling with the relevant input in the central modules, the
impact of quantitative model validation, the identification of control struc-
tures and the comparison of model predictions with respect to the available
experimental data.
Abbreviations
cAMP, cyclic AMP (signalling molecule); Crp, catabolite repression protein (transcription factor); CyaA, adenylate cyclase (protein,
synthesizes cAMP); dFBA, dynamic FBA (takes into account the slow dynamics of extracellular components); EI, enzyme I (protein,
component of the PTS); EIIA, enzyme IIA (protein, component of the PTS, ‘output’ of the system as it activates the synthesis of cAMP);
EIIBC (PtsG), enzyme IIBC (main membrane standing transport protein for glucose uptake); FBA, flux balance analysis (tool to determine the
flux distribution in cellular networks, requires steady-state conditions); HPr, histidine-containing protein (component of the PTS); LacZ,
protein of the lactose degradation pathway (b-galactodidase); Mlc, repressor protein (inhibits the synthesis of EIIBC if glucose is not present
in the medium); o.d.e., ordinary differential equation (basic structure of a mathematical model, it describes the temporal changes of a
component in the network, must be solved numerically); PTS, phosphotransferase system (uptake and sensory system in many bacteria,
consists of several proteins); rFBA, regulatory FBA (takes into account the transcriptional regulatory network to describe the presence or
absence of the enzyme of the network as a function of the environmental conditions).
594 FEBS Journal 276 (2009) 594–602 ª 2008 The Authors Journal compilation ª 2008 FEBS
become more and more important during recent years.
A comprehensive review of the experimental and theo-
retical work is provided in [1].
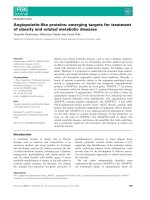
The PTS represents a group translocation system
that catalyses the uptake and concomitant phosphory-
lation of glucose and a number of other carbohydrates
(Fig. 1). It consists of two common cytoplasmic pro-
teins, enzyme I (EI) and histidine-containing protein
(HPr), as well as an array of carbohydrate-specific
enzyme II (EII) complexes. EII is typically composed
of EIIA, B and C domains, with the EIIA and B do-
mains being part of the phosphorylation chain and the
EIIC domain representing the membrane domain. As
all components of the PTS, depending on their phos-
phorylation status, can interact with various key regu-
lator proteins, the output of the PTS is represented by
the degree of phosphorylation of the proteins. In par-
ticular, the glucose-specific EIIA
Crr
(throughout the
text, we use the abbreviation EIIA for EIIA
Crr
)
domain is an important regulatory protein: unphos-
phorylated EIIA inhibits the uptake of other non-PTS
carbohydrates by a process called inducer exclusion,
whereas phosphorylated EIIA activates adenylate
cyclase (CyaA) and leads to an increase in the intra-
cellular cyclic AMP (cAMP) level [1].
Mathematical models of catabolite
repression in E. coli
The (isolated) reactions of the PTS have been sub-
jected to various kinetic studies. These models have
focused on the kinetics of phosphotransfer between the
components [2] or have taken into account diffusion
between the membrane and cytosol [3], but have
neglected metabolism and gene expression.
Mathematical models of carbohydrate uptake and
metabolism in E. coli are represented very well in the
literature. Wong et al. [4] have provided a compre-
hensive model of glucose and lactose uptake, including
catabolite repression and inducer inclusion. The model
describes diauxic growth qualitatively well, but was
not calibrated with time course experimental data.
Growth on mixed substrates, such as sucrose and glyc-
erol, has been analysed in [5] and [6]. A detailed model
of glycolysis has been provided by Chassagnole et al.
[7]. The kinetic parameters of the model were fitted
with time course data of a glucose pulse, and describe
the dynamics during the first 40 s after the pulse. As a
result of the short time scale, gene expression was not
included. Consideration of longer time scales in cellu-
lar networks allows the simplification of the set of
equations by assuming a steady state of the intra-
cellular metabolites. An approach that combines flux
balance analysis (FBA) with an ordinary differential
equation (o.d.e.) model of the slow time scales is called
dynamic flux balance analysis (dFBA), and was
applied for diauxic growth of E. coli on glucose and
acetate [8]. The model predicts very well the time
course of the external metabolites and the growth of
biomass. In Santillan and Mackey [9], a detailed model
of the lac operon was provided and analysed with
respect to the bistable behaviour and influence of
external glucose. Moreover, the model takes into
account delays inherent to transcription and transla-
tion. A qualitative approach to catabolite repression
was suggested by Ropers et al. [10]. The model
describes the transition from exponential growth to the
stationary growth phase, and vice versa. Sevilla et al.
[11] extended the model of Kremling et al. [12] to
describe l-carnithine biosynthesis with E. coli as host
strain. Using the same modular model set-up, a clear
relationship between external cAMP and l-carnithine
biosynthesis was predicted with the model and finally
verified with experimental data. Recently, Covert et al.
[13] combined a regulatory FBA (rFBA) model of
catabolite repression with the o.d.e. model of Kremling
et al. [14] to predict intracellular fluxes of central
metabolism and gene expression of the lactose and
glucose transport systems.
In this study, we compare two models describing
catabolite repression in E. coli by discussing some
relevant issues of modelling in systems biology, model
validation, dynamics and control. Nishio et al. [15]
described the glucose PTS, the main glucose uptake
system of E. coli. The authors argued that an
improved and higher uptake rate of glucose would
have some benefits in biotechnological applications, as
the uptake of the main carbohydrate is the key for the
production of secondary metabolites or foreign pro-
teins. For this purpose, a rational design based on a
mathematical description of the system was presented
P~HPr
P~EIICB
P~EI
EI
Pyk
HPrEIICB
Non−PTS systems
P~EIIA
EIIA
PEP
pyruvate
Chemotaxis
Mlc
PtsG repressor
Glycolysis
Adenylate cyclase
Glc6P
Glucose
(extracellular)
Fig. 1. Glucose uptake by the PTS. The phosphoryl group of
phosphoenolpyruvate is transferred to the incoming glucose. The
degrees of phosphorylation of the various PTS proteins represent
starting points for a number of signal transduction pathways.
A. Kremling et al. Modelling catabolite repression in E. coli
FEBS Journal 276 (2009) 594–602 ª 2008 The Authors Journal compilation ª 2008 FEBS 595
and experimental data were provided and compared
with the theoretical results. The structure of the model
of Bettenbrock and coworkers [14,16–19] is similar and
describes the dynamic behaviour of growth of E. coli
in different environmental conditions and with differ-
ent strain variants. These models were chosen because
they describe catabolite repression in a very com-
prehensive manner, taking into account signal trans-
duction, gene expression and metabolism.
Model description
Both models are set up in a modular way. The mod-
ules defined in Nishio et al. [15] are represented by a
special graphical notation [20]. The following modules
are defined. Plant: includes the four PTS proteins;
feedback sensor: includes the activation of CyaA by
phosphorylated EIIA; computer: describes catabolite
repression protein (Crp) and Cya gene expression and
cAMP synthesis; accelerator actuator: comprises the
control and synthesis of the PTS mRNA; brake actua-
tor: describes the control and synthesis of the PtsG
repressor Mlc. Protein synthesis is described by taking
into account transcription (mRNAs of the respective
proteins are dynamic state variables) and translation.
Transcriptional control includes the interaction of the
regulator proteins Mlc and Crp with the respective
binding sites.
The model is validated by a qualitative comparison
with experimental data. With the model at hand,
Nishio et al. [15] performed an experimental design to
increase glucose uptake. They reported that an Mlc
mutant with amplified ptsI gene results in an increased
glucose uptake by a factor of 11.08, which is the high-
est value that could be achieved based on the model.
The model of Bettenbrock et al. [18] describes the
uptake of five carbohydrates (glucose, lactose, glycerol,
galactose, sucrose). The model is structured in such a
way that pathways well known from biochemical text
books are represented as modules. The pathways for
the individual carbohydrates, including the description
of protein synthesis, are connected to the glycolysis
module. The PTS reactions, the synthesis of cAMP
and the activation of Crp by cAMP are described in a
module that represents the signal flow on the modulon
level. Although the model has a large number of
unknown or uncertain parameters, nearly 34% of the
kinetic constants could be estimated from a compre-
hensive set of experiments.
Both models are based on balance equations of the
involved components, that is, processes that increase
or decrease the components are summed. This results
in a set of first-order o.d.e. as mathematical represen-
tation. Table 1 summarizes the specific attributes for
the two models. It follows a systematic comparison of
both models with respect to the model structure, model
validation and model prediction.
Model structure – reasonable
application of modular modelling
In microbiology, the term pathway is used to lump
together a set of enzyme catalyzed reactions that ful-
fills a specific task like the break down of substrates,
the generation of energy in form of ATP, or the syn-
thesis of amino acids. Based on this more fuzzy defini-
tion, the idea of a modular representation of cellular
processes is very popular [21]. One advantage of the
method of modular modeling is that the granularity of
the submodels can easily be adjusted to the objective
of the model and to the level of biological knowledge
that is incorporated in the model.
Phosphoenolpyruvate
⁄
pyruvate ratio is the most
important input into the PTS module
A modular concept was used by Nishio et al. [15] to
define the units that describe the genetic organization
of the PTS: the genes and enzymes ⁄ proteins involved
are separated into four units. The contribution focuses
on the extracellular glucose concentration as input into
the defined units; changes in this concentration will
lead to different degrees of phosphorylation of the
PTS proteins EI, HPr, EIIA and EIICB. Although
Nishio et al. [15] performed some simulation studies
Table 1. Overview of functional units, process description and
number of state variables for both models (·, considered in the
model; –, not considered in the model).
Nishio
et al. [15]
Bettenbrock
et al. [18]
Crp modulon ··
PTS reactions ··
Glucose transport ··
Other carbohydrates – ·
Glycolytic reactions – ·
Environment Constant Dynamic
Gene expression Includes mRNA
dynamics
Only protein
synthesis
Multiple binding sites
a
Yes Partial
Number dynamic states 19 29
Number algebraic states 44 41
Model verification Qualitative Quantitative
a
Multiple binding sites, that is, the number of binding sites for
every transcription factor; this number varies for every gene. For
example, Nishio et al. [15] take into account that the mlc gene
possesses two binding sites for Crp and two for Mlc.
Modelling catabolite repression in E. coli A. Kremling et al.
596 FEBS Journal 276 (2009) 594–602 ª 2008 The Authors Journal compilation ª 2008 FEBS
with different concentrations of intracellular phospho-
enolpyruvate and pyruvate, the concentrations were
always held constant during these experiments, and no
account was taken of changes in the phosphoenol-
pyruvate and pyruvate concentrations as a result of
altered glycolytic fluxes. Neglecting this important
input into the PTS restricts the changes in the degree
of phosphorylation of PTS proteins to changes only in
the extracellular glucose concentration (Fig. 1).
It has been argued by our group and others [22,23]
that the phosphoenolpyruvate ⁄ pyruvate ratio is a very
important factor for the determination of the degree of
phosphorylation of EIIA as the PTS reaction network
works in a reversible manner. Therefore, in our repre-
sentation, the phosphoenolpyruvate and pyruvate con-
centrations are seen as important inputs into the PTS.
In [16], we suggested that the PTS should be defined
as a functional unit and as part of a signal transduc-
tion unit that processes information from the cellular
exterior (concentration of substrates) and also from
inside the cell, mainly the flux through glycolysis,
which is reflected by the ratio of the concentrations of
phosphoenolpyruvate and pyruvate and the concentra-
tions of PTS enzymes. In recent publications
[14,19,22], the system was analysed for a large number
of substrates using a mathematical model, and it was
shown that, in the case of non-PTS carbohydrates
(carbohydrates that are not phosphorylated during
uptake, such as lactose or arabinose), a simple rela-
tionship between the degree of phosphorylation of
EIIA (EIIAP) and the ratio of the concentrations of
phosphoenolpyruvate and pyruvate (PEP ⁄ Prv) could
be established:
EIIAP ¼ EIIA
0
PEP=Prv
PEP=Prv þ K
PTS
ð1Þ
where K
PTS
is the overall equilibrium constant of the
first three PTS reactions and EIIA
0
is the total concen-
tration of EIIA. With the experimental data available
from Bettenbrock et al. [23] for different experimental
conditions, the relationship between the degree of
phosphorylation of EIIA and the specific growth rate
could thus be described with good accuracy. In the
case of PTS sugars, Eqn (1) represents an upper bound
for the degree of phosphorylation of EIIA that can be
reached if the PTS enzyme concentrations are suffi-
ciently high. In the case of uptake of a PTS sugar,
EIIA will be less phosphorylated because, during the
PTS uptake reaction, phosphoryl groups are trans-
ferred from EIIA to glucose.
The consideration of external glucose only as input
could lead to the conclusion that, in the absence of
glucose or during growth on other carbohydrates, the
degree of phosphorylation of EIIA is always high,
leading to the activation of the transcription factor
Crp. However, this contradicts experimental observa-
tions which show that growth on carbon sources such
as glucose 6-phosphate or lactose results in rather low
degrees of phosphorylation of EIIA [22,23]. Moreover,
growth on glucose 6-phosphate leads to growth rates
comparable with those on glucose [23]. This may be
the reason why the glucose 6-phosphate transporter
does not require the activation of transcription factor
Crp (Crp is known to be active in the case of a hunger
situation).
The structure of the model of Bettenbrock et al. [18],
namely the connection between the glycolytic flux and
the PTS, made it possible to analyse and to understand
the above-mentioned results on how the cell can adjust
precisely to the degree of activation of the transcription
factor Crp as a function of the growth rate. In addi-
tion, it allows the analysis of cellular processes in the
case of mutations in the glucose uptake system or the
PTS. Setting the concentration of phosphoenolpyruvate
and pyruvate to constant values independent of the
glycolytic flux, as in Nishio et al. [15], means that this
crucial and very important point is disregarded when
trying to understand and model glucose uptake via the
PTS.
Dilution caused by cellular growth
It is well accepted that mass balance equations are a
sound basis for describing the temporal changes of
model components. A problem may occur when not
the masses per se but the concentration (mass of a
compound based on a certain volume, or mass of a
compound based on the entire biomass as usual in bio-
engineering) is the focus of the model, as in the two
contributions discussed here. This requires that the
balance equation be converted because, in cellular sys-
tems, the reference value, the biomass, is also subject
to change. This results in a dilution term d , which is
the product of a specific growth rate and the concen-
tration of the compound that has to be taken into
account. So, the general form of an o.d.e. will read:
_
c
i
¼
X
n
j¼1
c
ji
r
j
À d ¼
X
n
j¼1
c
ji
r
j
À lðtÞc
i
ð2Þ
where c
ji
are the stoichiometric coefficients and r
j
are
the reaction rates. As the growth rate changes for the
different experimental set-ups and depends on time t,
the influence of the dilution term can be very promi-
nent. During examination of the general form of the
A. Kremling et al. Modelling catabolite repression in E. coli
FEBS Journal 276 (2009) 594–602 ª 2008 The Authors Journal compilation ª 2008 FEBS 597
equations used by Nishio et al. [15], dilution was not
considered.
Dynamics of the environmental state variables
In biotechnology, increased production rates of desired
products are obtained by designing the feed rate and
feed concentration of the major substrates of a biore-
actor system. This also requires that the components
of the liquid phase are described with mass balances.
In the model of Nishio et al. [15], the only variable
that describes the environment is the glucose concen-
tration. This concentration must be fixed before a sim-
ulation starts. In contrast, the model of Bettenbrock
et al. [18] considers the liquid phase as an additional
module that is connected to the biophase. In the liquid
phase, o.d.e.’s to describe the dynamics of the biomass
and various medium compounds are implemented.
This allows the simulation of different strategies, such
as batch, fed-batch, ‘disturbed’ batch (that is, growth
on one carbohydrate and pulsing a second carbo-
hydrate in the second phase of the experiment) and
continuous culture. By taking into consideration the
dynamics of the environmental state variables, there
is high flexibility to design new experiments and to
complement strategies that focus only on genetic modi-
fications of the system.
Large efforts to validate quantitative
models
Mathematical models are valuable tools for the anal-
ysis of inherently complex biological systems. To date,
there are no holistic models that represent complete
cells. This means that only subsystems of cells can be
analysed, which can lead to severe problems in the
suitability of a model. This is especially true for a
rational design if the effects of a modification are not
limited to the subsystem represented in the model or
not described in a quantitative manner to guarantee
high model accuracy. Quantitative model validation is
therefore a prerequisite for meaningful model analysis
and experimental design.
To simulate the dynamics of cellular systems, it is
desirable to determine kinetic parameters from experi-
mental data. As, in most cases, a direct measurement
is not possible, the parameters are estimated during a
parameter identification procedure. This comprises the
check of identifiability and the estimation of the
parameters. With the model of Bettenbrock et al. [18],
kinetic parameters for a detailed dynamic model of
carbohydrate uptake were estimated. Model predic-
tions were verified by measuring the time courses of
several extra- and intracellular components, such as
glycolytic intermediates (in a pulse experiment), EIIA
phosphorylation level, both b-galactosidase and
EIICB
Glc
concentrations, and total cAMP concen-
trations, under various growth conditions. The entire
database consisted of 18 experiments performed with
nine different strains (wild-type and mutant strains).
The model describes the expression of 17 key enzymes,
38 enzymatic reactions and the dynamic behaviour of
more than 50 metabolites. Based on the experiments
and with the help of the ProMoT ⁄ Diva environment
[24] with highly sophisticated methods for sensitivity
analysis, parameter analysis and parameter estimation,
50 parameters (34%) could be estimated.
In particular, the analysis of mutant strains offers
the possibility to check whether the control structures
are reproduced well. In addition, pulse experiments,
‘disturbed’ batch experiments and continuous cultures
allow the determination and analysis of the dynamics
in different time windows. The analysis of the mutant
strains clearly showed that a large experimental effort
is necessary for the rational design of bacterial strains
based on mathematical models.
Nishio et al. [15] provided simulation data of their
model and discussed the agreement with literature
experimental data from a qualitative point of view
only, e.g. they saw that, for high glucose concentra-
tions, the model shows low cAMP concentrations (see
fig. 4 in Nishio et al. [15]); this observation is in
agreement with experimental data. However, systems
biology aims to describe cellular processes quantita-
tively in terms of mathematical models, which also
requires that measurements are available and are of
good quality. In the contribution by Nishio et al. [15],
the standard deviations for biomass production of the
mutant strains are extremely high, indicating that the
perturbations introduced lead to severe growth prob-
lems of the strains. This is especially true for the strain
predicted to have the highest glucose uptake rate, the
mlc mutant with increased copy number of ptsI. This
strain seems to have serious growth problems [final
attenuance (D) = 0.11; for the wild-type strain, final
D = 0.81]; therefore, such a strain would be absolutely
unsuitable for use as a production strain.
As can be seen in Nishio et al. [15], there are sub-
stantial differences between model prediction and
experiment. Realizing that their model did not
describe their experimental results, Nishio et al. [15]
eliminated the biologically well accepted activation of
CyaA by phosphorylated EIIA in their model, and
called this an ‘improved model’. One could argue
that, indeed, the activation of CyaA is not necessary
in the case of glucose excess as, in this case, the
Modelling catabolite repression in E. coli A. Kremling et al.
598 FEBS Journal 276 (2009) 594–602 ª 2008 The Authors Journal compilation ª 2008 FEBS
degree of phosphorylation of EIIA is low and there-
fore the intracellular cAMP level is also low. How-
ever, this inaccurate description of the signalling
pathway, starting from PTS and ending with the tran-
scription factor Crp, will limit the predictive power of
the model for situations different from glucose excess.
In contrast, from a systems biological point of view,
model improvement would mean the creation of a
model (via parameter estimation and ⁄ or improvement
of model structure) which is able to reproduce both
the experiments used for validation and new experi-
ments which cannot be explained by the old model.
This example shows that model validation and a
critical evaluation of modelling, and also of experimen-
tal results, are of particular importance. This includes
the careful selection of biological experiments and
experimental conditions. For the evaluation of model
predictions, only reliable and reproducible data should
be used that cover a broad range of different condi-
tions, allowing for an extensive analysis of the strains
at hand.
Dynamics and time hierarchies
To show an application of their model, Nishio et al.
[15] simulated an experiment in which the external glu-
cose was reduced from saturating to limiting concen-
trations. As the model comprises metabolic processes,
protein–protein and protein–DNA interactions as well
as protein synthesis, it is expected that the dynamics
can be seen on fast time scales and on slower time
scales. In addition to the difficulties of realizing such
an experiment in the wet laboratory (to guarantee that,
in a reactor system, the glucose concentration is con-
stant at 0.2 nm over a period of time of several hours,
a highly sophisticated control scheme is required that
is able to measure the concentration on-line and to
adjust a glucose feed in such a way that the glucose
consumed by the cells is replaced by the feed), these
time scales cannot be presented in an adequate manner
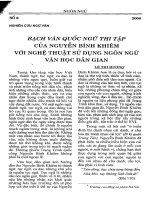
in only one plot (see fig. 3 in [15]). Figure 2 shows the
simulation results with the model of Bettenbrock et al.
[18] in the same conditions. As can be seen, the state
variables show dynamics in different time windows.
Comparing model predictions
A critical issue is the prediction of the behaviour of
mutant strains and subsequent experimental examina-
tion. We simulated the experiments shown in table 1 in
Nishio et al. [15] with the model of Bettenbrock et al.
[18]. The results are summarized in Table 2. As can be
seen, the predictions with our model are much closer
to the experimental results. The values measured for
the strain with ptsI overexpression could be repro-
duced with our model very well. For the mlc mutant,
both models give similar results and the measured
values indicate that the mutation has almost no influ-
ence on the specific glucose uptake. For a strain with
ptsG overexpression, Van der Vlag et al. [25] measured
an increase in glucose uptake, whereas with the pri-
mary model of Nishio et al. [15] a decrease was simu-
lated and with the model of Bettenbrock et al. [18] a
slight increase was observed.
Degree of phosphorylation of EIIA shows high
sensitivity with respect to glycolytic reaction
parameters
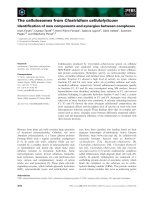
To further demonstrate the relationship between the
carbohydrate flux into the cell and the degree of phos-
phorylation of EIIA, Fig. 3 shows the experimental
results of continuous cultures during the transition
from exponential growth to carbohydrate-limited
499.5 500 500.5 501 501.5 502
0
0.5
1
1.5
2
2.5
3
3.5
4
Time (min)
PEP (solid), pyruvate (µmol·gDW
–1
)
480 500 520 540 560 580 600
0
0.01
0.02
0.03
0.04
0.05
0.06
0.07
0.08
0.09
0.1
Time (min)
Time (min)
EIIAP
(µmol·gDW
–1
)
500 600 700 800 900
1000
0
0.5
1
1.5
2
2.5
cAMP
(µmol·gDW
–1
)
Fig. 2. Dynamics of state variables after glucose depletion, calculated using the model of Bettenbrock et al. [18]. The value of glucose was
set from 0.2
M to 2 nM at time 500 min, as in Nishio et al. [15]. Left: fast dynamics of phosphoenolpyruvate and pyruvate; middle: dynamics
of EIIAP; right: slow dynamics of intracellular cAMP. Note the different time scales of the response curves.
A. Kremling et al. Modelling catabolite repression in E. coli
FEBS Journal 276 (2009) 594–602 ª 2008 The Authors Journal compilation ª 2008 FEBS 599
growth, as published in Kremling et al. [14]. These
experimental results have not been used for model vali-
dation for the detailed model. Plotting the simulation
results with the model of Nishio et al. [15] (values
taken from fig. 4 in [15] and scaled to the overall EIIA
concentration), together with the results of the model
of Bettenbrock et al. [18], into the same plot demon-
strates that both models are able to reproduce the data
with good accuracy, although it should be noted that,
in the experiments, the PTS enzyme concentrations
may differ from steady-state values. With artificial ptsI
gene amplification, however, the models show qualita-
tively different results. With the model of Nishio et al.
[15], a tenfold increase in ptsI gene concentration leads
to extremely high uptake rates and high degrees of
phosphorylation (inverted open triangle in Fig. 3),
whereas, in the model of Bettenbrock et al. [18], only
slightly increased carbohydrate fluxes are detected that
do not lead to significant EIIA phosphorylation (open
triangle in Fig. 3). This is based on the fact that the
reaction rates of glycolysis are much slower than the
PTS reaction rates, leading to a limited glycolytic flux.
Not until – in a simulation study – we destroy the
robustness of the model by modification of the glyco-
lytic enzyme concentrations and by increasing the PTS
enzyme concentrations the model shows uptake rates
and EIIA phosphorylation degrees comparable with
those of the model of Nishio et al. [15] (filled triangle
in Fig. 3).
Nishio et al. [15] reported that cAMP values do not
increase with ptsI gene amplification. The model of
Bettenbrock et al. [18] explains this result: ptsI gene
amplification does not lead to significant EIIA phos-
phorylation, hence explaining the lack of CyaA activa-
tion. This again shows that it is crucial for modelling
to cover all significant reactions. If this is not con-
sidered, model predictions may be quantitatively
incorrect.
Conclusions
The bacterial PTS is an interesting but complex signal
transduction and transport system that has been sub-
jected to research in systems biology for a long time
period. If the aim of modelling is to make predictions
and to explain experimental results, attention must be
paid to the mathematical correctness of the model, the
inclusion of relevant biological knowledge and quanti-
tative (and mostly iterative) validation of the model.
The model of Nishio et al. [15] fails to meet these
requirements, and hence is unable to predict new exper-
iments with high accuracy. Predictions with the model
of Bettenbrock et al. [18], which has been validated
quantitatively with great effort, could meet the experi-
mental results of Nishio et al. [15], demonstrating that
the model is able to predict experimental data that were
not used for model validation. A simplified model [14]
Table 2. Comparison of the predictions of the specific glucose
uptake by the model of [15] with the model of [18], and with the
experimental results of [15].
Strain
Nishio
et al.
[15]
a
Nishio
et al.
[15]
b
Bettenbrock
et al. [18]
Experimental
data
c
Wild-type 1.0 1.0 1.0 1.0
PtsI overexpression 10.8 3.87 1.2 1.2
Mlc mutant 1.0 1.21 1.0 1.1
Mlc mutant with
PtsI overexpression
11.1 5.7 1.2 1.7
PtsG overexpression 0.81 1.25 1.0 ND
Comparison of
a
primary model (values from table 1 in [15]) and
b
modified model (values from table 3 in [15]) with predictions of
the model of [18], and comparison with the experimental results of
[15].
c
Data are scaled for the wild-type: that is, the values obtained
for the wild-type are set to unity and the measurements for the
mutant strains are taken as values relative to the wild-type value.
10
−6
10
−4
10
−2
10
0
0
0.1
0.2
0.3
0.4
0.5
0.6
0.7
0.8
0.9
1
Log (carbohydrates (g·L
–1
))
Degree of phosphorylation EIIA (−)
Fig. 3. Comparison of simulation and experimental results. The
residual carbohydrate concentrations and corresponding degrees of
phosphorylation of EIIA are shown for different dilution rates.
Experimental data (circles) are taken from [23]; theoretical predic-
tions from the model of Nishio et al. [15] (full line with squares);
theoretical predictions from the model of Bettenbrock et al. [18]
(broken line with diamonds); theoretical prediction from the model
of Nishio et al. [15] with excess carbohydrate and tenfold overpro-
duced PtsI concentration (inverted open triangle); theoretical predic-
tion from the model of Bettenbrock et al. [18] with excess
carbohydrate and tenfold overproduced PtsI concentration (white
triangle); theoretical prediction from the model of Bettenbrock et al.
[18] with excess carbohydrate, increased PtsI, PtsH and PtsG con-
centrations and altered values of glycolytic reaction parameters
(filled triangle).
Modelling catabolite repression in E. coli A. Kremling et al.
600 FEBS Journal 276 (2009) 594–602 ª 2008 The Authors Journal compilation ª 2008 FEBS
has been used to explain the relationship between the
glycolytic flux, the ratio of phosphoenolpyruvate and
pyruvate, and the degree of phosphorylation of the
sensor protein EIIA of the PTS. Disregarding this very
crucial input of glycolysis on the PTS leads to a model
with only low predictive power.
The use of mathematical models for experimental
design is an important aim in a systems biology
approach. One can only succeed if comprehensive
models are used that allow for a holistic analysis of
cellular behaviour. Reduced or simplified models are
good tools to elucidate design principles from a quali-
tative point of view. Unfortunately, most of these
models fail to describe a holistic cell behaviour under
different environmental conditions. The use of detailed
models is strictly coupled with the need for careful and
extensive model validation, because the majority of
kinetic parameters need to be estimated from experi-
mental data. The reports by Nishio et al. [15] and
Bettenbrock et al. [18] are good examples which show
that experimental data can be reproduced with a cer-
tain quality. However, because of its greater complex-
ity and completeness, the model of Bettenbrock et al.
[18] is able to predict experiments in environmental
conditions that are different from those used for model
validation.
Acknowledgements
Files to simulate the Bettenbrock model with MAT-
LAB are available and can be downloaded [26]. The
files allow the reproduction of the data shown in the
paper. AK and KB are funded by the FORSYS initia-
tive from the German Federal Ministry of Education
and Research (BMBF).
References
1 Deutscher J, Francke C & Postma PW (2006) How
phosphotransferase system-related protein phosphoryla-
tion regulates carbohydrate metabolism in bacteria.
Microbiol Mol Biol Rev 70, 939–1031.
2 Rohwer JM, Meadow ND, Roseman S, Westerhoff HV
& Postma PW (2000) Understanding glucose transport
by the bacterial phosphoenolpyruvate:glucose phospho-
transferase system on the basis of kinetic measurements
in vitro. J Biol Chem 275, 34909–34921.
3 Francke C, Westerhoff HV, Blom JG & Peletier MA
(2002) Flux control of the bacterial phosphoenolpyr-
uvate:glucose phosphotransferase system and the effect
of diffusion. Mol Biol Rep 29, 21–26.
4 Wong P, Gladney S & Keasling JD (1997) Mathemati-
cal model of the lac operon: inducer exclusion, catabo-
lite repression, and diauxic growth on glucose and
lactose. Biotechnol Prog 13, 132–143.
5 ang JW, Gilles ED, Lengeler JW & Jahreis K (2001)
Modeling of inducer exclusion and catabolite repression
based on a PTS-dependent sucrose and non-PTS-depen-
dent glycerol transport system in Escherichia coli K-12
and its experimental verification. J Biotechnol 92, 133–
158.
6 Sauter T & Gilles ED (2004) Modeling and experimen-
tal validation of the signal transduction via the
Escherichia coli sucrose phosphotransferase system.
J Biotechnol 110, 181–199.
7 Chassagnole C, Noisommit-Rizzi N, Schmid JW,
Mauch K & Reuss M (2002) Dynamic modeling of the
central carbon metabolism of Escherichia coli. Biotech-
nol Bioeng 79, 53–73.
8 Mahadevan R, Edwards JS & Doyle FJ (2002)
Dynamic flux balance analysis of diauxic growth in
Escherichia coli. Biophys J 83, 1331–1340.
9 Santillan M & Mackey MC (2004) Influence of catabo-
lite repression and inducer exclusion on the bistable
behavior of the lac operon. Biophys J 86, 1282–1292.
10 Ropers D, deJong H, Page M, Schneider D & Geisel-
mann J (2006) Qualitative simulation of the carbon
starvation response in Escherichia coli. BioSystems 84,
124–152.
11 Sevilla A, Canovas M, Keller D, Reimers S & Iborra
JL (2007) Impairing and monitoring glucose catabolite
repression in l-carnithine biosynthesis. Biotechnol Prog
23, 1286–1296.
12 Kremling A, Bettenbrock K, Laube B, Jahreis K, Leng-
eler JW & Gilles ED (2001) The organization of meta-
bolic reaction networks: III. Application for diauxic
growth on glucose and lactose. Metab Eng 3, 362–379.
13 Covert IMW, Xiao N, Chen TJ & Karr JR (2008) Inte-
grating metabolic, transcriptional regulatory and signal
transduction models in Escherichia coli. Bioinformatics
24, 2044–2050.
14 Kremling A, Bettenbrock K & Gilles ED (2007) Analy-
sis of global control of Escherichia coli carbohydrate
uptake. BMC Syst Biol 1, 42.
15 Nishio Y, Usada Y, Matsui K & Kurata H (2008)
Computer-aided rational design of the phosphotransfer-
ase system for enhanced glucose uptake in Escherichia
coli.
Mol Sys Biol 4, 160.
16 Kremling A, Jahreis K, Lengeler JW & Gilles ED
(2000) The organization of metabolic reaction networks:
a signal-oriented approach to cellular models. Metab
Eng 2, 190–200.
17 Kremling A & Gilles ED (2001) The organization of met-
abolic reaction networks: II. Signal processing in hierar-
chical structured functional units. Metab Eng 3, 138–150.
18 Bettenbrock K, Fischer S, Kremling A, Jahreis K,
Sauter T & Gilles ED (2006) A quantitative approach
A. Kremling et al. Modelling catabolite repression in E. coli
FEBS Journal 276 (2009) 594–602 ª 2008 The Authors Journal compilation ª 2008 FEBS 601
to catabolite repression in Escherichia coli. J Biol Chem
281, 2578–2584.
19 Kremling A, Bettenbrock K & Gilles ED (2008) A feed-
forward loop guarantees robust behavior in Escherichia
coli carbohydrate uptake. Bioinformatics 24, 704–710.
20 Kurata H, Masaki K, Sumida Y & Iwasaki R (2005)
Cadlive dynamic simulator: direct link of biochemical
networks to dynamic models. Genome Res 15, 590–600.
21 Hartwell LH, Hopfield JJ, Leibler S & Murray AW
(1999) From molecular to modular cell biology. Nature
402 (Suppl.), C47–C52.
22 Hogema M, Arents JC, Bader R, Eijkemanns K, Yosh-
ida H, Takahashi H, Aiba H & Postma PW (1998)
Inducer exclusion in Escherichia coli by non-PTS sub-
strates: the role of the PEP to pyruvate ratio in deter-
mining the phosphorylation state of enzyme IIA
Glc
.
Mol Microbiol 30, 487–498.
23 Bettenbrock K, Sauter T, Jahreis K, Kremling A, Leng-
eler JW & Gilles ED (2007) Analysis of the correlation
between growth rate, EIIA
Crr
(EIIA
Glc
) phosphoryla-
tion levels and intracellular cAMP levels in Escherichia
coli K-12. J Bacteriol 189, 6891–6900.
24 Ginkel M, Kremling A, Nutsch T, Rehner R & Gilles
ED (2003) Modular modeling of cellular systems with
ProMoT ⁄ Diva. Bioinformatics 19, 1169–1176.
25 Van der Vlag J, Hof R, Van Dam K & Postma PW
(1995) Control of glucose metabolism by the enzymes
of the glucose phosphotransferase system in Salmonella
typhimurium. Eur J Biochem 230, 170–182.
26 Kremling A (2008) Comparison of Two Mathematical
Models for Carbohydrate Uptake of E. coli – Files to
Simulate the Bettenbrock Model. Available at: http://
www.mpi-magdeburg.mpg.de/people/kre/ecoli_model/
nishio.htm.
Modelling catabolite repression in E. coli A. Kremling et al.
602 FEBS Journal 276 (2009) 594–602 ª 2008 The Authors Journal compilation ª 2008 FEBS