Tài liệu 2011 CHILD HEALTH STATUS REPORT pdf
Bạn đang xem bản rút gọn của tài liệu. Xem và tải ngay bản đầy đủ của tài liệu tại đây (6.51 MB, 44 trang )
2011
CHILD
HEALTH
STATUS
REPORT
2 IDAHO KIDS COUNT
Adams
Canyon
Gem
Owyhee
Payette
Washington
Ada
Boise
Elmore
Valley
Blaine
Camas
Cassia
Gooding
Jerome
Lincoln
Minidoka
Twin Falls
Bannock
Bear Lake
Bingham
Butte
Caribou
Franklin
Oneida
Power
Bonneville
Clark
Custer
Fremont
Jefferson
Lemhi
Madison
Teton
Idaho
Lewis
Nez
Perce
Latah
Clearwater
Shoshone
Benewah
Kootenai
Bonner
Boundary
Panhandle
North Central
Southwest
Central
South Central Southeastern
Eastern
(District 1)
(District 2)
(District 3) (District 5) (District 6)
(District 4)
(District 7)
Map of Idaho Health Districts
Much of the data in this report is reported by
Health District. is map displays the counties
that make up the seven Health Districts of Idaho.
CHILD HEALTH STATUS REPORT 3
Introduction Contents
Maternal Health 4
Birth Outcomes 7
Immunizations: Kindergarten 10
Immunizations: First Grade 14
Immunizations: Seventh Grade 18
Health Insurance Coverage 22
Lead Exposure 27
Mortality Rates 28
Asthma 30
Mental Health 31
Substance Abuse 33
Reproductive Health 38
Weight, Nutrition, and Physical Activity 40
Reference List 42
is Idaho KIDS COUNT Child Health Status Report at-
tempts to capture the most relevant and current data related
to child health in the state. In the next few years, health
reform legislation will likely change the landscape of public
health and health care. is report may serve as a baseline by
which we can eventually assess areas for improvement and
identify areas where gains are yet to be realized.
Idaho KIDS COUNT is grateful to Sarah Clark and Sara
Herring for diligently compiling the data for this report and
to Amanda Hundt for graphic design. We are also indebted
to our colleagues at the Idaho Department of Health and
Welfare and the State Department of Education for timely
responses to data questions.
is research was funded by the Annie E. Casey Foundation.
We thank them for their support but acknowledge that the
ndings and conclusions presented here do not necessarily
reect the opinions of the Foundation.
Please visit the KIDS COUNT Data Center available at
www.idahokidscount.org for the most recent indicators on
child health and well-being.
4 IDAHO KIDS COUNT
Maternal Health
Pregnancy Risk Assessment Tracking System: Maternal Health
4
Indicator Year Idaho HD 1 HD 2 HD 3 HD 4 HD 5 HD 6 HD 7
Percent Idaho mothers
who drank alcohol during
the third trimester*
2007 3.3% 4.6% 4.9% 2.4% 4.6% 4.2% 1.5% 1.5%
2008 2.9% 4.0% 4.5% 2.5% 3.5% 3.9% 2.1% 1.0%
2009 4.1% 6.1% 7.6% 1.9% 6.7% 4.8% 2.1% 1.1%
Percent Idaho mothers
who smoked during
the third trimester
2007 8.0% 12.1% 7.9% 8.4% 8.1% 8.8% 6.3% 5.9%
2008 8.1% 11.9% 13.0% 10.5% 6.4% 5.8% 9.5% 5.5%
2009 8.5% 14.9% 11.1% 10.1% 6.2% 8.0% 10.2% 5.1%
Percent Idaho mothers
who initiated prenatal care
in the rst trimester
2007 86.5% 84.6% 87.3% 82.1% 89.7% 84.3% 86.0% 88.6%
2008 88.9% 86.5% 88.8% 86.0% 89.9% 87.1% 89.3% 92.5%
2009 89.4% 88.5% 89.4% 88.6% 89.5% 84.3% 89.8% 94.1%
Percent Idaho mothers who
received routine dental
care during pregnancy
2007 45.5% 39.8% 45.9% 39.5% 55.7% 37.5% 45.7% 44.4%
2008 50.4% 42.6% 48.7% 47.2% 61.5% 43.3% 47.6% 48.4%
2009 53.9% 50.8% 48.8% 47.2% 65.8% 43.8% 53.7% 53.4%
Notes
* Consuming one or more alcoholic beverages during the last trimester.
Maternal health and access to health care are important fac-
tors for infant health. Alcohol use during pregnancy can
have severe, negative implications for unborn fetuses and
can result in Fetal Alcohol Spectrum Disorders. In addition
to miscarriages and stillbirth, alcohol consumption during
pregnancy can cause a range of lifelong defects.
1
Smoking during pregnancy can also cause negative implica-
tions for both mom and baby, including premature births,
low birth weight, and stillbirth.
2
It is important for pregnant women to access prenatal and
dental care. Studies have shown that expectant mothers are
more susceptible to dental cavities and gum disease due to the
rise in hormone levels during pregnancy, and early-initiated
prenatal care can unveil and reduce potential complications
and ensure that both mom and baby are healthy.
3
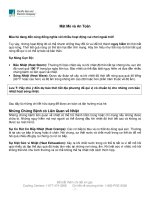
In Idaho, alcohol consumption during pregnancy increased
slightly from 2007 to 2009 from 3.3% of mothers to 4.1% of
mothers. In 2009, Health District 2 had the highest percent
of pregnant mothers consuming alcohol at 7.6%. Health
District 7 had the lowest percent at 1.1%.
4
Smoking also increased slightly between 2007 and 2009,
from 8.0% to 8.5% of pregnant women. In 2009, Health
District 1 had the highest percent of pregnant women smok-
ing at 14.9%, and Health District 7 had the lowest percent
at 5.1%. Smoking during pregnancy is more prevalent than
drinking during pregnancy by a factor of about two.
4
Prenatal care increased between 2007 and 2009, from 86.5%
to 89.4% of expectant mothers receiving routine prenatal care.
Dental care utilization during pregnancy also increased, from
45.5% to 53.9% of mothers receiving routine dental care.
4
CHILD HEALTH STATUS REPORT 5
200920082007
0%
5%
10%
15%
20%
25%
30%
35%
40%
45%
50%
HD 7HD 6HD 5HD 4HD 3HD 2HD 1Idaho
200920082007
0%
5%
10%
15%
20%
25%
30%
35%
40%
45%
50%
HD 7HD 6HD 5HD 4HD 3HD 2HD 1Idaho
6 IDAHO KIDS COUNT
200920082007
0%
10%
20%
30%
40%
50%
60%
70%
80%
90%
100%
HD 7HD 6HD 5HD 4HD 3HD 2HD 1Idaho
200920082007
0%
20%
40%
60%
80%
100%
District 7District 6District 5District 4District 3District 2District 1Idaho
10%
30%
50%
70%
90%
CHILD HEALTH STATUS REPORT 7
Birth Outcomes
Low birthweight, dened as a weight of less than 2500 grams
(approximately 5.8 lbs), can be indicative of intrauterine
growth retardation, fetal growth restriction, and/or poor
maternal nutrition. is type of growth delay contributes
to the risk of other health problems, including respiratory
distress and hypoglycemia, and is therefore a useful birth
outcome to track.
5
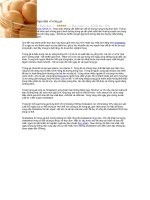
Low birthweight babies, as a percent of births, has remained
fairly consistent in Idaho over the 11-year span of 1999-
2009, ranging from a low of 6.2% in 1999 to a high of 6.9%
in 2006. Idaho has consistently been below the national av-
erage in percentage of low birthweight babies. Nationally,
low birthweight rates ranged between 7.6% and 8.3% of all
births during the same 11-year period. e percent of low
birthweight babies is calculated by dividing the number of
low birthweight babies by the total number of births.
6,7
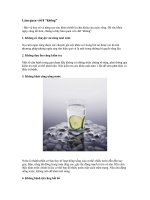
Breastfeeding in Idaho increased slightly from 2007 to 2009
from 50.5% of mothers breastfeeding for the rst six months,
to 55.4% of mothers breastfeeding for the rst six months.
In 2009, the health district with the highest prevalence of
mothers breastfeeding for the rst six months was Health
District 7 at 62.8%, and the health district with the lowest
prevalence was Health District 3 at 47.3%. Only mothers 18
years of age or older, whose infants were at least six months
at the time of the survey, are included in these data.
4
e percent of Idaho mothers reporting that their babies
hearing had been tested remained fairly constant from 2007
to 2009, increasing slightly from 94.2% to 94.8%. In 2009,
the health district with the highest reported frequency of
newborn hearing tests was Health District 6 at 98.1%, and
the health district with the lowest reported frequency of new-
born hearing tests was Health District 2 at 91.7%.
4
Routine well-baby care is essential to ensuring that newborns
are developing normally and identifying potential health
problems early. Between 2007 and 2009 the percent of Idaho
mothers who took their child for routine well-baby care visits
increased slightly from 96.9% to 98.1%. In 2009, the health
districts with the highest percent of routine well-baby visits
were Health Districts 1 and 7 at 99.0%. e health district
with the lowest percent of routine well-baby care was Health
District 5 at 96.3%.
4
Pregnancy Risk Assessment Tracking System: Infant Care
4
Indicator Year Idaho HD 1 HD 2 HD 3 HD 4 HD 5 HD 6 HD 7
Percent of Idaho mothers
who breastfed for at
least six months*
2007 50.5% 54.3% 54.2% 41.4% 53.1% 48.0% 49.8% 55.0%
2008 55.2% 58.7% 54.7% 45.5% 58.2% 53.6% 52.9% 60.4%
2009 55.4% 55.9% 60.9% 47.3% 58.6% 48.3% 53.5% 62.8%
Percent of Idaho mothers
who reported their baby's
hearing was tested
2007 94.2% 92.1% 88.4% 92.4% 96.4% 96.3% 95.5% 92.6%
2008 93.7% 89.5% 89.2% 90.1% 95.8% 97.1% 94.0% 94.9%
2009 94.8% 93.1% 91.7% 92.5% 96.9% 93.8% 98.1% 94.2%
Percent of Idaho mothers
who took their baby for
routine well-baby care
2007 96.9% 95.8% 98.1% 95.5% 98.0% 96.2% 97. 5% 96.8%
2008 97.1% 95.7% 97.7% 94.8% 98.2% 97.0% 98.2% 97.8 %
2009 98.1% 99.0% 97.4% 97.9% 98.4% 96.3% 97.6% 99.0%
Low Birthweight Babies (Percentage of Births)
6,7
1999 2000 2001 2002 2003 2004 2005 2006 2007 2008 2009
United States 7.6% 7.6% 7.7% 7.8% 7.9% 8.1% 8.2% 8.3% 8.2% 8.2% 8.2%
Idaho 6.2% 6.7% 6.4% 6.2% 6.5% 6.8% 6.7% 6.9% 6.5% 6.5% 6.6%
Notes
* Babies who were not at least six months old at the time of the survey were excluded from analysis.
8 IDAHO KIDS COUNT
IdahoUS
0
1%
2%
3%
4%
5%
6%
7%
8%
9%
20092008200720062005200420032002200120001999
200920082007
0%
District 7District 6District 5District 4District 3District 2District 1Idaho
10%
20%
30%
40%
50%
60%
70%
80%
90%
100%
CHILD HEALTH STATUS REPORT 9
200920082007
0%
20%
40%
60%
80%
100%
10%
30%
50%
70%
90%
District 7District 6District 5District 4District 3District 2District 1Idaho
200920082007
0%
10%
20%
30%
40%
50%
60%
70%
80%
90%
100%
HD 7HD 6HD 5HD 4HD 3HD 2HD 1Idaho
10 IDAHO KIDS COUNT
Idaho seventh-graders have complete immunization rates of
94.8% for DTaP, 95.8% for polio, 95.2% for MMR, and
95.2% for Hepatitis B. Idaho seventh-graders are above the
herd immunity thresholds for all of these communicable
diseases.
10
Exemption rates were 4.3% for kindergarten, 4.2% for rst
grade and 2.8% for seventh grade immunizations. Person-
al exemptions were the most common type of exemption.
Incomplete records decreased over the grades with rates of
8.5% in kindergartners, 4.5% in rst-graders, and 2.9% in
seventh-graders.
10
Immunizations: Kindergarten
Kindergarten Immunization Rates Overall
10
Idaho HD 1 HD 2 HD 3 HD 4 HD 5 HD 6 HD 7
% Complete 85.8% 75.8% 80.3% 89.5% 89.5% 79.6% 87.1% 87.4%
% Exempt 4.3% 8.8% 6.4% 4.3% 3.7% 3.5% 2.5% 3.9%
% Medical Exemption 0.2% 0.1% 0.2% 0.2% 0.3% 0.2% 0.2% 0.2%
% Religious Exemption 0.3% 0.5% 0.1% 0.8% 0.2% 0.1% 0.2% 0.2%
% Personal Exemption 3.8% 8.1% 6.2% 3.3% 3.2% 3.2% 2.2% 3.5%
% No Records 1.4% 3.5% 0.7% 0.6% 0.6% 2.7% 1.6% 1.5%
% Incomplete Records 8.5% 11.9% 12.5% 5.5% 6.1% 14.2% 8.8% 7. 3%
It is helpful to examine immunization rates in the context of
herd immunity. Herd immunity refers to the portion of the
population that should be vaccinated against a communi-
cable disease in order to stop the spread of that disease. Note
that although the herd immunity threshold for a communi-
cable disease may be reached, outbreaks can and do occur
on a smaller scale. Estimated herd immunity thresholds for
reported immunizations are listed below.
8
Idaho kindergartners have complete immunization rates of
87.7% for DTaP (diphtheria, tetanus and acellular pertussis),
93.1% for polio, 87.7% for MMR (measles, mumps and
rubella), and 93.0% for Hepatitis B. Idaho kindergartners
are above the threshold for herd immunity for these com-
municable diseases except pertussis (whooping cough) and
are below the upper end of the measles threshold.
10
Idaho rst-graders have com-
plete immunization rates of
92.1% for DTaP, 94.8% for
polio, 92.0% for MMR, and
94.4% for Hepatitis B. Like
kindergartners, Idaho first
graders are above the thresh-
old for herd immunity for
these communicable diseases
except pertussis (whooping
cough) and are below the
upper end of the measles
threshold.
10
Notes
*An estimated herd immunity threshhold is not listed for Hepatitis B due to the complexity of the disease and the various modes of transmission.
One study conducted outside of the U.S. reported an estimated herd immunity threshold of 63-77% for Hepatitis B.
9
Estimated Herd
Immunity Thresholds
8
Disease*
Herd
Immunity
Diphtheria 85%
Pertussis 92-94%
Polio 80-86%
Measles 83-94%
Mumps 75-86%
Rubella 83-85%
CHILD HEALTH STATUS REPORT 11
% Incomplete Records% No Records
% Exempt% Complete
20
40
60
80
100
District 7District 6District 5District 4District 3District 2District 1Idaho
0
Kindergarten Immunization Rates By Type, as Percentage of Enrollment
10
Idaho HD 1 HD 2 HD 3 HD 4 HD 5 HD 6 HD 7
DTaP complete 87.7 % 79.0% 84.0% 90.5% 90.8% 83.0% 89.8% 88.2%
DTaP missing 6.8% 9.4% 9.6% 4.6% 5.1% 11.0% 6.1% 6.6%
DTaP exempt 4.1% 8.1% 5.7% 4.2% 3.5% 3.4% 2.4% 3.7%
DTaP no record 1.4% 3.5% 0.7% 0.6% 0.6% 2.6% 1.6% 1.5%
Polio complete 93.1% 86.4% 91.7% 94.5% 95.2% 89.7% 94.7% 94.2%
Polio missing 1.8% 2.3% 1.8% 0.8% 1.1% 4.6% 1.7% 1.4%
Polio exempt 3.7% 7.7% 5.7% 4.0% 3.1% 3.1% 2.0% 3.0%
Polio no record 1.4% 3.5% 0.7% 0.6% 0.6% 2.6% 1.6% 1.5%
MMR complete 87.7% 78.5% 83.6% 91.0% 91.1% 82.2% 89.1% 88.6%
MMR missing 6.7% 9.6% 9.3% 4.1% 4.7% 11.7% 6.9% 6.3%
MMR exempt 4.2% 8.4% 6.3% 4.3% 3.6% 3.5% 2.3% 3.7%
MMR no record 1.4% 3.5% 0.7% 0.6% 0.6% 2.6% 1.6% 1.5%
Hep B complete 93.0% 85.8% 91.8% 94.5% 94.8% 90.1% 95.2% 94.0%
Hep B missing 1.8% 2.8% 1.6% 0.9% 1.5% 4.3% 1.1% 1.5%
Hep B exempt 3.7% 7. 8% 5.8% 3.9% 3.1% 3.0% 2.1% 3.0%
Hep B no record 1.4% 3.5% 0.7% 0.6% 0.6% 2.6% 1.6% 1.5%
12 IDAHO KIDS COUNT
% No Record% Exempt
% Missing% Complete
0
20
40
60
80
100
District 7 District 6 District 5 District 4 District 3 District 2 District 1Idaho
% No Record% Exempt
% Missing% Complete
0
20
40
60
80
100
District 7 District 6 District 5 District 4 District 3 District 2 District 1Idaho
CHILD HEALTH STATUS REPORT 13
% No Record% Exempt
% Missing% Complete
0
20
40
60
80
100
District 7 District 6 District 5 District 4 District 3 District 2 District 1Idaho
% No Record% Exempt
% Missing% Complete
0
20
40
60
80
100
District 7 District 6 District 5 District 4 District 3 District 2 District 1Idaho
14 IDAHO KIDS COUNT
Immunizations: First Grade
First Grade Immunization Rates Overall
10
Idaho HD 1 HD 2 HD 3 HD 4 HD 5 HD 6 HD 7
% Complete 90.6% 83.8% 82.5% 93.4% 92.9% 87.7% 92.1% 91.7%
% Exempt 4.2% 8.9% 6.9% 3.4% 3.8% 2.9% 2.8% 3.8%
% Medical Exemption 0.3% 0.2% 0.3% 0.1% 0.4% 0.2% 0.4% 0.2%
% Religious Exemption 0.4% 0.6% 0.3% 0.8% 0.3% 0.3% 0.1% 0.2%
% Personal Exemption 3.6% 8.1% 6.4% 2.4% 3.2% 2.3% 2.2% 3.4%
% No Records 0.7% 0.9% 0.4% 0.4% 0.4% 2.0% 0.8% 0.4%
% Incomplete Records 4.5% 6.4% 10.1% 2.8% 2.9% 7.3% 4.3% 4.0%
% Incomplete Records% No Records
% Exempt% Complete
0
20
40
60
80
100
District 7 District 6 District 5 District 4 District 3 District 2 District 1Idaho
CHILD HEALTH STATUS REPORT 15
First Grade Immunization Rates By Type, as Percentage of Enrollment
10
Idaho HD 1 HD 2 HD 3 HD 4 HD 5 HD 6 HD 7
DTaP complete 92.1% 86.0% 86.4% 94.3% 94.3% 89.6% 93.6% 92.7%
DTaP missing 3.3% 5.0% 6.6% 2.0% 2.0% 5.8% 3.0% 3.2%
DTaP exempt 3.9% 8.0% 6.6% 3.3% 3.4% 2.7% 2.6% 3.7%
DTaP no record 0.7% 0.9% 0.4% 0.4% 0.4% 1.9% 0.8% 0.4%
Polio complete 94.8% 90.5% 91.7% 96.3% 96.0% 93.0% 95.6% 96.0%
Polio missing 1.0% 1.1% 1.8% 0.5% 0.7% 2.6% 1.1% 0.6%
Polio exempt 3.4% 7.4% 6.1% 2.8% 2.9% 2.5% 2.4% 3.0%
Polio no record 0.7% 0.9% 0.4% 0.4% 0.4% 1.9% 0.8% 0.4%
MMR complete 92.0% 85.3% 86.4% 94.3% 94.3% 89.7% 93.2% 92.8%
MMR missing 3.3% 5.2% 6.4% 2.1% 1.7% 5.7% 3.2% 3.2%
MMR exempt 4.0% 8.5% 6.7% 3.3% 3.6% 2.7% 2.7% 3.6%
MMR no record 0.7% 0.9% 0.4% 0.4% 0.4% 1.9% 0.8% 0.4%
Hep B complete 94.4% 89.5% 91.4% 96.0% 95.2% 93.1% 96.1% 95.8%
Hep B missing 1.3% 1.7% 1.9% 0.8% 1.2% 2.6% 0.7% 0.8%
Hep B exempt 3.5% 7.9% 6.4% 2.8% 3.1% 2.5% 2.4% 3.0%
Hep B no record 0.7% 0.9% 0.4% 0.4% 0.4% 1.9% 0.8% 0.4%
% No Record% Exempt
% Missing% Complete
20
40
60
80
100
District 7 District 6 District 5 District 4 District 3 District 2 District 1Idaho
0
16 IDAHO KIDS COUNT
% No Record% Exempt
% Missing% Complete
0
20
40
60
80
100
District 7 District 6 District 5 District 4 District 3 District 2 District 1Idaho
% No Record% Exempt
% Missing% Complete
0
20
40
60
80
100
District 7 District 6 District 5 District 4 District 3 District 2 District 1Idaho
CHILD HEALTH STATUS REPORT 17
% No Record% Exempt
% Missing% Complete
0
20
40
60
80
100
District 7 District 6 District 5 District 4 District 3 District 2 District 1Idaho
18 IDAHO KIDS COUNT
Immunizations: Seventh Grade
Seventh Grade Immunization Rates Overall
10
Idaho HD 1 HD 2 HD 3 HD 4 HD 5 HD 6 HD 7
% Complete 93.5% 89.9% 93.3% 92.5% 95.9% 89.9% 93.2% 96.3%
% Exempt 2.8% 4.8% 4.7% 3.0% 2.3% 2.3% 1.8% 2.2%
% Medical Exemption 0.1% 0.1% 0.1% 0.0% 0.1% 0.3% 0.1% 0.1%
% Religious Exemption 0.4% 0.5% 0.2% 1.2% 0.2% 0.3% 0.2% 0.1%
% Personal Exemption 2.2% 4.2% 4.4% 1.8% 1.9% 1.7% 1.5% 2.0%
% No Records 0.8% 1.5% 0.7% 0.4% 0.3% 2.1% 1.4% 0.4%
% Incomplete Records 2.9% 3.8% 1.4% 4.1% 1.5% 5.7% 3.6% 1.1%
% Incomplete Records% No Records
% Exempt% Complete
0
20
40
60
80
100
District 7 District 6 District 5 District 4 District 3 District 2 District 1Idaho
CHILD HEALTH STATUS REPORT 19
Seventh Grade Immunization Rates By Type, as Percentage of Enrollment
10
Idaho HD 1 HD 2 HD 3 HD 4 HD 5 HD 6 HD 7
DTaP complete 94.8% 91.9% 94.5% 94.6% 96.6% 92.0% 94.6% 97.0%
DTaP missing 1.7% 2.1% 0.6% 2.0% 1.1% 3.8% 2.2% 0.5%
DTaP exempt 2.6% 4.5% 4.3% 2.9% 2.1% 2.2% 1.8% 2.1%
DTaP no record 0.8% 1.5% 0.7% 0.4% 0.3% 2.1% 1.4% 0.4%
Polio complete 95.8% 92.4% 95.0% 96.2% 97.3% 93.1% 96.3% 97.4%
Polio missing 0.9% 1.6% 0.4% 0.4% 0.5% 2.8% 0.5% 0.2%
Polio exempt 2.5% 4.4% 3.9% 2.9% 2.0% 2.1% 1.8% 2.0%
Polio no record 0.8% 1.5% 0.7% 0.4% 0.3% 2.1% 1.4% 0.4%
MMR complete 95.2% 92.5% 94.7% 93.7% 97.1% 92.6% 96.2% 97.2%
MMR missing 1.5% 1.6% 0.8% 3.0% 0.7% 3.1% 0.7% 0.5%
MMR exempt 2.5% 4.3% 3.9% 2.8% 2.0% 2.2% 1.7% 1.9%
MMR no record 0.8% 1.5% 0.7% 0.4% 0.3% 2.1% 1.4% 0.4%
Hep B complete 95.2% 91.2% 94.2% 95.7% 97.2% 92.0% 94.9% 97.2%
Hep B missing 1.4% 2.6% 1.0% 0.9% 0.6% 3.8% 1.8% 0.4%
Hep B exempt 2.6% 4.6% 4.2% 2.9% 2.0% 2.2% 1.8% 2.0%
Hep B no record 0.8% 1.5% 0.7% 0.4% 0.3% 2.0% 1.4% 0.4%
% No Record% Exempt
% Missing% Complete
0
20
40
60
80
100
District 7 District 6 District 5 District 4 District 3 District 2 District 1Idaho
20 IDAHO KIDS COUNT
% No Record% Exempt
% Missing% Complete
0
20
40
60
80
100
District 7 District 6 District 5 District 4 District 3 District 2 District 1Idaho
% No Record% Exempt
% Missing% Complete
District 7 District 6 District 5 District 4 District 3 District 2 District 1Idaho
0
20
40
60
80
100
CHILD HEALTH STATUS REPORT 21
% No Record% Exempt
% Missing% Complete
0
20
40
60
80
100
District 7 District 6 District 5 District 4 District 3 District 2 District 1Idaho
22 IDAHO KIDS COUNT
Health Insurance Coverage
Between 2000 and 2009, the percent of children in Idaho
without health insurance decreased signicantly from 16%
to 9%. e uninsurance rates of children in the United States
also decreased, from 12% to 10%.
11
Over the same ten year period, children receiving health in-
surance through a parent’s employer decreased from 54% to
46% in Idaho and from 58% to 49% in the United States.
Children with private health insurance (not associated with
an employer) increased in Idaho from 7% to 12%, but
remained at 5% in the United States. Children with only
public health insurance (Medicaid, CHIP, military, etc.) in-
creased in Idaho from 15% to 24% and in the United States
from 18% to 29%. Children with both public and private
insurance remained constant at 8% of Idaho children, and
increased slightly from 6% to 7% in the United States. e
overall trend over these years was an increase in insurance
coverage for children.
11
Children’s Medicaid and the Children’s Health Insurance
Program (CHIP) are both largely federally funded programs
that provide health insurance benets. CHIP premiums are
based on a sliding income scale. Children’s Medicaid does
not have premiums. Between 2000 and 2011 enrollment
in the Children’s Medicaid and CHIP programs has more
than doubled. In 2000, the number of Idaho children en-
rolled in Medicaid was 66,837. is increased to 140,773
in 2011. Over that period, CHIP enrollment also increased
from 7,203 to 24,226. Total enrollment in these programs
increased from 74,040 to 164,999.
12
Insurance coverage during pregnancy can mean access to pre-
natal care. Between 2007 and 2009, Idaho mothers who had
health insurance (Medicaid or other) increased from 95%
to 96.6%. e percent of Idaho mothers with health insur-
ance prior to pregnancy (excluding Medicaid) also increased
slightly during this time, from 62.7% to 64%. e overall
trend is a decrease in uninsured pregnant women from 5%
to 3.4%.
4
Idaho Medicaid Program Enrollment (CHIP/Medicaid)
12
2000 2001 2002 2003 2004 2005 2006 2007 2008 2009 2010 2011
Total 74040 93970 103763 111610 118510 122465 121979 132791 135043 141059 152772 164999
Medicaid 66837 82674 91595 100789 106623 109152 107439 1138 4 4 108093 115673 128152 140773
CHIP 7203 11296 12168 10821 11887 13313 14540 18947 26950 25386 24620 24226
Children’s Insurance Coverage By Type
11
2000 2001 2002 2003 2004 2005 2006 2007 2008 2009
Both Public and Private
US 6% 6% 6% 6% 6% 6% 6% 6% 7% 7%
Idaho 8% 8% 8% 6% 6% 7% 7% 7% 7% 8%
Employer Only
Insurance
US 58% 57% 56% 55% 54% 53% 53% 52% 51% 49%
Idaho 54% 54% 52% 51% 51% 51% 53% 53% 52% 46%
Private: Individual,
Other
US 5% 5% 5% 6% 6% 6% 6% 5% 5% 5%
Idaho 7% 7% 7% 8% 9% 10% 9% 8% 10% 12%
Public Only: CHIP,
Medicaid, Miltary, etc.
US 18% 20% 21% 22% 23% 23% 24% 25% 27% 29%
Idaho 15% 17% 21% 22% 23% 22% 20% 21% 21% 24%
Uninsured
US 12% 12% 12% 11% 11% 11% 11% 11% 10% 10%
Idaho 16% 13% 13% 12% 11% 11% 12% 11% 10% 9%
CHILD HEALTH STATUS REPORT 23
Idaho Public InsuranceUS Public InsuranceIdaho Uninsured
0%
10%
20%
30%
40%
50%
200920082007200620052003200220012000
2004
CHIPMedicaidTotal
0
50,000
100,000
150,000
200,000
201120102009200820072006200520042003200220012000
24 IDAHO KIDS COUNT
Maternal Health Insurance
4
Year Idaho HD 1 HD 2 HD 3 HD 4 HD 5 HD 6 HD 7
Idaho mothers with
health insurance coverage
prior to pregnancy
(excluding Medicaid)
2007 62.7% 53.8% 66.4% 55.7% 72.5% 50.0% 61.1% 68.7%
2008 64.4% 56.6% 66.0% 57.7% 73.5% 55.4% 66.3% 66.3%
2009 64.0% 54.9% 69.9% 51.1% 73.5% 54.2% 69.1% 69.1%
Idaho mothers with Medicaid
coverage during pregnancy
2007 38.4% 40.8% 38.3% 41.3% 25.4% 46.4% 46.8% 43.6%
2008 38.6% 42.5% 38.3% 44.4% 24.1% 45.5% 42.1% 45.4%
2009 43.3% 48.9% 39.7% 50.7% 32.3% 48.8% 44.4% 45.6%
Idaho mothers insured prior
to and/or during pregnancy
(Medicaid or other)
2007 95.0% 93.3% 96.1% 91.6% 97.7% 93.2% 95.0% 96.4%
2008 95.5% 95.9% 95.6% 95.7% 95.4% 94.0% 97.3% 95.0%
2009 96.6% 94.6% 97.7% 94.3% 97.7% 95.4% 97.7% 97.9%
Idaho mothers uninsured prior
to and/or during pregnancy
2007 5.0% 6.7% 3.9% 8.4% 2.3% 6.8% 5.0% 3.6%
2008 4.5% 4.1% 4.4% 4.3% 4.6% 6.0% 2.7% 5.0%
2009 3.4% 5.5% 2.3% 5.7% 2.3% 4.6% 2.3% 2.1%
200920082007
HD 7HD 6HD 5HD 4HD 3HD 2HD 1Idaho
0%
10%
20%
30%
40%
50%
60%
70%
80%
90%
100%
CHILD HEALTH STATUS REPORT 25
200920082007
HD 7HD 6HD 5HD 4HD 3HD 2HD 1Idaho
0%
10%
20%
30%
40%
50%
60%
70%
80%
90%
100%
200920082007
10%
30%
50%
70%
90%
0%
20%
40%
60%
80%
100%
HD 7HD 6HD 5HD 4HD 3HD 2HD 1Idaho