Tài liệu Báo cáo khoa học: The intracellular region of the Notch ligand Jagged-1 gains partial structure upon binding to synthetic membranes docx
Bạn đang xem bản rút gọn của tài liệu. Xem và tải ngay bản đầy đủ của tài liệu tại đây (2.01 MB, 12 trang )
The intracellular region of the Notch ligand Jagged-1 gains
partial structure upon binding to synthetic membranes
Matija Popovic, Alfredo De Biasio, Alessandro Pintar and Sa
´
ndor Pongor
Protein Structure and Bioinformatics Group, International Centre for Genetic Engineering and Biotechnology (ICGEB), Padriciano,
Trieste, Italy
Ligands to Notch receptors [1,2] are type I membrane
spanning proteins, all sharing a poorly characterized
N-terminal region and a Delta ⁄ Serrate ⁄ Lag-2 domain,
which are required for receptor binding, a series of
tandem epidermal growth factor-like repeats, a trans-
membrane segment, and a unique cytoplasmic tail of
100–200 amino acids [3]. Five different ligands to
Notch receptors have been identified in mammals,
three orthologs (Delta-1, -3 and -4) of Drosophila
Delta and two orthologs (Jagged-1 and -2) of Droso-
phila Serrate. Although the molecular mechanisms of
ligand specificity are still unclear, evidence from in vivo
studies suggests that each ligand exerts nonredundant
effects. Gene knock-out of Jagged-1 [4] or Delta-1 [5],
heterozygous deletion of Delta-4 [6] or homozygous
mutants in Jagged-2 [7] all lead to severe developmen-
tal defects and embryonic lethality in mice. There is
no significant sequence similarity shared among the
Keywords
membrane ⁄ cytoplasm interface; regulated
intramembrane proteolysis; SDS micelles;
phospholipid vesicles; in-cell NMR
Correspondence
A. Pintar and S. Pongor, Protein Structure
and Bioinformatics Group, International
Centre for Genetic Engineering and
Biotechnology (ICGEB), AREA Science Park,
Padriciano 99, I-34012 Trieste, Italy
Fax: +39 040226555
Tel: +39 0403757354
E-mail: ,
(Received 15 June 2007, revised 8 August
2007, accepted 20 August 2007)
doi:10.1111/j.1742-4658.2007.06053.x
Notch ligands are membrane-spanning proteins made of a large extracellu-
lar region, a transmembrane segment, and a 100–200 residue cytoplasmic
tail. The intracellular region of Jagged-1, one of the five ligands to Notch
receptors in man, mediates protein–protein interactions through the C-ter-
minal PDZ binding motif, is involved in receptor ⁄ ligand endocytosis trig-
gered by mono-ubiquitination, and, as a consequence of regulated
intramembrane proteolysis, can be released into the cytosol as a signaling
fragment. The intracellular region of Jagged-1 may then exist in at least
two forms: as a membrane-tethered protein located at the interface between
the membrane and the cytoplasm, and as a soluble nucleocytoplasmic pro-
tein. Here, we report the characterization, in different environments, of a
recombinant protein corresponding to the human Jagged-1 intracellular
region (J1_tmic). In solution, J1_tmic behaves as an intrinsically disordered
protein, but displays a significant helical propensity. In the presence of
SDS micelles and phospholipid vesicles, used to mimick the interface
between the plasma membrane and the cytosol, J1_tmic undergoes a sub-
stantial conformational change. We show that the interaction of J1_tmic
with SDS micelles drives partial helix formation, as measured by circular
dichroism, and that the helical content depends on pH in a reversible man-
ner. An increase in the helical content is observed also in the presence of
vesicles made of negatively charged, but not zwitterionic, phospholipids.
We propose that this partial folding may have implications in the interac-
tions of J1_tmic with its binding partners, as well as in its post-transla-
tional modifications.
Abbreviations
DMPC, 1,2-dimyristoyl-sn-glycero-3-phosphocholine; DMPG, 1,2-dimyristoyl-sn-glycero-3-[phospho-rac-(1-glycerol)] sodium salt; DMPS,
1,2-dimyristoyl-sn-glycero-3-[phospho-
L-serine] sodium salt; DSS, 2,2-dimethyl-2-silapentane-5-sulfonate-d
6
sodium salt; HSQC, heteronuclear
single quantum correlation; MRE, mean residue ellipticity; nrmsd, normalized root mean squared deviation of the fit; PDZ, domain present in
PSD-95, Dlg, and ZO-1 ⁄ 2; RIP, regulated intramembrane proteolysis; TFE, 2,2,2-trifluoroethanol.
FEBS Journal 274 (2007) 5325–5336 ª 2007 The Authors Journal compilation ª 2007 FEBS 5325
intracellular region of the different ligands, apart from
the identical PDZ binding motif (ATEV) found at the
C-terminus of Delta-1 and Delta-4. The cytoplasmic
tail of Jagged-1 (Fig. 1) contains a different C-terminal
PDZ interacting motif (EYIV), whereas neither Delta-
3 nor Jagged-2 present a PDZ recognition motif.
Jagged-1 has indeed been shown to interact in a PDZ-
dependent manner [8] with afadin, a protein located at
cell–cell adherens junctions. The cytoplasmic tail of
Notch ligands is also required for endocytosis [9].
Mind bomb 1 (Mib1) has been recently suggested to
be the E3 ubiquitin ligase responsible for mono-ubiqui-
tinylation of Jagged-1 in mice [10]. Finally, there is
compelling evidence that Notch ligands, much like
Notch receptors, undergo a proteolytic processing that
is mediated by ADAM proteases and by the preseni-
lin ⁄ c-secretase complex [11]. A membrane-tethered
C-terminal fragment of Jagged-1 comprising part of
the transmembrane segment and the intracellular
region expressed in COS cells was shown to localize
mainly in the nucleus, and to activate gene expression
through the transcription factor activator protein 1
(AP1 ⁄ p39 ⁄ jun) enhancer element [12].
The intracellular region of Jagged-1 can then exist in
at least two distinct forms that experience two different
environments. The first is a membrane-tethered protein
located at the interface between the membrane and the
cytoplasm, and the second is a soluble nucleocytoplas-
mic protein. We expressed and purified a recombinant
protein starting at the putative intramembrane cleav-
age site and comprising part of the transmembrane
segment and the entire intracellular region of human
Jagged-1 (J1_tmic) (Fig. 1), and studied its conforma-
tional properties in aqueous solution in the presence of
a secondary structure promoting cosolvent like TFE
and, to mimick the interface with the cell membrane,
in the presence of SDS micelles or phospholipid vesi-
cles. We show that J1_tmic is mainly disordered in
solution, but partially gains structure upon binding to
the negatively charged surface of SDS micelles or to
negatively charged phospholipid vesicles, with an
increase in its a-helical content. The transition between
different environments, the membrane–cytosol inter-
face and the cytoplasm, may affect the conformational
properties of many receptor cytoplasmic tails that
undergo regulated intramembrane proteolysis (RIP)
mediated by presenilin ⁄ c-secretase.
Results
J1_tmic is mainly unstructured in solution
The presence of secondary structure in J1_tmic was
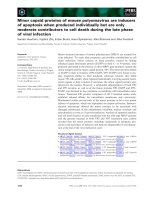
investigated by CD spectroscopy. The far-UV CD
spectrum of J1_tmic (Fig. 2) in Tris buffer shows a
strong minimum at 198 nm, which is typical of disor-
dered proteins. The content of secondary structure was
estimated through deconvolution of the CD spectrum
in the range 190–240 nm using several methods [13].
The best fit between the experimental and calculated
spectra was obtained with CDSSTR (nrmsd ¼ 0.013),
including spectra of unfolded proteins [14] in the refer-
ence set. The results show a high content of unordered
structure (65%) and a poor residual presence of
secondary structure (4% helix, 19% strand and 12%
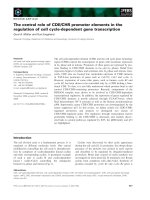
Fig. 1. Secondary structure predictions. Amino acid sequence of J1_tmic and secondary structure predictions (h, helix; e, b-strand; c, coil)
obtained running PSIPRED, JNET and SSpro from the PHYRE web server ( The consensus secondary structure
and the score are also shown; segments with high score are highlighted in gray. Histidine residues are underlined, tryptophans are in italics,
and the C-terminal PDZ binding motif is in bold.
Fig. 2. Circular dichroism. Far-UV CD spectra of J1_tmic (7.5 lM)in
5m
M Tris ⁄ HCl buffer, pH 7.4, in the presence of different concen-
trations of 2,2,2-trifluoroethanol (TFE) (%, v ⁄ v).
RIPping Jagged-1 cytoplasmic region M. Popovic et al.
5326 FEBS Journal 274 (2007) 5325–5336 ª 2007 The Authors Journal compilation ª 2007 FEBS
turns) (supplementary Table S1). Very similar results
were obtained from the CD spectrum of J1_tmic puri-
fied in native conditions, confirming that the purifica-
tion process did not affect the intrinsic conformation
of J1_tmic (data not shown).
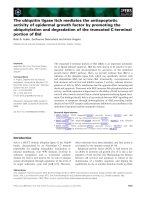
NMR results support these findings (Fig. 3A,B). In
the
1
H-
15
N HSQC spectrum of the
15
N-labeled protein,
only 90 backbone HN cross-peaks of the expected
125 are detectable ( 70%), most of them clustered
in a narrow region of between 7.7 and 8.4 p.p.m.
(Fig. 3B) and many resonances suffer from extensive
line broadening. The average value of HN chemical
shifts is 8.08 p.p.m. with a dispersion (r)of
0.22 p.p.m. For comparison, the random coil values
for a protein of the same amino acid composition
would have an average of 8.18 p.p.m and a dispersion
of 0.16 p.p.m. (supplementary Figure S1). The lack of
chemical shift dispersion in the HN region as well as
in the methyl region (data not shown) is an indicator
of the lack of globular structure, and of little, if any,
secondary structure [15]. The presence of strong and
sharp resonances accompanied by much weaker peaks
in the
1
H-
15
N HSQC spectrum, and the few peaks that
could be identified in the HN-Ha region of the
1
H-
15
N
heteronuclear single quantum correlation ⁄ total corre-
lated spectroscopy (HSQC-TOCSY) spectrum (data
not shown) also point to the presence of conforma-
tional exchange processes. The lack of chemical shift
dispersion in the HSQC spectrum obtained from in-cell
NMR experiments (Fig. 3A and supplementary
Figure S2) is a further confirmation of the lack of
globular structure, even in the molecular crowding
conditions of a cell-like environment [16].
To better characterize the conformation of J1_tmic
in solution, we studied its hydrodynamic properties
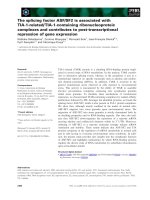
through size exclusion chromatography. J1_tmic
(15.5 kDa) is eluted from the size-exclusion column as
a peak corresponding to a 25.6 kDa globular protein
(Fig. 4). The sharpness and symmetry of the peak
(Supplementary Figure S3) indicates the presence of a
single, well-defined species. The calculated Stokes
radius, R
S,
for an apparent mass (m) of 25.6 kDa is
23.57 ± 0.35 A
˚
. This is slightly larger than the calcu-
lated value (R
S
N ¼ 19.6 ± 0.3 A
˚
) for a globular pro-
tein with the same number of residues as J1_tmic but
considerably smaller than the expected value for a
completely extended chain (R
S
U ¼ 36.4 ± 0.7 A
˚
)as
can be measured in denaturing conditions [17].
Fig. 3. NMR spectroscopy.
1
H-
15
N HSQC spectra of J1_tmic (A)
from in-cell experiments, (B) of the purified protein (0.5 m
M)in
H
2
O ⁄ D
2
O (90 ⁄ 10, v ⁄ v), pH 7.0, (C) in the presence of SDS
(50 m
M), pH 7.0, and (D) in the presence of SDS (50 mM), pH 5.6.
M. Popovic et al. RIPping Jagged-1 cytoplasmic region
FEBS Journal 274 (2007) 5325–5336 ª 2007 The Authors Journal compilation ª 2007 FEBS 5327
Our structural data on J1_tmic collected by CD, size
exclusion chromatography and NMR are consistent
with a mainly disordered, but rather compact, state of
the protein in solution, and the presence of very little
or no secondary structure.
J1_tmic exhibits intrinsic helical propensity
J1_tmic is predicted to adopt some secondary struc-
ture, as determined by subjecting the protein sequence
to the analysis of different secondary structure predic-
tors (PSIPRED [18], JNet [19], SSpro [20]) run from
the PHYRE web server ().
From the consensus secondary structure prediction,
four stretches of helix displaying a relatively high con-
fidence can be identified (Fig. 1). These predictions led
us to speculate that the J1_tmic secondary structure
might be stabilized in specific conditions. To test this
possibility, we first analyzed the secondary structure of
J1_tmic in the presence of different concentrations of
trifluoroethanol (TFE). Starting from a random-coil
conformation in aqueous solution, a significant change
in the secondary structure was observed upon addition
of increasing amounts of TFE. The CD spectra devel-
oped a strong ellipticity at 206 nm and a shoulder at
222 nm, characteristic of an a-helical structure, at the
expense of the minimum at 198 nm, showing that TFE
induces an a-helical conformational in J1_tmic
(Fig. 2). The J1_tmic helical content increases from
4% to 50% upon TFE addition (0–50%, v ⁄ v), with a
drastic change in ellipticity between 10 and 25% TFE.
These results confirm that J1_tmic possesses intrinsic
helical propensity, and the measured a-helical content
is consistent with the predicted one (23–35% for the
consensus prediction, depending on the threshold set
for the probability score).
J1_tmic binds to SDS micelles and phospholipid
vesicles
Binding of J1_tmic to SDS micelles and phospholipid
vesicles was monitored by tryptophan emission fluores-
cence spectroscopy and fluorescence anisotropy, taking
advantage of the two tryptophans present in the
sequence. At increasing SDS concentrations, an
increase from 0.07 to 0.12 in anisotropy was observed
(Fig. 5A). At submillimolar concentrations (50–100 lm
SDS) abnormally high anisotropy values were observed
(data not shown), probably due to scattering associ-
ated with solution turbidity, which, however, dis-
appeared at higher SDS concentrations. Tryptophan
fluorescence emission spectra showed an increase in
intensity and a blue-shift of the maximum from 355 to
350 nm in the presence of SDS (Fig. 5). In the pres-
ence of 1,2-dimyristoyl-sn-glycero-3-[phospho-rac-(1-
glycerol)] sodium salt (DMPG) phospholipid vesicles,
changes were even more evident, with a marked
increase in the emission intensity and a blue-shift from
355 to 345 nm (Fig. 5). Altogether, fluorescence data
confirm binding of J1_tmic to SDS micelles and
DMPG phospholipid vesicles, with at least partial
embedding of one or both the tryptophan residues in a
more hydrophobic environment [21,22].
As J1_tmic contains two tryptophans, W1091 in the
N-terminal transmembrane region and W1196 in the
C-terminal region, similar experiments were repeated
on a recombinant protein, J1_ic [23], that lacks the
transmembrane segment and thus contains only
W1196. In this case as well, we could observe an
increase in the anisotropy and a shift in the maximum
from 356 to 346 nm upon addition of SDS (final con-
centration: 3 mm) but the shift was accompanied by a
decrease, rather than an increase, in the fluorescence
intensity (supplementary Figure S4). In the presence of
DMPG phospholipid vesicles, the blue-shift was
accompanied by an increase in the emission intensity,
as measured with J1_tmic, and a blue-shift from 356
to 345 nm. Although these results are not conclusive
with respect to the determination of the precise envi-
ronment of the two tryptophans, they show that both
J1_tmic and J1_ic bind to SDS micelles and DMPG
Fig. 4. Size-exclusion chromatography. Calibration standards are
shown as open circles (1, horse myoglobin (17 kDa); 2, carbonic
anhydrase (29 kDa); 3, bovine serum albumin (67 kDa); 4, lactate
dehydrogenase (147 kDa)), J1_tmic as a filled square (apparent
m ¼ 25.6 kDa); the calibration curve is also shown.
RIPping Jagged-1 cytoplasmic region M. Popovic et al.
5328 FEBS Journal 274 (2007) 5325–5336 ª 2007 The Authors Journal compilation ª 2007 FEBS
phospholipid vesicles, and thus that the transmem-
brane region of J1_tmic is not absolutely required for
binding. The reduced W1196 fluorescence emission in
the presence of SDS micelles can be explained by the
quenching effect of the negatively charged sulfate
groups of SDS.
J1_tmic gains helical structure upon binding to
SDS micelles
The secondary structure of J1_tmic in the presence of
SDS micelles, which provide a model for the hydro-
phobic ⁄ hydrophilic interface found in lipid mem-
branes, was analyzed by CD. As already seen with
TFE, at increasing concentrations of SDS J1_tmic
undergoes a significant conformational change towards
an a-helical structure, reaching a maximum of 17%
of a-helix at saturation (3 mm SDS), as estimated from
CDSSTR (Fig. 6). At the same SDS concentration
(3 mm), the a-helical content reversibly increases as the
pH decreases (17% of a-helix at pH 7.4 versus 33% at
pH 6) (Supplementary Figure S5, Supplementary
Table S1), whereas the same pH change does not
induce any significant change in the a-helical content
in the protein in the absence of SDS (Fig. 6, Supple-
mentary Table S1).
The conformation of J1_tmic in the presence of SDS
was further analyzed by NMR spectroscopy. The
1
H-
15
N HSQC spectrum of J1_tmic obtained in the
presence of SDS micelles is somewhat different from
that of the protein alone (Fig. 3C-D). Although several
resonances are still missing, probably due to overlap,
HN cross-peaks appear to be of similar intensity and
slightly better dispersed. Most HN backbone reso-
nances are still clustered in a relatively narrow region
(7.5–8.5 p.p.m.), but the average value of HN chemical
shifts (7.97 p.p.m.) is smaller and the dispersion
slightly larger (r ¼ 0.25) compared to the values
obtained for the protein alone (Supplementary Fig-
ure S1). Most of the expected cross-peaks in the Ha
region of the
1
H-
15
N HSQC-TOCSY spectrum are still
missing (data not shown). The lack of significant
chemical shift dispersion in the HN and Ha chemical
shifts is an evidence of lack of tertiary structure. On
the other hand, NMR spectra suggest that the confor-
mation of J1_tmic is at least partially restrained in the
Fig. 6. Circular dichroism in the presence of SDS. Far-UV CD spec-
tra of J1_tmic (7.5 l
M)in5mM Tris ⁄ HCl buffer, at different pH val-
ues (7.4 and 6.0) in buffer alone and in the presence of SDS
(3 m
M).
Fig. 5. Fluorescence spectroscopy. (A) Tryptophan fluorescence
anisotropy and emission intensity of J1_tmic (7.5 l
M)in5mM
Tris ⁄ HCl buffer, pH 7.4, in the presence of increasing concentra-
tions of SDS. (B) Tryptophan fluorescence emission spectra of
J1_tmic (7.5 l
M)in5mM Tris ⁄ HCl buffer, pH 7.4, in the presence
of SDS (3 m
M), and in the presence of DMPG (1 m M) phospholipid
vesicles; excitation wavelength was set to 295 nm.
M. Popovic et al. RIPping Jagged-1 cytoplasmic region
FEBS Journal 274 (2007) 5325–5336 ª 2007 The Authors Journal compilation ª 2007 FEBS 5329
presence of SDS micelles. At a lower pH, the appear-
ance of both the HSQC and the
1
H-
15
N HSQC-
TOCSY spectrum is markedly different. Most of the
expected HN cross-peaks (93%) and of the Ha peaks
could be detected, and lines are much narrower than
at pH 7. The average chemical shift of backbone
amides is 8.04 p.p.m. and the dispersion 0.23 p.p.m.
Also in these conditions, however, the lack of chemical
shift dispersion points to the absence of tertiary struc-
ture.
J1_tmic gains helical structure upon binding to
negatively charged phospholipid vesicles
As a model of biological membranes we also used vesi-
cles prepared from various phospholipids that are typi-
cal components of eukaryotic cell membranes. The
far-UV CD of J1_tmic in the presence of vesicles pre-
pared from the negatively charged phospholipids
DMPG (Fig. 7) or dimyristoylphosphatidylserine
(DMPS) (Fig. 8) showed spectral variations similar to
those obtained in the presence of SDS micelles
(Fig. 6). The estimated a-helical content was 19% and
17% in the presence of DMPG and DMPS vesicles,
respectively (lipid concentration: 1 mm; protein ⁄ lipid
molar ratio ¼ 1 : 130). On the contrary, no change
could be detected in the presence of vesicles made of
the zwitterionic phospholipid dimyristoylphosphatidyl-
choline (DMPC) (Fig. 8). In the presence of DMPG
phospholipid vesicles, a decrease in pH from 7.4 to 6.0
led to a reversible increase in the helical content of
J1_tmic from 19 to 36% (Fig. 7, supplementary
Figure S8, supplementary Table S1).
Discussion
The rationale of this work is based on recent evidence
suggesting that the intracellular region of Jagged-1
exists in at least two distinct forms [12]. The first is a
membrane-tethered protein experiencing the interface
between the membrane and the cytoplasm, the second
is a soluble nucleocytoplasmic protein, and is produced
by intramembrane proteolytic cleavage by the preseni-
lin ⁄ c-secretase complex [12]. Although the precise
cleavage site in Jagged-1 is not known, experimental
evidence from the cleavage of Notch receptors suggests
that it is placed at the first valine close to the inner
side of the cytoplasm [24]. We thus expressed and puri-
fied a recombinant protein starting at the putative
intramembrane cleavage site and comprising part of
the transmembrane segment and the entire intracellular
region of human Jagged-1 (J1_tmic), and studied its
conformational properties in different conditions. SDS
micelles and phospholipid vesicles were used to mimick
the membrane ⁄ cytoplasm interface, whereas standard
buffers were used to simulate the conditions experi-
enced by the cleaved form. Additionally, we used in-
cell NMR to reproduce the molecular crowding effects
of a cell-like environment. Finally, TFE was used to
investigate the intrinsic secondary structure propensity
in conditions of reduced solvation.
In the presence of SDS micelles (Fig. 6) or vesicles
made of negatively charged phospholipids (DMPG,
DMPS) (Figs 7 and 8), which are prevalent compo-
nents of the inner layer of the plasma membrane in
eukaryotes, J1_tmic gains secondary structure. The
Fig. 8. Circular dichroism in the presence of phospholipid vesicles.
Far-UV CD spectra of J1_tmic (7.5 l
M)in5mM Tris ⁄ HCl buffer,
pH 7.4, in the presence of DMPS, DMPG, or DMPC phospholipid
vesicles.
Fig. 7. Circular dichroism in the presence of DMPG. Far-UV CD
spectra of J1_tmic (7.5 l
M)in5mM Tris ⁄ HCl and in the presence
of DMPG (1 m
M) phospholipid vesicles at pH 7.4 and pH 6.0.
RIPping Jagged-1 cytoplasmic region M. Popovic et al.
5330 FEBS Journal 274 (2007) 5325–5336 ª 2007 The Authors Journal compilation ª 2007 FEBS
helical content measured by CD is consistent with sec-
ondary structure predictions (Fig. 1). No changes in
CD spectra were observed in the presence of vesicles
formed by a zwitterionic phospholipid like DMPC
(Fig. 8), suggesting that the negative charge density at
the surface of SDS micelles or phospholipid vesicles is
required to promote binding and secondary structure
formation. Interestingly, in the presence of SDS
micelles, the formation of secondary structure is
strongly pH-dependent, with a sharp increase in the
helical content from pH 7to 6. As J1_tmic con-
tains six endogenous histidines, it is possible that pro-
tonation of one or more of the histidines is promoting
helix formation or extension. A similar behavior was
observed also in the presence of DMPG phospholipid
vesicles (Fig. 7). The possible biological relevance of
this observation is not clear. The biophysical proper-
ties of the interface between the cytoplasm and the
plasma membrane are not very well known [25], and it
is plausible that the negatively charged head groups of
phospholipids present in the membrane of eukaryotic
cells can generate a pH gradient [26]. From pH map-
ping by fluorescence, it has been actually reported in
an early study that the effective pH in proximity of the
membrane in yeast cells is 6.0 [27], which supports
the physiological relevance of the pH-dependent sec-
ondary structure formation in J1_tmic.
The titration with SDS revealed that SDS triggers
binding below its critical micellar concentration (2–
8mm, depending on ionic strength), with a saturated
binding around 1 mm for 7.5 lm J1_tmic, suggesting
that J1_tmic can drive the formation of SDS micelles
while binding on their surface. This effect is not unu-
sual, as it has already been observed with a-synuclein,
another membrane-interacting protein [28].
It may be argued that the conformational changes
observed are induced by the hydrophobic interaction of
SDS or phospholipid vesicles with J1_tmic, rather than
by the charged surface of micelles or vesicles. It can be
remarked, however, that the fatty acid chains in SDS
and in the phospholipids used are similar, if not identi-
cal. If the conformational change is induced by hydro-
phobic interactions, similar effects should be observed.
On the contrary, CD spectra display distinct features,
depending on the conditions. Most significantly, differ-
ent types of phospholipids, depending on the charge of
the polar head, have different effects. Moreover, hydro-
phobic interactions are expected to be rather insensitive
to pH changes. On the contrary, in the presence of SDS
micelles and DMPG phospholipid vesicles, the helical
content of J1_tmic is markedly dependent on pH, sug-
gesting that the conformational change is driven by
polar, rather than hydrophobic interactions.
The partial folding of the cytoplasmic domain of
Jagged-1 accompanied by its association with the inner
side of the cell membrane may have relevant effects on
the function of Jagged-1 in Notch signaling [8,10,12].
For instance, it may selectively mask certain residues
that are potential targets for post-translational modifi-
cations such as phosphorylation, ubiquitination, or
O-glycosylation by b-N-acetylglucosamine [29,30] while
leaving others exposed for the same modifications. In a
similar way, it may mask or expose selected binding
motifs with respect to binding partners. The partial
folding and association of the intracellular region of
Jagged-1 with the membrane is also expected to reduce
its ’capture radius’ [31] towards protein targets like
PDZ-containing proteins. Despite the high number of
single pass membrane proteins involved in signaling,
little is known about the structure and function of
their cytoplasmic tails and, to our knowledge, only few
examples have been reported [32,33]. The cytoplasmic
tail of the T-cell receptor f-chain [34,35] binds to lipid
membranes through a lipid-induced coil–helix transi-
tion dependent on phosphorylation [33]. Other cyto-
plasmic domains related to multichain immune
recognition receptors were found to be intrinsically dis-
ordered even when bound to lipids [36]. A role of the
cytoplasmic tail of membrane-spanning proteins in
protein–protein interactions has also been proved, e.g.
the case of the association between the N-terminal
region of the membrane-bound tyrosine kinase Lck
with the cytoplasmic tail of the T-cell coreceptors CD4
or CD8 [37].
In solution, on the contrary, J1_tmic is mainly dis-
ordered (Figs 2 and 3). The strongly hydrophobic seg-
ment (VTAFYWAL) that is expected to be embedded
in the membrane and to become exposed to the
solvent upon cleavage of Jagged-1 is not sufficient to
promote folding of J1_tmic in solution. Intrinsic dis-
order in the cytoplasmic region of type I membrane
proteins that undergo regulated intramembrane prote-
olysis mediated by the presenilin ⁄ c-secretase complex
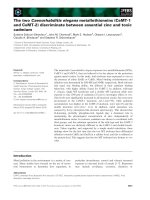
is probably not unique to Jagged-1. Intrinsic disorder
propensity based on the amino acid composition only
can be estimated from a plot of the protein mean net
charge versus mean hydrophobicity [38]. Such a
charge ⁄ hydrophobicity plot (Fig. 9) calculated for the
intracellular region of a series of human membrane
proteins that are cleaved by presenilin shows that
most of the RIP substrates, including Jagged-1, actu-
ally fall in the left-hand side of the plot (natively
unfolded proteins). All the proteins that clearly fall in
the right-hand side of the plot contain, along with
disordered stretches, structured domains (Supplemen-
tary Figure S9).
M. Popovic et al. RIPping Jagged-1 cytoplasmic region
FEBS Journal 274 (2007) 5325–5336 ª 2007 The Authors Journal compilation ª 2007 FEBS 5331
Nevertheless, TFE can induce helix formation in
J1_tmic (Fig. 2) in even a more effective way than
SDS micelles or phospholipid vesicles. The interaction
of TFE with hydrophobic moieties of the polypeptide
chain is supposed to be rather weak. Instead, TFE
promotes secondary structure formation by reducing
the protein backbone exposure to the aqueous solvent
and favoring the formation of intramolecular hydrogen
bonds [39]. Therefore, TFE stabilizes specific second-
ary structure elements in accordance with the intrinsic
conformational propensities of the polypeptide chain.
This is of particular significance in view of the fact
that most of the presenilin ⁄ c-secretase substrates con-
sidered in Fig. 9 release fragments that are translocat-
ed to the nucleus and are involved in transcriptional
regulation. This is the case also for Jagged-1, which
has been shown to activate gene expression through
the AP1 element [12]. Control of transcription by the
released signaling fragments probably does not occur
in a straightforward manner, but through the interac-
tion with transcription factors and transcriptional com-
plexes that have not been identified yet. In this
scenario, the intrinsic propensity to adopt a particular
type of secondary structure may facilitate folding when
binding to target proteins occurs.
The identification of post-translational modifications
that can play a role in the function and structure of
Jagged-1 cytoplasmic tail, as well as the identification
of binding partners at the membrane ⁄ cytoplasm inter-
face, in the cytosol, and in the nucleus, represent issues
that are worth further investigation.
Experimental procedures
Expression and purification
The DNA encoding J1_tmic (corresponding to residues
1086–1218 of JAG1_HUMAN) was amplified by PCR from
a template plasmid containing the codon-optimized syn-
thetic gene encoding the intracellular region of human Jag-
ged-1 (residues 1094–1218) [23]. The following forward and
reverse primers [Sigma-Genosys (Cambridge, UK), purified
by polyacrylamide gel electrophoresis] were used: 5¢-TAA
TAT TAG
CAT ATG GTG ACC GCT TTC TAT TGG
GCG CTG CGT AAA CGT CGT AAA CCG GGT AGC-
3¢ and 5¢-TAG TAG
GGA TCC TCA TTA AAC GAT
GTA TTC CAT ACG GTT CAG GCT-3¢. The forward
primer contains a NdeI restriction site (underlined) encod-
ing the start methionine and 8 residues belonging to the
putative transmembrane region (in italics). To avoid pos-
sible cross-linking, C1092 was mutated to alanine. The
reverse primer contains a BamHI restriction site (under-
lined) and a double stop codon (in bold). The PCR product
was purified, digested with NdeI and BamHI and direction-
ally cloned into a pET-11a vector (Novagen, Darmstadt,
Germany). DH5a E. coli cells were transformed, selected
on Luria–Bertani plates containing 100 lgÆmL
)1
ampicillin,
and the positive clones subjected to automatic DNA
sequencing. Correct clones were used to transform
BL21(DE3) E. coli (Novagen) cells for expression. Bacteria
were grown at 37 °C in Luria–Bertani medium containing
100 lgÆmL
)1
ampicillin to an optical density of 1 and
protein expression induced with isopropyl thio-b-d-galacto-
side (1 mm) for 3 h. Cells were harvested by centrifugation,
resuspended in the lysis buffer [20 mm sodium phosphate
buffer, 0.5 m NaCl, 50 mm CHAPS, 2% Tween 20, 1 mm
dl-dithiothreitol, 10 mm imidazole, 0.5 mm EDTA, pH 7.4,
containing one protease inhibitor cocktail tablet (Roche,
Mannheim, Germany)] and sonicated. After centrifugation,
Fig. 9. Intrinsic disorder. Mean net charge versus mean hydropho-
bicity calculated for the intracellular region of 37 human preseni-
lin ⁄ c-secretase substrates that undergo regulated intramembrane
proteolysis. Proteins that contain globular domains in the cytoplas-
mic tail are shown as filled circles. The line ideally separates
natively unfolded proteins (left-hand side of the plot) from natively
folded ones (right-hand side of the plot). A4, amyloid b A4 precur-
sor; APLP1 ⁄ 2, amyloid-like proteins 1 ⁄ 2; CADH1, E-cadherin;
CADH2, N-cadherin; CD44, CD44 antigen; CSF1R, colony stimulat-
ing factor 1 receptor; DCC, netrin receptor; DLL1 ⁄ 4, delta-like 1 ⁄ 4;
EFNB1 ⁄ 2, ephrin-B1 ⁄ 2; ERBB4, receptor protein tyrosine kinase
erbB4; GHR, growth hormone receptor; IGF1R, insulin-like growth
factor 1 receptor; IL1R2, interleukin 1 receptor II; JAG1, jagged-1;
JAG1TMIC, J1_tmic; JAG2, jagged-2; LEUK, leukosialin (CD43);
LRP, low-density lipoprotein receptor related proteins; NTC1-4,
Notch receptors 1–4; PCDG1, proto cadherin c A1; PVRL1, nectin-1;
SCN2B, sodium channel b2 subunit; SDC3, syndecan-3; SORL, sor-
tilin-related receptor; TNR16, tumor necrosis factor superfamily
member 16; TYRP, tyrosinase-related proteins; VGFR1, vascular
endothelial growth factor receptor 1.
RIPping Jagged-1 cytoplasmic region M. Popovic et al.
5332 FEBS Journal 274 (2007) 5325–5336 ª 2007 The Authors Journal compilation ª 2007 FEBS
the supernatant was loaded on a Ni
2+
Sepharose HisTrap
HP column (1 mL, GE Healthcare, Piscataway, NJ, USA),
the column washed with 20 mm sodium phosphate buffer,
0.5 m NaCl, 1 mmdl-dithiothreitol, 10 mm imidazole,
pH 7.4 and the protein eluted with a 10–500 mm imidazole
gradient. The crude material was purified by RP-HPLC on
a Zorbax 300SB-CN column (9.4 · 250 mm, 5 lm, Agilent
Technologies, Palo Alto, CA, USA) using a 0–50% gradi-
ent of 0.1% trifluoroacetic acid in H
2
O and 0.1% trifluoro-
acetic acid in acetonitrile, and freeze-dried. For preparation
of the
15
N-labeled protein, cells were grown in M9 minimal
medium (6 gÆL
)1
Na
2
HPO
4
,3gÆL
)1
KH
2
PO
4
, 0.5 gÆL
)1
NaCl, 0.12 gÆL
)1
MgSO
4
, 0.01 gÆL
)1
CaCl
2
, 0.5 gÆL
)1
15
NH
4
Cl, 5 gÆL
)1
d-glucose) supplemented with 1.7 gÆL
)1
Yeast Nitrogen Base without amino acids and ammonium
sulfate (Difco, Sparks, MD, USA) and containing
100 lgÆmL
)1
ampicillin. Expression and purification of the
labeled protein were carried out as described above. The
purified proteins were analyzed by liquid chromatography-
mass spectrometry to confirm their identity. The recombi-
nant protein lacking the transmembrane region, J1_ic, was
expressed and purified as described [23].
Size exclusion chromatography
The freeze-dried protein was dissolved in the elution buffer
(Tris ⁄ HCl 50 mm,100mm KCl, pH 7.4), loaded onto a Seph-
acryl S-200 column (GE Healthcare) and eluted in the same
elution buffer. The apparent molecular mass of J1_tmic was
deduced from a calibration carried out with the following
molecular standards: lactate dehydrogenase (147 kDa), bovine
serum albumin (67 kDa), carbonic anhydrase (29 kDa) and
horse myoglobin (17 kDa). Stokes radii of native (R
S
N) and
fully unfolded (R
S
U) proteins of known molecular mass (m)
were determined according to the equations: log(R
S
N) ¼
) (0.254 ± 0.002) + (0.369 ± 0.001) log(m), and log(R
S
U) ¼
) (0.543 ± 0.004) + (0.502 ± 0.001) log(m)[17].
Preparation of phospholipid vesicles
The synthetic phospholipids DMPG, DMPS or DMPC
(Avanti, Alabaster, AL, USA) were dissolved in
CHCl
3
⁄ CH
3
OH (2 : 1, v ⁄ v) in round-bottomed flasks and
the solvent evaporated to obtain a thin lipid film. After dry-
ing after vacuum to remove residual solvent, lipids were
hydrated in 5 mm Tris ⁄ HCl buffer, pH 7.4, to get a 10 mm
lipid suspension which was sonicated to clarity at 37 °Cin
a high intensity bath sonicator (Branson 3200, Branson
Sonic Power Co., Danbury, CT, USA).
Circular dichroism
Samples for CD spectroscopy were prepared dissolving the
freeze-dried protein in 5 mm Tris ⁄ HCl buffer, pH 7.4.
Protein concentration (7.5 lm) was determined by UV
absorbance at 280 nm using the calculated e-value of
16 500 m
)1
cm
)1
. CD spectra were recorded at 25 °Cor
37 °C on a Jasco J-810 spectropolarimeter (JASCO Interna-
tional Co., Tokyo, Japan) using jacketed quartz cuvettes
of 1 mm pathlength. Five scans were acquired for
each spectrum in the range 190–250 nm at a scan rate
of 20 nmÆmin
)1
. Mean residue ellipticity (deg
cm
2
Ædmol
)1
Æ residue
)1
) was calculated from the baseline-cor-
rected spectrum. A quantitative estimation of secondary
structure content was carried out using SELCON3, CON-
TINLL, and CDSSTR, all run from the DichroWeb server
(www.cryst.bbk.ac.uk/cdweb/html/home/html) [40]. Helical
content was also estimated from the mean residue ellipticity
at 222 nm according to the formula [a] ¼ ) 100Æmean resi-
due ellipticity
222
⁄ 40000 (1–2.57 ⁄ N), where N is the number
of peptide bonds.
Fluorescence spectroscopy
Samples prepared for CD were also used for fluorescence
spectroscopy. Spectra were recorded at 25 °Cor37°Cona
Jobin-Yvon FluoroMax-3 spectrofluorimeter (Jobin Yvon-
Horiba, Paris, France) equipped with a Peltier temperature
control apparatus using 1 · 0.2 cm pathlength quartz cu-
vettes. Excitation was set at 295 nm and spectra were
recorded between 300 and 450 nm. Fluorescence anisotropy
was measured at the maximum of emission using the same
excitation wavelength. All anisotropy measurements were
carried out at least five times. Measurements were corrected
for the background and averaged.
NMR spectroscopy
Protein samples for NMR spectroscopy were prepared dis-
solving the freeze-dried material in H
2
O ⁄ D
2
O (90 : 10, v ⁄ v)
and adjusting the pH to 7.0 with small aliquots of 0.1 n
NaOH, for a final protein concentration of 0.5 mm. The
sample containing SDS was prepared by dissolving solid
SDS sodium salt in the NMR sample, for a final SDS con-
centration of 50 mm. Additional spectra were recorded at
pH 5.5. Spectra were recorded at 303 K on a Bruker spec-
trometer (Bruker Biospin, Rheinstetten, Germany) operat-
ing at a
1
H frequency of 600.13 MHz and equipped with a
1
H ⁄
13
C ⁄
15
N triple resonance Z-axis gradient probe. Trans-
mitter frequencies in the
1
H and
15
N dimensions were set
on the water line and at 118.0 p.p.m., respectively. HSQC
and HSQC-TOCSY experiments were carried out in phase-
sensitive mode using echo ⁄ anti-echo-TPPI gradient selection
and
15
N decoupling during acquisition. HSQC spectra were
acquired with 1 K complex points, 256 t
1
experiments, 32
scans per increment, over a spectral width of 13 and
28 p.p.m. in the
1
H and
15
N dimensions, respectively.
HSQC-TOCSY spectra were acquired with the same
M. Popovic et al. RIPping Jagged-1 cytoplasmic region
FEBS Journal 274 (2007) 5325–5336 ª 2007 The Authors Journal compilation ª 2007 FEBS 5333
parameters, but with 128 scans per t
1
increment and a
40 ms DIPSI mixing time. Data were transformed using
X-WinNMR (Bruker) and analyzed using CARA (http://
www.nmr.ch).
1
H chemical shifts were referenced to inter-
nal DSS (8 lm).
For in-cell NMR experiments [41,42], 200 mL of E. coli
culture was grown in M9 medium containing
15
NH
4
Cl as
the only nitrogen source, as described above. The culture
was split; in one sample expression was induced with
isopropyl thio-b-d-galactoside, and the other was used as
control. Cells were centrifuged at 500 g in a Sorvall
RC5B centrifuge (Sorvall Instruments Inc., Newton, CT,
USA) using a GSA rotor. The supernatant was discarded,
and the pellet was gently resuspended in 50 mL of cold
NaCl ⁄ P
i
(10 gÆL
)1
NaCl, 0.25 gÆL
)1
KCl, 0.25 gÆL
)1
KH
2
PO
4
, 3.6 gÆL
)1
Na
2
HPO
4
Æ12H
2
O, pH 7.2). After an
additional centrifugation step, the pellet was gently resus-
pended in 500 lL NaCl ⁄ P
i
,D
2
O (55 lL) was added, and a
standard NMR tube was filled with the E. coli slurry. After
NMR analysis, the slurry was recovered from the NMR
tube, centrifuged for 2 min at 14 000 g in a Millipore
MC-13 microcentrifuge (Amicon Bioseparations Inc., Bev-
erly, MA, USA) and the clear supernatant subjected to fur-
ther NMR analysis. HSQC spectra on the induced sample,
on the control sample, and on the supernatant were
acquired in identical conditions at 303 K with 1 K complex
points, 128 t
1
experiments, 32 scans per increment, over a
spectral width of 13 and 26 p.p.m. in the
1
H and
15
N
dimensions, respectively, for a total experiment time of
1 h for each HSQC. A sample of freeze-dried, purified
protein dissolved in NaCl ⁄ P
i
was used to acquire a refer-
ence spectrum.
Intrinsic disorder
Disorder propensity was estimated from a plot of the mean
net charge (absolute value) versus the mean hydrophobicity
calculated using the normalized values of the Kyte & Doo-
little scale [38]. Presenilin ⁄ c-secretase substrates were taken
from the literature [43].
Acknowledgements
We thank Doriano Lamba (CNR-ELETTRA, Trieste,
Italy) for use of the CD spectropolarimeter. We are
grateful to Fabio Calogiuri (CERM, Sesto Fiorentino,
Italy) for technical assistance with the acquisition of
NMR spectra. We acknowledge the support of the EU
(European Network of Research Infrastructures for
Providing Access and Technological Advancements in
Bio-NMR) for access to the CERM NMR facility. We
also thank Corrado Guarnaccia (ICGEB) for help with
liquid chromatography-mass spectrometry analysis and
critical discussion, Mircea Pacurar (ICGEB) for
writing scripts used in disorder analysis, and Maristella
Coglievina (ICGEB) for useful suggestions. This work
is part of M. Popovic’s Ph.D. thesis.
References
1 Bray SJ (2006) Notch signalling: a simple pathway
becomes complex. Nat Rev Mol Cell Biol 7, 678–689.
2 Artavanis-Tsakonas S, Rand MD & Lake RJ (1999)
Notch signaling: cell fate control and signal integration
in development. Science 284, 770–776.
3 Letunic I, Copley RR, Schmidt S, Ciccarelli FD, Doer-
ks T, Schultz J, Ponting CP & Bork P (2004) SMART
4.0: towards genomic data integration. Nucleic Acids
Res 32, D142–D144.
4 Xue Y, Gao X, Lindsell CE, Norton CR, Chang B,
Hicks C, Gendron-Maguire M, Rand EB, Weinmaster
G & Gridley T (1999) Embryonic lethality and vascular
defects in mice lacking the Notch ligand Jagged1. Hum
Mol Genet 8, 723–730.
5 Hrabe de Angelis M, McIntyre J 2nd & Gossler A
(1997) Maintenance of somite borders in mice
requires the Delta homologue DII1. Nature 386, 717–
721.
6 Gale NW, Dominguez MG, Noguera I, Pan L, Hughes
V, Valenzuela DM, Murphy AJ, Adams NC, Lin HC,
Holash J, et al. (2004) Haploinsufficiency of delta-like 4
ligand results in embryonic lethality due to major
defects in arterial and vascular development. Proc Natl
Acad Sci USA 101, 15949–15954.
7 Jiang R, Lan Y, Chapman HD, Shawber C, Norton
CR, Serreze DV, Weinmaster G & Gridley T (1998)
Defects in limb, craniofacial, and thymic development
in Jagged2 mutant mice. Genes Dev 12, 1046–1057.
8 Ascano JM, Beverly LJ & Capobianco AJ (2003)
The C-terminal PDZ-ligand of JAGGED1 is essential
for cellular transformation. J Biol Chem 278, 8771–
8779.
9 Le Borgne R (2006) Regulation of Notch signalling by
endocytosis and endosomal sorting. Curr Opin Cell Biol
18, 213–222.
10 Koo BK, Lim HS, Song R, Yoon MJ, Yoon KJ, Moon
JS, Kim YW, Kwon MC, Yoo KW, Kong MP, et al.
(2005) Mind bomb 1 is essential for generating func-
tional Notch ligands to activate Notch. Development
132, 3459–3470.
11 Kadesch T (2004) Notch signaling: the demise of elegant
simplicity. Curr Opin Genet Dev 14, 506–512.
12 LaVoie MJ & Selkoe DJ (2003) The Notch ligands,
Jagged and Delta, are sequentially processed by alpha-
secretase and presenilin ⁄ gamma-secretase and release
signaling fragments. J Biol Chem 278, 34427–34437.
13 Sreerama N & Woody RW (2000) Estimation of protein
secondary structure from circular dichroism spectra:
RIPping Jagged-1 cytoplasmic region M. Popovic et al.
5334 FEBS Journal 274 (2007) 5325–5336 ª 2007 The Authors Journal compilation ª 2007 FEBS
comparison of CONTIN, SELCON, and CDSSTR
methods with an expanded reference set. Anal Biochem
287, 252–260.
14 Sreerama N, Venyaminov SY & Woody RW (2000)
Estimation of protein secondary structure from circular
dichroism spectra: inclusion of denatured proteins with
native proteins in the analysis. Anal Biochem 287, 243–
251.
15 Dyson HJ & Wright PE (2004) Unfolded proteins and
protein folding studied by NMR. Chem Rev 104, 3607–
3622.
16 Dedmon MM, Patel CN, Young GB & Pielak GJ
(2002) FlgM gains structure in living cells. Proc Natl
Acad Sci USA 99, 12681–12684.
17 Uversky VN (1993) Use of fast protein size-exclusion
liquid chromatography to study the unfolding of pro-
teins which denature through the molten globule.
Biochemistry 32, 13288–13298.
18 Jones DT (1999) Protein secondary structure prediction
based on position-specific scoring matrices. J Mol Biol
292, 195–202.
19 Cuff JA & Barton GJ (1999) Evaluation and improve-
ment of multiple sequence methods for protein second-
ary structure prediction. Proteins 34, 508–519.
20 Pollastri G, Przybylski D, Rost B & Baldi P (2002)
Improving the prediction of protein secondary structure
in three and eight classes using recurrent neural net-
works and profiles. Proteins 47, 228–235.
21 Tiriveedhi V & Butko P (2007) A fluorescence spectros-
copy study on the interactions of the TAT-PTD peptide
with model lipid membranes. Biochemistry 46, 3888–
3895.
22 Ladokhin AS & White SH (2004) Interfacial folding
and membrane insertion of a designed helical peptide.
Biochemistry 43, 5782–5791.
23 Popovic M, Coglievina M, Guarnaccia C, Verdone G,
Esposito G, Pintar A & Pongor S (2006) Gene synthe-
sis, expression, purification, and characterization of
human Jagged-1 intracellular region. Protein Expr Purif
47, 398–404.
24 Saxena MT, Schroeter EH, Mumm JS & Kopan R (2001)
Murine notch homologs (N1–4) undergo presenilin-
dependent proteolysis. J Biol Chem 276, 40268–40273.
25 White SH & Wimley WC (1999) Membrane protein
folding and stability: physical principles. Annu Rev
Biophys Biomol Struct 28, 319–365.
26 Olivotto M, Arcangeli A, Carla M & Wanke E (1996)
Electric fields at the plasma membrane level: a neglected
element in the mechanisms of cell signalling. Bioessays
18, 495–504.
27 Slavik J (1983) Intracellular pH topography: determina-
tion by a fluorescent probe. FEBS Lett 156, 227–230.
28 Chandra S, Chen X, Rizo J, Jahn R & Sudhof TC
(2003) A broken alpha-helix in folded alpha-Synuclein.
J Biol Chem 278, 15313–15318.
29 Simanek EE, Huang D, Pasternack L, Machajewski TD,
Seitz O, Millar DS, Dyson HJ & Wong C (1998) Glyco-
sylation of threonine of the repeating unit of RNA poly-
merase II with b-linked N-acetylglucosame leads to a
turn-like structure. J Am Chem Soc 120, 11567–11575.
30 Wells L, Vosseller K & Hart GW (2001) Glycosylation
of nucleocytoplasmic proteins: signal transduction and
O-GlcNAc. Science 291, 2376–2378.
31 Shoemaker BA, Portman JJ & Wolynes PG (2000)
Speeding molecular recognition by using the folding
funnel: the fly-casting mechanism. Proc Natl Acad Sci
USA 97, 8868–8873.
32 Zeev-Ben-Mordehai T, Rydberg EH, Solomon A, Toker
L, Auld VJ, Silman I, Botti S & Sussman JL (2003) The
intracellular domain of the Drosophila cholinesterase-
like neural adhesion protein, gliotactin, is natively
unfolded. Proteins 53, 758–767.
33 Aivazian D & Stern LJ (2000) Phosphorylation of T cell
receptor zeta is regulated by a lipid dependent folding
transition. Nat Struct Biol 7, 1023–1026.
34 Duchardt E, Sigalov AB, Aivazian D, Stern LJ & Schw-
albe H (2007) Structure induction of the T-cell receptor
zeta-chain upon lipid binding investigated by NMR
spectroscopy. Chembiochem 8, 820–827.
35 Sigalov A, Aivazian D & Stern L (2004) Homooligo-
merization of the cytoplasmic domain of the T cell
receptor zeta chain and of other proteins containing the
immunoreceptor tyrosine-based activation motif. Bio-
chemistry 43, 2049–2061.
36 Sigalov AB, Aivazian DA, Uversky VN & Stern LJ
(2006) Lipid-binding activity of intrinsically unstruc-
tured cytoplasmic domains of multichain immune recog-
nition receptor signaling subunits. Biochemistry 45,
15731–15739.
37 Kim PW, Sun ZY, Blacklow SC, Wagner G & Eck MJ
(2003) A zinc clasp structure tethers Lck to T cell core-
ceptors CD4 and CD8. Science 301 , 1725–1728.
38 Uversky VN, Gillespie JR & Fink AL (2000) Why are
‘natively unfolded’ proteins unstructured under physio-
logic conditions? Proteins 41, 415–427.
39 Roccatano D, Colombo G, Fioroni M & Mark AE
(2002) Mechanism by which 2,2,2-trifluoroethanol ⁄ water
mixtures stabilize secondary-structure formation in pep-
tides: a molecular dynamics study. Proc Natl Acad Sci
USA 99, 12179–12184.
40 Lobley A, Whitmore L & Wallace BA (2002) DICHRO-
WEB: an interactive website for the analysis of protein
secondary structure from circular dichroism spectra.
Bioinformatics 18, 211–212.
41 Serber Z, Corsini L, Durst F & Dotsch V (2005) In-cell
NMR spectroscopy. Methods Enzymol 394, 17–41.
42 Serber Z, Ledwidge R, Miller SM & Dotsch V (2001)
Evaluation of parameters critical to observing proteins
inside living Escherichia coli by in-cell NMR spectros-
copy. J Am Chem Soc 123, 8895–8901.
M. Popovic et al. RIPping Jagged-1 cytoplasmic region
FEBS Journal 274 (2007) 5325–5336 ª 2007 The Authors Journal compilation ª 2007 FEBS 5335
43 Parks AL & Curtis D (2007) Presenilin diversifies its
portfolio. Trends Genet 23, 140–150.
Supplementary material
The following supplementary material is available
online:
Table S1. CD. Helical content calculated from the ellip-
ticity at 222 nm (H
222
), secondary structure content (H,
helix, E, strand, C, disordered) calculated by CDSSTR
through deconvolution of CD spectra, and normalized
root mean squared deviation of the fit (nrmsd).
Fig. S1. NMR. Proton chemical shift distribution of
detectable
1
HNs for J1_tmic (gray bars), J1_tmic in
the presence of SDS, and of random coil values for a
protein of the same sequence.
Fig. S2. In-cell NMR.
1
H-
15
N HSQC spectra of the
E. coli slurry [(A), not induced; (B), induced and of
the supernatant (C) of the induced culture].
Fig. S3. Size exclusion chromatography.
Fig. S4. Fluorescence spectroscopy.
Fig. S5. Effect of pH. Far-UV CD spectra of
J1_tmic (7.5 lm) in the presence of SDS (3 mm)at
pH 7.4, after acidification to pH 6, and after return
to pH 7.4.
Fig. S6. Effect of pH. Far-UV CD spectra of J1_tmic
(7.5 lm) in the presence of DMPG phospholipid
vesicles (1 mm) at pH 7.4, after acidification to pH 6,
and after return to pH 7.4.
Fig. S7. CD of J1_ic. Far-UV CD spectra of J1_ic
(7.0 lm) in buffer alone and in the presence of SDS (3
mm) at pH 7.4 and at pH 6.
Fig. S8. CD of J1_ic. Far-UV CD spectra of J1_ic
(7.0 lm) in buffer alone and in the presence of DMPG
phospholipid vesicles (1 mm) at pH 7.4 and at pH 6.
Fig. S9. Intrinsic disorder. Domain architecture, as cal-
culated by SMART, of human RIP substrates ana-
lyzed in this work.
This material is available as part of the online article
from
Please note: Blackwell Publishing is not responsible
for the content or functionality of any supplementary
materials supplied by the authors. Any queries (other
than missing material) should be directed to the corre-
sponding author for the article.
RIPping Jagged-1 cytoplasmic region M. Popovic et al.
5336 FEBS Journal 274 (2007) 5325–5336 ª 2007 The Authors Journal compilation ª 2007 FEBS