Tài liệu Báo cáo khoa học: Identification of differentially expressed genes of the Pacific oyster Crassostrea gigas exposed to prolonged thermal stress docx
Bạn đang xem bản rút gọn của tài liệu. Xem và tải ngay bản đầy đủ của tài liệu tại đây (410.92 KB, 11 trang )
Identification of differentially expressed genes of the
Pacific oyster Crassostrea gigas exposed to prolonged
thermal stress
Anne-Leila Meistertzheim
1
, Arnaud Tanguy
2
, Dario Moraga
1
and Marie-The
´
re
`
se The
´
bault
1
1 Laboratoire des Sciences de l’Environnement Marin, Institut Universitaire Europe
´
an de la Mer, Universite
´
de Bretagne occidentale,
Plouzane
´
, France
2 Laboratoire Adaptation et Diversite
´
en Milieu Marin, Station Biologique, Roscoff, France
The fluctuating thermal nature of the marine environ-
ment induces physiological changes in ectotherms that
require molecular and gene expression adjustments [1].
Comparative gene expression studies can be used to
characterize these adjustments and lead to a better
understanding of organismal responses to environmen-
tal change. Gene expression datasets can be clustered
into groups of genes that represent different compart-
ments of cellular function, and changes in the expres-
sion of genes from these clusters can be used to
formulate hypotheses as to how different tissues and
whole organisms respond to particular biotic or abiotic
stresses. Few studies have addressed changes in gene
expression in response to temperature variation on
marine organisms. Alterations in gene expression have
been observed in fish acclimated to constant tempera-
tures and then exposed to daily temperature fluctua-
tions [2] or to a strong heat stress [3]. However, few
molecular investigations have focused on the thermal
stress response in marine invertebrates [4,5], particu-
larly in the context of global changes and the potential
effects on marine invertebrates [6,7].
The Pacific oyster Crassostrea gigas is a eurythermic
bivalve mollusc that colonizes most of the western
coast of Europe. This species prefers sheltered estua-
rine waters, where it is found in intertidal and shallow
subtidal zones. Within their geographic range, oysters
typically experience and respond to seasonal tempera-
tures ranging from 4 to 24 °C [8]. In the coldest
regions inhabited by C. gigas, such as Brittany,
Keywords
climate; Crassostrea gigas; gene expression;
heat stress; prolonged thermal stress
Correspondence
M. T. The
´
bault, Laboratoire des Sciences
de l’Environnement Marin, UMR-CNRS
6539, Institut Universitaire Europe
´
en de la
Mer, Universite
´
de Bretagne Occidentale,
Place Nicolas Copernic, 29280 Plouzane
´
,
France
Fax: +33 2 98 49 86 45
Tel: +33 2 98 49 86 12
E-mail:
(Received 5 April 2007, revised 17 October
2007, accepted 19 October 2007)
doi:10.1111/j.1742-4658.2007.06156.x
Groups of oysters (Crassostrea gigas) were exposed to 25 °C for 24 days
(controls to 13 °C) to explore the biochemical and molecular pathways
affected by prolonged thermal stress. This temperature is 4 °C above the
summer seawater temperature encountered in western Brittany, France
where the animals were collected. Suppression subtractive hybridization
was used to identify specific up- and downregulated genes in gill and
mantle tissues after 7–10 and 24 days of exposure. The resulting libraries
contain 858 different sequences that potentially represent highly expressed
genes in thermally stressed oysters. Expression of 17 genes identified in
these libraries was studied using real-time PCR in gills and mantle at differ-
ent time points over the course of the thermal stress. Differential gene
expression levels were much higher in gills than in the mantle, showing that
gills are more sensitive to thermal stress. Expression of most transcripts
(mainly heat shock proteins and genes involved in cellular homeostasis)
showed a high and rapid increase at 3–7 days of exposure, followed by a
decrease at 14 days, and a second, less-pronounced increase at 17–24 days.
A slow-down in protein synthesis occurred after 24 days of thermal stress.
Abbreviations
CTSL, cathepsin L; EST, expressed sequence tag; HYPK, Huntingtin-interacting protein K; HSP, heat shock protein; LDH, lactate
dehydrogenase; MTA-1, metastasis-associated protein 1; SSH, suppression substractive hybridization.
6392 FEBS Journal 274 (2007) 6392–6402 Journal compilation ª 2007 FEBS. No claim to original French government works
France, summer water temperatures only occasionally
reach 21 °C for short periods of up to a few days.
Recent studies on C. gigas suggest that complex inter-
actions between temperature and food quality and
quantity affect gametogenesis [9,10]. Reproductive
development is temperature dependent in C. gigas and
typically occurs between February and September
along the western Atlantic coast of France [11].
Spawning occurs at a minimum seawater temperature
of $ 19 °C [12,13]. One study focused on the expres-
sion of heat shock proteins (HSPs) in C. gigas, at the
molecular and physiological level, in response to heat
stress throughout the year [7].
The aim of this study was to improve our knowledge
of differentially expressed genes in C. gigas exposed to
a temperature slightly above the upper natural water
temperature in the area. Our study is the first to apply
an overall genomic approach to the study of the
response of C. gigas to prolonged heat stress. We used
animals outside the season of reproductive develop-
ment and spawning in order to measure temperature
stress without the onset of reproduction. Using sup-
pression substractive hybridization (SSH), we identified
genes that were up- and downregulated 7–10 and
24 days after transfer from 13 to 25 °C. Subsequently,
genes likely to be associated with thermal stress were
quantified using quantitative real-time PCR.
Results
Suppression subtractive hybridization
SSH libraries were constructed from pooled gills and
mantle of C. gigas after 7–10 and 24 days of exposure
to different temperature treatments. The search for
homology using the blastx program revealed 858
different sequences, of which 536 ($ 62%) remain
unidentified. Expressed sequence tags (ESTs) similar to
genes potentially involved in a thermal response were
subsequently clustered into 15 distinct functional cate-
gories: cell differentiation (including cell migration,
adhesion, proliferation and apoptosis), cellular com-
munication (including signal transduction), cellular
stress (including inflammation and immune response),
cytoskeleton and cell structure (including cellular
matrix and cellular trafficking), detoxification, ener-
getic metabolism, lipid metabolism, receptors and
channels, regulation of nucleosides, nucleotides and
acid nucleic metabolism, reproduction, respiratory
chain, transcriptional processing, translational and
post-translational processing, general metabolism
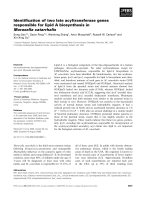
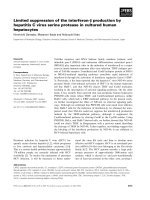
and other functions and ribosomal proteins (Fig. 1
and supplementary Tables S1–S4). Among the 322
recognized protein-coding genes, 191 new sequences
were obtained in C. gigas and 131 had been identified
previously, of which 88 genes encode ribosomal pro-
teins in both forward and reverse libraries. Among the
newly known sequences, only one corresponded to a
gene specific for mantle (mantle gene 4). No cellular
signalling genes were identified in samples taken after
24 days. Cytoskeletal genes, translation and ribosomal
genes were less abundant on warming. Only respira-
tory genes were more abundant on warming.
Gene expression patterns from different
functional categories during temperature
acclimation
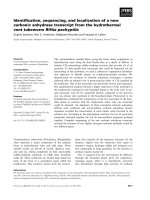
Using real-time PCR we conducted a time-course
study to compare transcript expression in oysters
exposed to thermal stress at 25 °C relative to control
animals maintained at 13 °C. Seventeen transcripts
analysed after 0, 3, 7, 14, 17 and 24 days of exposure
(Fig. 2) belonged to categories previously implicated in
the stress response: (a) cell proliferation and differenti-
ation: metastasis-associated protein 1 (MTA-1), Hun-
tingtin-interacting protein K (HYPK), cystatin B,
cathepsin L (CTSL, EC 3.4.22.15) (these proteins are
known tumor markers) [14,15], QM protein (transcrip-
tional control of cell differentiation and proliferation)
[16,17], Ras family GTP-binding protein Rho1p (dif-
ferentiation); (b) cellular stress: HSP70, HSP70 kDa
protein 12A, HSP23, chaperonin-containing TCP1
(alternative name CCT) subunit 7, isoform b (chaper-
ones), inhibitor of kappa light polypeptide (inflamma-
tion); (c) antioxidant defense: non-selenium glutathione
peroxidase (EC 1.11.1.7); (d) metabolism of nitrogen
and ammonia detoxification: glutamine synthetase
(EC 1.4.1.13); (e) membrane fluidity: D9 desaturase
(EC 1.14.19.1); (f) energetic metabolism: d-lactate
dehydrogenase (d-LDH, EC 1.1.1.28, anaerobic metab-
olism), citrate synthase (EC 2.3.3.1, aerobic metabo-
lism); and (g) translational processing (translation
initiation factor eIF-2B delta subunit). Normalized
expression data are summarized in Table 1.
In the gills, all transcripts selected in the forward
SSH library at 25 °C, except citrate synthase, showed
an initial expression peak at days 3–7, followed by a
decrease at day 14, and then a smaller increase at days
17–24 at 25 °C compared with controls (13 °C)
(Fig. 2A and Table 1). The most differentially
expressed transcripts at 25 °C were HSPs, MTA-1 pro-
tein, chaperonin-containing TCP1 subunit 7, isoform b
and d-LDH. Gene expression was less pronounced in
mantle relative to the gills (Fig. 2). In the mantle, some
transcripts (HSP70, HSP23, MTA-1 protein, Rho1p,
A L. Meistertzheim et al. Thermal stress-induced gene expression in C. gigas
FEBS Journal 274 (2007) 6392–6402 Journal compilation ª 2007 FEBS. No claim to original French government works 6393
D9-desaturase and glutamine synthetase) showed a
peak of overexpression at days 14 and ⁄ or 17. In con-
trast to observations on gill tissue, mantle levels of
HSP12A, MTA-1 protein, Rho1p, D9-desaturase and
citrate synthase transcripts were significantly lower at
25 °C on day 3. Variation in the expression of d-LDH
and chaperonin-containing TCP1 subunit 7, isoform b
genes was not significant.
Different profiles were observed for transcripts
selected from the reverse SSH library at 13 °C (Fig. 2B
and Table 1). In gill tissue, inhibitor of kappa light
polypeptide, non-selenium glutathione peroxidase,
CTSL and translation initiation factor eIF-2B were
highly expressed at days 3 and ⁄ or 7 at 25 °C relative
to control (13 °C). CTSL, non-selenium glutathione
peroxidase and translation initiation factor eIF-2B
were downregulated at day 24 in gills at 25 °C. Expres-
sion of the HYPK gene did not show much variation,
although it increased significantly from the beginning
to the end of the experiment. Cystatin B, inhibitor of
kappa light polypeptide and QM protein (60S ribo-
somal protein) showed a biphasic expression pattern.
In mantle cells, variation in expression levels of CTSL
and inhibitor of kappa light polypeptide genes was not
significant. Overexpression of cystatin B, non-selenium
glutathione peroxidase and translation initiation factor
eIF-2B transcripts was limited to a relatively short
time-window at days 14 and ⁄ or 17. HYPK and QM
protein were underexpressed at days 3, 7 and 24 and
day 7, respectively.
Discussion
Of 322 genes identified in this study, 191 partial
sequences had not been identified previously in
C. gigas. Of the 131 known genes, 88 encode ribo-
somal proteins and had been identified previously in
C. gigas responding to environmental stresses such as
hydrocarbons, pesticides and hypoxia [18–20]. Thus,
their gene products appear to be important for
Cell differentiation, migration, adhesion,
proliferation, apoptosis
Cellular communication, signal transduction
Cellular stress, inflammation, immune function
Cytoskeleton, structure, matrix and
cellular trafficking
Detoxification
Energetic metabolism
General metabolism, others functions
Lipid metabolism
Receptors and channel
Regulation of nucleoside, nucleotide
and nucleic acid metabolism
Reproduction
Respiratory chain
Transcriptional processing
Translational and post-translational
processing
Ribosomal proteins
A1 A2
B1 B2
3%
10%
9%
1%
5%
6%
2%
9%
4%
1%
11%
5%
6%
26%
11%
8%
6%
12%
3%
9%
2%
9%
3%
35%
2%
5%
5%
15%
1%
7%
5%
8%
6%
17%
32%
6%
8%
11%
3%
3%
14%
17%
28%
8%
5%
3%
Fig. 1. Functional classification of the sequences identified in SSH libraries which matched known genes corresponding to the 100% value.
SSH were made from pooled gills and mantle of C. gigas. Genes were clustered into 15 categories according to their putative biological
function. A1 and A2, 25 and 13 °C at 7–10 days; B1 and B2, 25 and 13 °C at 24 days.
Thermal stress-induced gene expression in C. gigas A L. Meistertzheim et al.
6394 FEBS Journal 274 (2007) 6392–6402 Journal compilation ª 2007 FEBS. No claim to original French government works
Relative expression
*
0
5
10
0
5
Heat shock protein 12A
10
0
5
10
Heat shock protein 23Heat shock protein 70
0
5
037141724
0
5
037141724
0
5
0371417
24
*
*
*
*
*
*
*
*
*
*
*
*
*
*
*
*
*
*
0
5
10
0
5
10
Metastasis associated
protein1
Ras family GTP-
binding protein Rholp
0
5
037141724
0
5
037141724
*
*
*
*
*
*
Chaperonin containing
TCP1, sub. 7
0
0
5
037141724
5
10
*
*
*
*
*
*
*
*
*
*
0
5
10
0
5
10
Glutamine synthetase
D-lactate
dehydrogenase
0
5
037141724
0
5
037141724
0
5
037141724
0
5
10
9 desaturase
*
*
*
*
*
*
*
*
*
*
*
*
*
*
Exposure duration (days)
Exposure duration (days)
*
Citrate synthase
0
5
10
0
5
037141724
*
*
10
*
*
Huntingtin
interacting protein K
Inhibitor of kappa light
polypeptide
0
5
0
5
10
0
5
037141724
0
5
037141724
*
*
*
*
*
*
*
*
*
*
**
*
0
5
037141724
QM Protein
0
5
10
*
*
*
*
*
*
*
Non-selenium
glutathione peroxidase
10
Cathepsin L Cystatin B
0
5
0
5
10
0
5
10
15
0
5
0371417
24
0
5
03714
17
24
0
5
037141724
*
*
*
*
*
*
*
*
*
*
*
Translation initiation
factor eIF-2B
0
5
10
0
5
037141724
*
*
*
*
A B
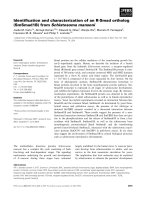
Fig. 2. Results from real-time RT-PCR showing temporal expression patterns of some representative cDNA transcripts over a 24-days period from the 25 °C (A) and 13 °C (B) SSH libraries.
Relative expression levels were normalized to 18S RNA. Bars represent the mean of three replicates per sampling point and the error bars correspond to the SD (black, gills; grey, mantle).
Hatched and solid bars represent the relative amount of expression at 13 °C (control group) and 25 °C (treated group), respectively. Comparison between control and treated groups was
made using Student’s t-test. *Significant at the 5% level.
A L. Meistertzheim et al. Thermal stress-induced gene expression in C. gigas
FEBS Journal 274 (2007) 6392–6402 Journal compilation ª 2007 FEBS. No claim to original French government works 6395
metabolic adjustments during stress in general. How-
ever, the expression patterns observed were tissue spe-
cific with gills being more responsive than mantle. We
hypothesize that the observed patterns reflect func-
tional differences between these two tissues. A number
of genes that were highly expressed in gills showed
a biphasic expression pattern, consisting of a strong
short- and a moderate long-term response. Moreover,
after 7–10 days of exposure, we detected differential
expression of a number of genes that encode elements
of the transcription and translation machinery, includ-
ing transcription factors, ribosomal proteins and elon-
gation factors. After 24 days of exposure to elevated
temperature, the differential expression profile was
Table 1. Expression patterns in gills (G) and mantle (M) throughout the experiment at 25 versus 13 °C. For each gene, + (or –) represents
significant relative upregulation (or downregulation): + ⁄ ) from 1.2- to 2-fold; ++ ⁄ )) from 2- to 5-fold; +++ ⁄ )) from 5- to 10-fold; ++++
> 10-fold. NS, not significant. *P < 0.05, **P < 0.01, ***P < 0.001.
Days of exposure Tissue
3 7 14 17 24
G MG MGM GMGM
Cell proliferation and differentiation
MTA-1 + ++ NS NS NS +++ NS NS ++ NS
** * **
HYPK ++ ) + )) +++ ++ ++))
*** ** *** *** * *** *** *** *** ***
Ras family GTP-binding protein Rho1p ++ )) NS NS + ++ + + ++ NS
*** ** * ** ** ** ***
Cystatin B + NS ) NS NS ++ NS NS ++ NS
** * ** **
CTSL NS NS ++++
**
NS NS NS NS NS ))
*
NS
QM protein ++ NS + )) ) +++ NS + ++ NS
*** * ** * *** *** ***
Cellular stress
HSP70 ++ NS + NS NS ++ ++ NS ++ NS
** * * * **
Heat shock 70 kDa protein 12A ++ )) ++ NS ++ NS ++ NS + NS
*** * *** ** ** **
HSP23 ++ NS +++ NS NS ++++ ++ ++ NS NS
*** *** ** * **
Chaperonin containing TCP1,
subunit 7, isoform b, isoform 1
++ NS ++ NS ++ NS ++ NS ++ NS
*** *** ** ** **
Inhibitor of kappa light polypeptide
enhancer in B cells, kinase complex
++ NS +++ NS + NS + NS + NS
*** *** * * *
Antioxidant defeNSe
Non-selenium glutathione peroxidase ++++ )) ++ NS )) NS NS ++ )) NS
*** ** *** *** ** ***
Metabolism of nitrogen and ammonia detoxification
Glutamine synthetase + NS + NS NS +++ + ++ ++ NS
* * ** * ** ***
Membrane fluidity
Delta-9-desaturase +++ )) + NS NS ++ + +++ ++ NS
*** ** * ** ** *** ***
Energetic metabolism
Citrate synthase +++ )) ++ NS NS NS NS NS NS NS
*** ** ***
D-LDH +++ NS ++ NS NS NS ++ NS ++ NS
*** *** ** **
Translational processing
Translation initiation factor
eIF-2B delta subunit
+NSNSNSNS++++NS)) NS
*** ** ** **
Thermal stress-induced gene expression in C. gigas A L. Meistertzheim et al.
6396 FEBS Journal 274 (2007) 6392–6402 Journal compilation ª 2007 FEBS. No claim to original French government works
dominated by strong downregulation of genes involved
in protein synthesis, such as the translation initiation
factor eIF-2B delta subunit, suggesting a slowing of
protein synthesis. These findings may suggest that
transcription factors are regulated though a feedback
mechanism, inducing their own inactivation [21].
Changes in gene expression of organisms subjected to
thermal stress are known to involve major adjustments
in the expression of ribosomal genes and genes coding
for proteins involved in RNA metabolism and protein
synthesis. In fact, protein synthesis in marine snails
was inactivated at temperatures approaching lethal
values [22].
Under mild thermal stress at 25 °C, genes coding for
antistress proteins were differentially expressed. Protec-
tion against cellular stress, inflammation and stimula-
tion of immune function appear to be important
components of responses to thermal stress. HSPs play
an essential role in maintaining protein homeostasis
during exposure to proteotoxic stressors [23]. They
function by interacting with stress-denatured proteins
and preventing their aggregation and ⁄ or degradation
[24]. HSP induction may therefore have an adaptative
value for organisms facing thermal stress and signifi-
cant ecological and biogeographical implications for
species distribution and their thermotolerance limits
[22,25]. Tissue-specific de novo HSPs synthesis was
induced in C. gigas following exposure to 25 °C, which
is 4 °C higher than the highest sea surface tempera-
tures recorded in its distribution range. Two HSPs
(HSP70 and HSP23) were greatly and rapidly upregu-
lated in gills but slightly less and later in mantle. One
inducible and two constitutive isoforms of HSP70 are
synthesized in the gills and mantle of C. gigas [26].
The expression level of the constitutive forms increases
after thermal stress, whereas the inducible one is
expressed only after exposure to 32 °C [7]. These
results suggest that the overexpression of HSP70 we
observed might correspond to the constitutive form.
HSP23 is a small heat shock protein highly induced
following stress. Small HSPs are differentially
expressed between tissues and through the different
stages of development [27]. A third HSP, HSP12A
(alternative name 150 kDa oxygen-regulated protein;
ORP150), was induced in gill tissue only. This chaper-
one, located in the endoplasmic reticulum, plays an
important role in maintaining cell viability in response
to stress [28]. Among other chaperones, the chapero-
nin-containing TCP1 (subunit 7, isoform b) presented
the same expression pattern in response to heat stress
in our study. This complex, involved in folding actin,
tubulin and cyclin E, among other proteins [29], is also
upregulated in response to chemical stress [30]. Hence
TCP1 may play an important role in the recovery of
cells after protein damage, by assisting the folding of
cytoskeletal proteins that are actively synthesized
and ⁄ or renatured under these conditions. The upregu-
lation of all of these chaperones confirms the severity
of the thermal stress under our experimental condi-
tions.
A number of genes encoding structural components
of the cytoskeleton and proteins involved in contractile
functions (including actin, tubulin myosin and profilin)
were differentially expressed in C. gigas in response to
prolonged heat stress, some were induced and some
repressed. Rho1p, for example, encodes for a protein
involved in numerous processes including actin fila-
ment organization and is expressed in response to envi-
ronmental changes [31]. In this study, Rholp was
rapidly upregulated in gills and later in mantle during
warming. These results suggest that extensive cytoskel-
etal reorganization occurs in response to heat stress, as
reported for fish gills [3].
Furthermore, several genes associated with the regu-
lation of cell homeostasis were differentially expressed
in our study. Some genes were differentially expressed
in both tissues, showing increased apoptotic ⁄ autopha-
gic activity. Among these genes, MTA-1 was strongly
expressed in gills during warming, whereas it was ini-
tially downregulated in mantle. CTSL, a highly potent
endoprotease involved in lysosomal bulk proteolysis,
was strongly expressed, but only in gills. The upregula-
tion of CTSL, combined with the downregulation of
its reversible binding inhibitor cystatin B, implies that
active protein degradation was taking place in the gills
upon warming to 25 °C. Two less well-known genes,
putatively involved in proliferation and apoptosis, QM
protein and HYPK were both differentially expressed
between the tissues. QM protein, also known as ribo-
somal protein L10, is a transcription cofactor that
inhibits activation of AP-1 transcription factors. QM
protein is implicated in the conversion of a broad vari-
ety of extracellular signals generated by growth factors,
tumour promoters or genotoxic drugs [16,32]. In the
sponge, Suberites domuncula, QM protein expression
was significantly higher in tissues undergoing induced
apopotosis [33]. On warming to 25 °C, upregulation of
QM protein occurred rapidly in gills and later in man-
tle. HYPK, identified as a antiapoptotic protein [34],
displayed the same expression pattern as QM protein
in both tissues. These results suggest that, in C. gigas,
these proteins are induced to prevent pathologies such
as inflammation and tumorigenesis during prolonged
thermal stress.
The cellular stress response has an energetic cost
and control of the balance between ATP supply and
A L. Meistertzheim et al. Thermal stress-induced gene expression in C. gigas
FEBS Journal 274 (2007) 6392–6402 Journal compilation ª 2007 FEBS. No claim to original French government works 6397
demand in the ciliated gill may become altered during
thermal stress. In C. gigas, stressors such as hydro-
carbons, herbicides, parasite infection or hypoxia
[18–20,35], affect the expression of genes involved in
energetic metabolism and our results show that
changes in transcript levels of a number of genes
involved in metabolic regulation also occur in response
to temperature. In gill tissue, prolonged heat stress
resulted in the rapid induction of several ATP-generat-
ing enzymes including the tricarboxylic acid cycle
citrate synthase, suggesting that there was a need for
rapid aerobic ATP production. In the early phase of
warming, the rapid induction of LDH in gills may
indicate that anaerobic metabolism is required. The
LDH that we identified was d-specific. Many system-
atic studies have shown that d-orl-specific LDHs are
present in all invertebrate groups [36]. We also
observed that the glutamine synthetase gene was up-
regulated in both tissues, as previously observed in
response to hydrocarbons, herbicides or hypoxia
[18–20]. In vertebrates, glutamine synthetase occupies a
central position in nitrogen metabolism and is linked
to amino acid turnover, nitrogen detoxification,
nucleotide biosynthesis and more generally to growth
[37]. Although the capacity for glutamine biosynthesis
is generally weak or absent in molluscs [38], a recent
study reported the accumulation of glutamine associ-
ated with an upregulation of glutamine synthetase in a
bivalve species in response to aerial exposure [39].
Glutamine synthesis may also be an ammonia detoxifi-
cation mechanism in invertebrates.
Genes involved in fatty acid metabolism are
expected to be affected by temperature. Among these,
D9 desaturase has been extensively studied in numer-
ous animal groups including mammals, chicken, fish
and insects [40,41]. High temperatures typically
increase membrane fluidity in temperate eurytherms
[42]. The upregulation of D9 desaturase that we
observed in gills, and later in mantle, agrees with this
pattern. A similar pattern was previously observed in
C. gigas in response to experimental hypoxia, suggest-
ing that the regulation of this enzyme may be affected
primarily by oxidative stress [24]. Recent studies on
intertidal bivalves show that critical warming may
exacerbate cellular oxidative stress [43]. In many spe-
cies, the increase in lipid peroxidation and reactive
oxygen species concentration in cells following heat
stress has already been shown to modify the activity of
antioxidant enzymes such as GPx [44]. Non-selenium
glutathione peroxidase is involved in detoxification by
reducing fatty acid hydroxyperoxides and H
2
O
2
[45]. In
our study, the level of the non-selenium glutathione
peroxidase transcript appears strongly upregulated in
gills during the first week of thermal exposure. A simi-
lar thermal stress response, associated with oxidative
stress, has also been observed in other marine poikilo-
thermic species including molluscs [43,46–48].
Our results represent the first stages of investigation
into the molecular response of oysters to high tempera-
tures, focusing on early winter, outside the gametogen-
esis period. Future efforts will focus on the search for
functional polymorphism in some of the genes poten-
tially regulated by temperature in oyster populations
located at the limits of the species distribution area.
Experimental procedures
Thermal acclimation and experimental design
Adult oysters (length 85 ± 5 mm) were collected from La
Pointe du Chaˆ teau (Brittany, France) in November 2004
(seawater temperature 13 °C) and kept constantly immersed
at ambient temperature ($ 13 °C) in aerated 0.22-lm fil-
tered seawater tanks for 21 days. Groups of oysters were
then exposed to two laboratory-controlled temperature
regimes in 40 L tanks: 60 oysters were acclimated for
4 weeks to 25 °C(4°C above the temperature of seawater
encountered in summer in southern Brittany), and a control
group of 70 oysters was maintained in seawater at 13 °C.
Oysters were fed three times a week with a microalgal sus-
pension (containing Isochrysis galbana and Pavlova lutheri).
No oysters died during the experiment.
For each of the experimental conditions, oysters were
sampled at 0, 3, 7, 10, 14, 17 and 24 days following the
start of the treatments. Gill and mantle tissues were dis-
sected, rapidly frozen in liquid nitrogen and stored at
)80 °C until analysis. Pools of gill and mantle were pre-
pared on these sampling dates by taking 50 mg of each
tissue from each of 10 individuals.
RNA extraction
Total RNA was extracted using TRIzolÒ Reagent (Invitro-
gen, Carlsbad, CA) with 1 mL ⁄ 50 mg of tissue. For SSH
experiments, polyadenylated RNA was isolated using the
PolyATtractÒmRNA Isolation System (Promega, Madison,
WI) according to the manufacturer’s instructions. RNAs
were resuspended in RNase-free water and their quantity
was assessed by spectrophotometry.
Suppression subtractive hybridization
Messenger RNA was extracted from mantle and gills of
oysters exposed to 13 or 25 °C after 7–10 and 24 days.
Two micrograms of mRNA (1 lg from the gills and 1 lg
from the mantle) were used as the template for SSH follow-
ing the PCR-select cDNA subtraction kit procedure
Thermal stress-induced gene expression in C. gigas A L. Meistertzheim et al.
6398 FEBS Journal 274 (2007) 6392–6402 Journal compilation ª 2007 FEBS. No claim to original French government works
(Clontech, Palo Alto, CA). Hybridization and subtraction
steps were carried out in both directions. For forward sub-
traction, the 25 °C sample (tester) was subtracted with
13 °C sample (driver) and the opposite was done for reverse
subtraction. Four libraries (two forward and two reverse)
were thus constructed. PCR products were then purified
and cloned into pGEM-T vector (Promega). Five hundred
white colonies per library were grown on Luria–Bertani
medium (with 100 mgÆL
)1
ampicillin). A total of 2000 ran-
domly selected clones were single-pass sequenced using an
ABI 3730 sequencer with the sequencing kit ABI Big dye
terminator version 3.1 at the Genoscope Sequencing Center
(Evry, France). Sequences were then analyzed using BlastX
algorithm available from the National Center for Biotech-
nology Information (NCBI) and the EST sequences were
then submitted to its dbEST and GenBank databases (see
supplementary Tables S1–S4).
Real-time PCR analyses
Real-time PCR was used to analyse the expression profiles
of some selected genes involved in cell proliferation and dif-
ferentiation, cellular stress, antioxidant defence, metabolism
of nitrogen and ammonia detoxification, membrane fluidity,
energetic metabolism and translational processing. Total
RNA was extracted from gills and mantle of 10 oysters
exposed to 13 and 25 °C for 0, 3, 7, 10, 14, 17 and 24 days.
A pool of the 10 RNA samples was made for each tissue at
each sampling point in a proportional manner according to
the amount of total RNA collected from each animal.
Reverse transcription was performed on 20 l g RNA from
each pool using the oligo(dT) anchor primer (5¢-GAC
CACGCGTATCGATGTCGACT
(16)
V-3¢) and Moloney
murine leukaemia virus (M-MLV) reverse transcriptase
(Promega). Real-time PCR was performed in triplicate with
Table 2. Combinations of primers used in real-time PCR expression analysis.
Genes Primer sequences (5’- to 3’)
MTA-1 AATGCTGGCTCTCCCTCGAT
GCTTGGCTACTGGACCATCAA
Ras family GTP-binding protein Rho1p GATACAGCAAACGGAAAGTCAACA
CAGTTCCTCGGGCCAACA
Cystatin B GCCCCCCTCCCACACA
CATCTTCGGCCGTCTTTCC
CTSL GTTCTTGTTCCTGCTCATCAGTATG
TGGATCGCCAAAAACTCATG
QM protein AATGCTGGCTCTCCCTCGAT
GCTTGGCTACTGGACCATCAA
HYPK GGAAATGGAAATAACAAGACAAATAGC
GCGCAACTAATGCTTCCACAA
HSP70 TGACCAAGGCAACAGAACCA
AATCAGACGGCCGGTATGTG
Heat shock 70 kDa protein 12A CGAAAAAGGACAGCAGTTGAAA
CTCATCCTCCACCGGATTGT
HSP23 CGTCCGATTTCTTCTCGTGTTT
ACCAGAAGACATTACAGTGAAAATTGA
Chaperonin-containing TCP1, subunit 7, isoform b, isoform 1 GGGAACCAGCAGTCGTCAAA
CGTCCACTGAGAGGATGAGACA
Inhibitor of kappa light polypeptide enhancer in B cells, kinase
complex-associated protein
AAAGCAGAGCAGAAAAAGTGGAA
GGACAATGCCGCGATCAG
Non-selenium glutathione peroxidase CAATGAACAAAAAAGTCGCAACA
GGGATGGAGGGTAAGACCATACA
Glutamine synthetase ACGGAGGTTGACGGGACTT
GCTGGCACCACGATTGG
Delta-9-desaturase ACGGTCGTTCCCTGTGTCTT
CCGACCATGTGGCGTTTAGT
Citrate synthase CCGCGCCGGGACCTCCGTCGGTGTTGTAG
TTCGTCGGACACAGAGTCTCCCAATTCTC
D-LDH TTCGTTTTTCCCTCAAAGCATT
CGCCATATTGCTTGACAGCTACT
Translation initiation factor eIF-2B delta subunit GGCTGGTATCCCTTGCTCCTA
CACTTTAGTAGCCTCTTGCATTGC
Ribosomal 18S GTCTGGTTAATTCCGATAACGAACGGAACTCTA
TGCTCAATCTCGTGTGGCTAAACGCAACTTG
A L. Meistertzheim et al. Thermal stress-induced gene expression in C. gigas
FEBS Journal 274 (2007) 6392–6402 Journal compilation ª 2007 FEBS. No claim to original French government works 6399
5 lL cDNA (1 ⁄ 20 dilution) in a total volume of 20 lL,
using a 7300 Real-Time PCR System (Applied Biosystems,
Foster City, CA). The concentrations of the reaction
components were as follows: 1· Absolute QPCR SYBR
Green ROX Mix (ABgene, Epsom, UK) and 70 nm of
each primer. Oligonucleotide primer sequences used to
amplify specific gene products are shown in Table 2.
Reactions were realized with activation of Thermo-StartÒ
DNA polymerase at 95 ° C for 15 min followed by ampli-
fication of the target cDNA (45 cycles of denaturation at
95 °C for 30 s, annealing and extension at 60 °C for
1 min) and a melting curve programme from 95 to 70 °C
decreasing by 0.5 °C every 10 s. Readings were taken at
60 °C. Each run included a positive cDNA control (one
13 °C sample from the present experiment analyzed in
each amplification plate), a negative control (nonreverse-
transcribed total RNA) and blank controls (water) for
each primer pair. PCR products were then purified,
cloned and sequenced for confirmation.
For gene expression calculation, the threshold value
(Ct) was determined for each target as the number of
cycles at which the fluorescence rose appreciably above
the background fluorescence. PCR efficiency (E) was cal-
culated for each primer pair by determining the slope of
standard curves obtained from serial dilution analysis of
cDNA from different experimental samples (treatment and
control), using the method described by Yuan et al.[49].
Individual real-time PCR efficiencies (E) for target or ref-
erence genes were calculated according to: E ¼ 10
()1 ⁄ slope)
.
Results are presented here as changes in relative expres-
sion normalized to the reference gene (ribosomal 18S),
using the method described by Pfaffl [50] and determined
using the equation:
Relative expression ¼½ðE
target
Þ
DC
ttargetðcontrolÀsampleÞ
=
½ðE
ref
Þ
DC
trefðcontrolÀsampleÞ
;
where E
target
is the amplification efficiency of the target or
gene of interest, E
ref
is the amplification efficiency of the
reference (ribosomal 18S) and C
t
is the crossing threshold.
Statistical analysis
The variations in gene expression were analyzed with Stu-
dent’s t-tests between oysters exposed to 13 and 25 °C, using
statistica software (Statsoft, Maison-Alfort, France). These
statistical analyses were performed using the triplicate real-
time PCR assay values obtained for each sample; the graphs
(Fig. 2) present the mean values with standard deviations.
Acknowledgements
This research program was financially supported by
the national program PROGIG (Prolife
´
ration de
Crassostrea gigas, LITEAU II) and the PolyGIGAS
program of the Bureau des Ressources Ge
´
ne
´
tiques
(n°05 ⁄ 5210460 ⁄ YF). The authors are grateful to Helen
McCombie and Carolyn Friedman for English correc-
tions.
References
1 Hochachka PW & Somero GN (2002) Biochemical
Adaptation: Mechanism and Process in Physiological
Evolution. Oxford University Press, Oxford.
2 Podrabsky JE & Somero GN (2004) Changes in gene
expression associated with acclimation to constant tem-
peratures and fluctuating daily temperatures in an
annual killifish Austrofundulus limnaeus. J Exp Biol 207,
2237–2254.
3 Buckley BA, Gracey AY & Somero GN (2006) The cel-
lular response to heat stress in the goby Gillichthys mir-
abilis: a cDNA microarray and protein-level analysis.
J Exp Biol 209, 2660–2677.
4 Voznesensky M, Lenz PH, Spanings-Pierrot C & Towle
DW (2004) Genomic approaches to detecting thermal
stress in Calanus finmarchicus (Copepoda: Calanoida).
J Exp Mar Biol Ecol 311, 37–46.
5 Cadet P, Zhu W, Mantione KJ, Baggerman G & Stef-
ano GB (2002) Cold stress alters Mytilus edulis pedal
ganglia expression of mu opiate receptor transcripts
determined by real-time RT-PCR and morphine levels.
Brain Res 99, 26–33.
6 Buckley BA, Owen M-E & Hofmann GE (2001) Adjust-
ing the thermostat: the threshold induction temperature
for the heat-shock response in intertidal mussels (genus
Mytilus) changes as a function of thermal history.
J Exp Biol 204, 3571–3579.
7 Hamdoun AM, Cheney DP & Cherr GN (2003) Pheno-
typic plasticity of HSP70 and HSP70 gene expression in
the Pacific oyster (Crassostrea gigas): implications for
thermal limits and induction of thermal tolerance. Biol
Bull 205, 160–169.
8 Quayle OB (1969) Pacific oyster culture in British
Columbia. Fish Res Board Can Bull 167, 169–192.
9 Chavez-Villalba J, Barret J, Mingant C, Claude Co-
chard J & Le Pennec M (2002) Autumn conditioning of
the oyster Crassostrea gigas: a new approach. Aquacul-
ture 210, 171–186.
10 Chavez-Villalba J, Cochard JC, Pennec M, Barret J,
Enriquez-Diaz M & Caceres-Martinez C (2003) Effects
of temperature and feeding regimes on gametogenesis
and larval production in the oyster Crassostrea gigas.
J Shellfish Res 22, 721–731.
11 Berthelin C, Kellner K & Mathieu M (2000) Storage
metabolism in the Pacific oyster (Crassostrea gigas)in
relation to summer mortalities and reproductive cycle
(west coast of France). Comp Biochem Physiol B 125,
359–369.
Thermal stress-induced gene expression in C. gigas A L. Meistertzheim et al.
6400 FEBS Journal 274 (2007) 6392–6402 Journal compilation ª 2007 FEBS. No claim to original French government works
12 Mann R (1979) Some biochemical and physiological
aspects of growth and gametogenesis in Crassostrea
gigas and Ostrea edulis grown at sustained elevated
temperatures. J Mar Biol Assoc UK 59, 95–110.
13 Ruiz C, Abad M, Sedano F, Garcia-Martin LO &
Sanchez Lopez JL (1992) Influence of seasonal environ-
mental changes on the gamete production and biochem-
ical composition of Crassostrea gigas (Thunberg) in
suspended culture in El Grove, Galicia, Spain. J Exp
Mar Biol Ecol 155, 249–262.
14 Klose A, Zigrino P, Dennhofer R, Mauch C & Hunzel-
mann N (2006) Identification and discrimination of
extracellularly active cathepsins B and L in high-inva-
sive melanoma cells. Anal Biochem 353, 57–62.
15 Levicar N, Kos J, Blejec A, Golouh R, Vrhovec I,
Frkovic-Grazio S & Lah TT (2002) Comparison of
potential biological markers cathepsin B, cathepsin L,
stefin A and stefin B with urokinase and plasminogen
activator inhibitor-1 and clinicopathological data of
breast carcinoma patients. Cancer Detect Prev 26,
42–49.
16 Stanbridge E, Farmer A, Mills A, Loftus T, Kon-
gkasuriyachai D, Dowdy S & Weissman B (1994)
Molecular characterization of QM, a novel gene with
properties consistent with tumor suppressor function.
Cold Spring Harbor Symp Quant Biol 59, 573–576.
17 Altinok G, Powell IJ, Che M, Hormont K, Sarkar FH,
Sakr WA, Grignon D & Liao DJ (2006) Reduction of
QM protein expression correlates with tumor grade in
prostatic adenocarcinoma. Prostate Cancer Prostatic Dis
9, 77–82.
18 Tanguy A, Boutet I, Laroche J & Moraga D (2005)
Molecular identification and expression study of differ-
entially regulated genes in the Pacific oyster Crassostrea
gigas in response to pesticide exposure. FEBS J 272,
390–403.
19 Boutet I, Tanguy A & Moraga D (2004) Response of
the Pacific oyster Crassostrea gigas to hydrocarbon con-
tamination under experimental conditions. Gene 329,
147–157.
20 David E, Tanguy A, Pichavant K & Moraga D (2005)
Response of the Pacific oyster Crassostrea gigas to
hypoxia exposure under experimental conditions. FEBS
J 272, 5635–5652.
21 Kohn KW, Riss J, Aprelikova O, Weinstein JN, Pom-
mier Y & Barrett JC (2004) Properties of switch-like
bioregulatory networks studied by simulation of the
hypoxia response control system. Mol Biol Cell 15,
3042–3052.
22 Tomanek L & Somero GN (1999) Evolutionary and
acclimation-induced variation in the heat-shock
responses of congeneric marine snails (genus Tegula)
from different thermal habitats: implications for limits
of thermotolerance and biogeography. J Exp Biol 202,
2925–2936.
23 Lindquist S (1986) The heat-shock response. Annu Rev
Biochem 55, 1151–1191.
24 Parsell DA & Lindquist S (1993) The function of
heat-shock proteins in stress tolerance: degradation and
reactivation of damaged proteins. Annu Rev Genet 27,
437–496.
25 Feder ME & Hofmann GE (1999) Heat-shock proteins,
molecular chaperones, and the stress response: evolu-
tionary and ecological physiology. Annu Rev Physiol 61,
243–282.
26 Clegg JS (1998) Induced thermotolerance and the heat
shock protein-70 family in the Pacific oyster Crassostrea
gigas. Mol Mar Biol Biotech 7, 21–30.
27 Haslbeck M (2002) sHsps and their role in the chaper-
one network. Cell Mol Life Sci 59, 1649–1657.
28 Bando Y, Ogawa S, Yamauchi A, Kuwabara K, Ozawa
K, Hori O, Yanagi H, Tamatani M & Tohyama M
(2000) 150-kDa oxygen-regulated protein (ORP150)
functions as a novel molecular chaperone in MDCK
cells. Am J Physiol Cell Physiol 278, C1172–C1182.
29 Kubota H, Yokota S, Yanagi H & Yura T (1999) Struc-
tures and co-regulated expression of the genes encoding
mouse cytosolic chaperonin CCT subunits. Eur J
Biochem 262, 492–500.
30 Yokota SI, Yanagi H, Yura T & Kubota H (2000)
Upregulation of cytosolic chaperonin CCT subunits
during recovery from chemical stress that causes accu-
mulation of unfolded proteins. Eur J Biochem 267,
1658–1664.
31 Gasch AP, Spellman PT, Kao CM, Carmel-Harel O,
Eisen MB, Storz G, Botstein D & Brown PO (2000)
Genomic expression programs in the response of yeast
cells to environmental changes. Mol Biol Cell 11, 4241–
4257.
32 Monteclaro FS & Vogt PK (1993) A Jun-binding pro-
tein related to a putative tumor suppressor. Proc Natl
Acad Sci USA 90, 6726–6730.
33 Wiens M, Koziol C, Hassanein HM, Muller IM &
Muller WE (1999) A homolog of the putative tumor
suppressor QM in the sponge Suberites domuncula:
downregulation during the transition from immortal to
mortal (apoptotic) cells. Tissue Cell 31, 163–169.
34 Raychaudhuri S, Sinha M, Mukhopadhyay D & Bhat-
tacharyya NP (2007) HYPK, a Huntingtin interacting
protein, reduces aggregates and apoptosis induced by
N-terminal Huntingtin with 40 glutamines in Neuro2A
cells and exhibits chaperone like activity. Hum Mol
Genet, doi:10.1093/hmg/ddm301.
35 Tanguy A, Guo X & Ford SE (2004) Discovery of genes
expressed in response to Perkinsus marinus challenge in
Eastern (Crassostrea virginica) and Pacific (C. gigas)
oysters. Gene 338, 121–131.
36 Long GL (1976) The stereospecific distribution and evo-
lutionary significance of invertebrate lactate dehydro-
genases. Comp Biochem Physiol B 55, 77–83.
A L. Meistertzheim et al. Thermal stress-induced gene expression in C. gigas
FEBS Journal 274 (2007) 6392–6402 Journal compilation ª 2007 FEBS. No claim to original French government works 6401
37 Walsh PJ & Mommsen TP (2001) Evolutionary consid-
erations of nitrogen metabolism and excretion. Fish
Physiol 20, 1–30.
38 Bishop SH, Ellis LL & Burcham JM (1983) Amino acid
metabolism in molluscs. Mollusca 1, 243–327.
39 Hiong KC, Peh WYX, Loong AM, Wong WP, Chew
SF & Ip YK (2004) Exposure to air, but not seawater,
increases the glutamine content and the glutamine syn-
thetase activity in the marsh clam Polymesoda expansa.
J Exp Biol 207, 4605–4614.
40 Tocher DR, Leaver MJ & Hodgson PA (1998) Recent
advances in the biochemistry and molecular biology of
fatty acyl desaturases. Prog Lipid Res 37, 73–117.
41 Nakamura MT & Nara TY (2004) Structure, function,
and dietary regulation of delta6, delta5, and delta9
desaturases. Annu Rev Nutr 24, 345–376.
42 Kraffe E, Marty Y & Guderley H (2007) Changes in
mitochondrial oxidative capacities during thermal accli-
mation of rainbow trout Oncorhynchus mykiss: roles of
membrane proteins, phospholipids and their fatty acid
compositions. J Exp Biol 210, 149–165.
43 Abele D, Heise K, Portner HO & Puntarulo S (2002)
Temperature-dependence of mitochondrial function and
production of reactive oxygen species in the intertidal
mud clam Mya arenaria. J Exp Biol 205, 1831–1841.
44 Kaur M, Atif F, Ali M, Rehman H & Raisuddin S
(2005) Heat stress-induced alterations of antioxidants in
the freshwater fish Channa punctata Bloch. J Fish Biol
67, 1653–1665.
45 Fisher AB, Dodia C, Manevich Y, Chen JW & Fein-
stein SI (1999) Phospholipid hydroperoxides are sub-
strates for non-selenium glutathione peroxidase. J Biol
Chem 274, 21326–21334.
46 Abele D & Puntarulo S (2004) Formation of reactive
species and induction of antioxidant defence systems in
polar and temperate marine invertebrates and fish.
Comp Biochem Physiol A 138, 405–415.
47 Heise K, Puntarulo S, Portner HO & Abele D (2003)
Production of reactive oxygen species by isolated mito-
chondria of the Antarctic bivalve Laternula elliptica
(King and Broderip) under heat stress. Comp Biochem
Physiol C 134, 79–90.
48 Heise K, Puntarulo S, Nikinmaa M, Abele D & Portner
HO (2006) Oxidative stress during stressful heat expo-
sure and recovery in the North Sea eelpout Zoarces
viviparus L. J Exp Biol 209, 353–363.
49 Yuan JS, Reed A, Chen F & Stewart CN Jr (2006)
Statistical analysis of real-time PCR data. BMC
Bioinformatics 7, 85–97.
50 Pfaffl MW (2001) A new mathematical model for rela-
tive quantification in real-time RT-PCR. Nucleic Acids
Res 29, 2003–2007.
Supplementary material
The following supplementary material is available
online:
Table S1. Genes identified after 7–10 days at 25 °C.
Table S2. Genes identified after 7–10 days at 13 °C.
Table S3. Genes identified after 24 days at 25 °C.
Table S4. Genes identified after 24 days at 13 °C.
This material is available as part of the online article
from
Please note: Blackwell Publishing is not responsible
for the content or functionality of any supplementary
materials supplied by the authors. Any queries (other
than missing material) should be directed to the corre-
sponding author for the article.
Thermal stress-induced gene expression in C. gigas A L. Meistertzheim et al.
6402 FEBS Journal 274 (2007) 6392–6402 Journal compilation ª 2007 FEBS. No claim to original French government works