Tài liệu Báo cáo khoa học: Kinetic characterization of the first step of the ribozyme-catalyzed trans excision-splicing reaction docx
Bạn đang xem bản rút gọn của tài liệu. Xem và tải ngay bản đầy đủ của tài liệu tại đây (455.83 KB, 13 trang )
Kinetic characterization of the first step of the
ribozyme-catalyzed trans excision-splicing reaction
P. Patrick Dotson II*, Joy Sinha* and Stephen M. Testa
Department of Chemistry, University of Kentucky, Lexington, KY, USA
We previously reported that a group I intron-derived
ribozyme from Pneumocystis carinii can catalyze the
excision of a targeted sequence from within an RNA
transcript [1]. This reaction, called trans excision-
splicing (TES), consists of two steps: substrate cleav-
age (an intramolecular transesterification reaction)
followed by exon ligation (Fig. 1). In the substrate-
cleavage reaction, the phosphodiester backbone of an
intermolecular substrate is cleaved via nucleophilic
attack by the 3¢ terminal guanosine (G336), generat-
ing 5¢ and 3¢ exon intermediates [1a]. In the exon-liga-
tion step, the nucleophilic 5¢ exon intermediate
attacks a phosphodiester backbone position within
the 3¢ exon intermediate, simultaneously ligating the
exons together and excising the internal segment. The
substrate-cleavage reaction step is analogous to the 5¢
splice-site cleavage reaction in self-splicing [2], except
that self-splicing utilizes an exogenous guanosine
cofactor as the nucleophile. The TES substrate-clea-
vage reaction is also directly analogous to the natu-
rally occurring self-cyclization reaction, which results
in the formation of full-length or truncated circular
group I introns, in that they both utilize the 3¢ termi-
nal guanosine of the intron (or ribozyme) as nucleo-
philes [3–5].
Several studies have dissected the individual steps of
RNA-catalyzed reactions through the establishment of
kinetic frameworks [6–19]. This approach has been
mechanistically informative and has greatly advanced
our understanding of the chemical basis of RNA
Keywords
group I intron; ribozyme; RNA; self-splicing;
trans excission-splicing
Correspondence
S. M. Testa, Department of Chemistry,
University of Kentucky, Lexington, KY
40506, USA
Fax: +1 859 323 1069
Tel: +1 859 257 7076
E-mail:
*These authors contributed equally to this
work
(Received 3 March 2008, revised 7 April
2008, accepted 14 April 2008)
doi:10.1111/j.1742-4658.2008.06464.x
Group I introns catalyze the self-splicing reaction, and their derived ribo-
zymes are frequently used as model systems for the study of RNA folding
and catalysis, as well as for the development of non-native catalytic
reactions. Utilizing a group I intron-derived ribozyme from Pneumocystis
carinii, we previously reported a non-native reaction termed trans excision-
splicing (TES). In this reaction, an internal segment of RNA is excised
from an RNA substrate, resulting in the covalent reattachment of the
flanking regions. TES proceeds through two consecutive phosphotranseste-
rification reactions, which are similar to the reaction steps of self-splicing.
One key difference is that TES utilizes the 3¢-terminal guanosine of the
ribozyme as the first-step nucleophile, whereas self-splicing utilizes an exog-
enous guanosine. To further aid in our understanding of ribozyme reac-
tions, a kinetic framework for the first reaction step (substrate cleavage)
was established. The results demonstrate that the substrate binds to the
ribozyme at a rate expected for simple helix formation. In addition, the
rate constant for the first step of the TES reaction is more than one order
of magnitude lower than the analogous step in self-splicing. Results also
suggest that a conformational change, likely similar to that in self-splicing,
exists between the two reaction steps of TES. Finally, multiple turnover is
curtailed because dissociation of the cleavage product is slower than the
rate of chemistry.
Abbreviations
GBS, guanosine-binding site; RE1, recognition element 1; RE2, recognition element 2; RE3, recognition element 3; TES, trans
excision-splicing.
3110 FEBS Journal 275 (2008) 3110–3122 ª 2008 The Authors Journal compilation ª 2008 FEBS
catalysis. The fine details regarding the mechanism by
which the first step of the TES reaction occurs is lar-
gely unknown. In addition, little is known regarding
the kinetics of 3¢ terminal guanosine-catalyzed reac-
tions. Therefore, a minimal kinetic framework for this
substrate-cleavage reaction was established (Fig. 2).
There are multiple conclusions drawn from this
kinetic framework as they relate to the TES reaction.
The rate constant for the substrate-cleavage reaction is
$ 60-fold lower than that reported for the first step of
the self-splicing reaction using a Tetrahymena thermo-
phila ribozyme, regardless of whether an intermolecular
or intramolecular guanosine is being utilized as the
first-step nucleophile [6,15]. The rate constant for the
first step of the TES reaction is only fourfold greater
than that for substrate dissociation. Furthermore,
multiple turnover is curtailed because dissociation of
the cleavage product is slower than the rate of cleavage.
Lastly, the results indicate that a conformational
change exists between the two steps of the TES reac-
tion. Taken together, these results further demonstrate
how group I intron-derived ribozymes exploit native
recognition elements and catalytic sites to catalyze
non-native, multi-step reactions.
Results
A kinetic scheme for the substrate-cleavage reaction,
which is reaction step 1 in Fig. 1, is summarized in
Fig. 2. One complication in studying the substrate-
cleavage reaction is that the second reaction step of
TES (exon–ligation) proceeds immediately after the
first step [20]. To prevent the second reaction step
while allowing the first, we previously utilized a sub-
strate with a deoxyguanosine at the second step reac-
tion site, [r(5 ¢ -AUGACUdGCUC-3¢)], which prevents
the second reaction step [1a]. We found that the
observed rate constant for the substrate-cleavage
reaction using the deoxyguanosine substrate (k
obs
=
3 ± 0.5Æmin
)1
) is comparable, within error, to the
normal substrate (k
obs
= 3.7 ± 0.2Æmin
)1
l; data not
G
(RE3)
U
A
a
5′
U
U
A
a
u
g
a
c
u
U
A
G
G
A
U
5′
G
c
u
c
a
u
g
a
c
u
U
A
G
(RE2)
-3′
5′-a
-6
u
-5
g
-4
a
-3
c
-2
u
-1
g
1
c
2
u
3
c
4
5′ augacucuc 3′
Product dissociation
Ribozyme binding
Substrate cleavage
P1
(RE1)
P1
(RE1)
P10
(RE3)
P10
(RE3)
A
G
5′
G
C
5′
c
u
c
c
u
c
3′
Ribozyme
P1
(RE1)
1P1P
(RE1)
(RE2)
u
g
a
c
u
A
G
U
G
5′
G
C
A
U
3′
(10-mer substrate)
Step 1
Ribozyme
P1
(RE1)
P1
(RE1)
P10
(RE3)
(RE2)
A
G
U
G
5′
C
3′
Ribozyme
Step 2
Exon ligation
(9-mer
p
roduct)
G
g
1
g
1
G
G
u
c
c
g
1
u
c
c
3′
g
1
g
1
g
1
Fig. 1. Schematic of the two-step TES reaction. The rPC ribozyme
is in uppercase lettering and, the 10-mer substrate is in lowercase
lettering, and the ribozyme recognition elements recognition ele-
ment RE1 and RE3 base pair with the substrate to form helices P1
and P10, respectively. Note that recognition elements RE1, RE2
and RE3 are so named because they correspond to the regions in
self-splicing introns that bind the exon substrates. The sites of
catalysis for the first step (substrate cleavage) and the second step
(exon ligation) are shown with arrows, and the guanosine to be
excised (G
1
) is circled. The diagram shows only the recognition
elements of the ribozyme.
P. P. Dotson II et al. Kinetics of the trans excision-splicing reaction
FEBS Journal 275 (2008) 3110–3122 ª 2008 The Authors Journal compilation ª 2008 FEBS 3111
shown). Note that the k
obs
value of the normal reac-
tion is in reasonable agreement with the previously
reported value of 4Æmin
)1
[1]. Therefore, the deoxy-
guanosine substrate reasonably mimics the normal
substrate as a first reaction step substrate. Impor-
tantly, this substrate inhibits the exon-ligation step,
allowing us to isolate and analyze only the first reac-
tion step.
Observed rate constants for substrate cleavage,
k
obs
and k
2
Experiments under ribozyme excess conditions were
used to determine the pseudo-first-order rate constant
for the substrate-cleavage reaction. Note that under
these reaction conditions the ribozyme–product com-
plex is denatured upon addition of stop buffer, and so
product dissociation is not observable. Therefore, these
experiments measure the rate of substrate cleavage
from the ribozyme–substrate complex.
The observed rate constants (k
obs
) were measured in
reactions containing various ribozyme concentrations
(5–300 nm) and 1.3 nm of 5¢-end radiolabeled substrate
(Fig. 3A,B). As seen in Fig. 3C, the observed rate con-
stants at the higher ribozyme concentrations (100–
350 nm) are independent of ribozyme concentration,
indicating that saturation of the ribozyme has
been reached. Values of k
2
= 4.1 ± 0.5Æmin
)1
and
K
M
= 102 ± 0.4 nm were obtained by fitting the aver-
age k
obs
values to the Michaelis–Menten equation.
Herein, k
2
represents the maximum first-order rate of
substrate cleavage under single turnover conditions.
For lower ribozyme concentrations (5–40 nm) the k
obs
values for the substrate-cleavage reactions increase
linearly with ribozyme concentration. This linear
dependence reflects the apparent second-order rate
constant, k
2
⁄ K
M
, and the slope gives a value of (2.8 ±
0.5) · 10
7
Æm
)1
Æmin
)1
(Fig. 3C, inset). Note that the
values obtained are similar to those reported previ-
ously for group I intron-derived ribozymes (Table 1)
[14,17,21].
Dependence of substrate cleavage on pH
It has been reported that the rate of the substrate-
cleavage step in Tetrahymena [22–25], Anabaena [14]
and Azoarcus [17] group I introns, as well as reaction
steps for some small ribozymes [26–28], show a log-
linear increase in the reaction rate constant with
increasing pH in the acid range (up to pH 7). This is
consistent with a single deprotonation step that takes
place prior to the actual cleavage reaction [29]. This is
also consistent with the observed rate constant at a
given pH being equivalent to the rate constant of the
chemical step at that pH. This was investigated for the
Pneumocystis ribozyme by measuring the pH depen-
dence of the observed rate constant of the substrate-
cleavage reaction. As seen in Fig. 4, the logarithm of
the observed rate constant increases linearly with pH
in the range 5–7 (slope = 0.5 ± 0.03), but not at
higher pH values. In the case of the Tetrahymena
group I intron-derived ribozyme, such non-linear
behavior was attributed to a pH-dependent conforma-
tional change occurring within the ribozyme [24,25].
This conformational change thus sets a limit on the
observed rate constant of cleavage (k
2
), even though
the rate constant of chemistry (k
c
) is expected to con-
tinue to increase with increasing pH [24,25]. Appar-
ently, for our substrate-cleavage reaction, the rate of
the chemical step is being masked by a conformational
change, and so k
2
is not equivalent to k
c
. The rate of
chemistry (k
c
), however, can be approximated by
extrapolating the log-linear increase that occurs
between pH 5 and 7 to higher pH values. In our case,
k
c
is then approximately equal to 5.7 ± 1.1Æ min
)1
at
pH 7.5 (Fig. 4).
Control experiments were run to determine whether
the observed rate constants shown in Fig. 4 were being
influenced by the specific buffers utilized in the respec-
tive reactions. We found that the values obtained using
Mes and Hepes at pH 6.8 were within 1 SD of each
other. This was also true using Hepes and Epps at
pH 7.5. Apparently, there is not a buffer-specific effect
E
E
*S
k
2
= 4.1 min
–1
k
1
= 1 x 10
7
M
–1
·
min
–1
k
–1
= 0.9 min
–1
k
–3
= 0.09 min
–1
k
3
= 3.5 x 10
3
M
–1
·min
–1
E + P
K
d
P
= 69 nMK
d
S
= 90 nM
k
c
= 5.7 min
–1
E
P
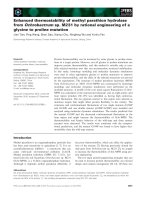
Fig. 2. Kinetic scheme for the substrate-cleavage reaction. E denotes the rPC ribozyme, S denotes the 10-mer substrate, and P denotes the
6-mer cleavage product. All rate and equilibrium constants were measured or calculated (boxed values) in this report. The scheme includes
rate constants for substrate association (k
1
) and dissociation (k
)1
), cleavage (k
2
), and product association (k
3
) and dissociation (k
)3
). Note that
the observed rate constant for the cleavage step (k
2
) is distinguishable from the actual rate constant for chemistry (k
c
). The scheme also
includes equilibrium constants for substrate (K
d
S
) and product (K
d
P
) dissociation.
Kinetics of the trans excision-splicing reaction P. P. Dotson II et al.
3112 FEBS Journal 275 (2008) 3110–3122 ª 2008 The Authors Journal compilation ª 2008 FEBS
on the observed rate constants (k
obs
). Note that we
have not examined the rates of substrate cleavage
outside the pH range depicted because protonation or
deprotonation of nucleotides is expected to cause
general chemical denaturation of the ribozyme [30].
Rate constant for substrate dissociation, k
)
1
The upper limit of the rate constant for substrate
dissociation was measured in a pulse–chase experiment
(Fig. 5A). In this experiment, the time chosen for t
1
(30 s) was such that a significant fraction of substrate
would remain unreacted. After the addition of the
chase, which in this case is dilution with buffer, aliqu-
ots were removed at designated times (defined as t
2
)up
to 15 min. An otherwise identical reaction, but without
the added chase, was carried out in parallel. The ribo-
zyme–substrate complex will decay through substrate
cleavage (k
2
) and dissociation (k
)1
). Therefore, measur-
ing the observed rate constant during the chase phase
will reflect both substrate cleavage and dissociation.
This is summarized by: k
obs, chase
= k
2
+ k
)1
[6,9].
Note that in this experiment k
2
= k
obs, no-chase
.
The observed rate constants for the chase reaction
(k
obs, chase
= 2.5 ± 0.04Æmin
)1
) and in the reaction
without added chase (k
obs, no-chase
= 1.5 ± 0.01Æmin
)1
)
were obtained from a single-exponential fit of product
formation against t
2
(Fig. 5B). The substrate dissocia-
tion rate constant (k
)1
= 0.9 ± 0.04Æmin
)1
) was then
determined using Eqn (2) (see Experimental proce-
dures). Note that k
)1
is comparable in value to the
cleavage step (k
2
), implying that the ribozyme–
substrate complex does not reach equilibrium with free
ribozyme prior to the cleavage step.
Rate constant for substrate association, k
1
The kinetic data indicate that substrate dissociation is
comparable in value to the cleavage step. This implies
that the second-order rate constant for substrate
cleavage, k
2
⁄ K
M
, will be a combination of substrate
association (k
1
), dissociation ( k
)1
) and cleavage (k
2
)
steps. Thus, the second-order rate constant can be
represented as k
2
⁄ K
M
= k
1
k
2
⁄ (k
)1
+ k
2
) [31]. As
discussed earlier, a value of 2.8 · 10
7
Æm
)1
Æmin
)1
was
obtained for the second order rate constant k
2
⁄ K
M
.
Using this value of k
2
⁄ K
M
and the values of k
2
and
k
)1
(4.1Æmin
)1
and 0.9Æmin
)1
respectively), the calcu-
lated value of k
1
is 3.4 · 10
7
Æm
)1
Æmin
)1
.
For confirmation, k
1
was directly measured in a
pulse–chase experiment (Fig. 5A). In this case, various
concentrations of ribozyme and radiolabeled substrate
were combined for varying times, t
l
(15–120 s). During
the pulse phase, t
1
, the concentrations of the ribozyme,
substrate and ribozyme–substrate complex are
predicted to approach equilibrium, where the rate of
Time (min)
0.25 min
0.5
0.75
1
2
3
4
5
10
15 min
Substrate
Product
% Product
(+) Buffer
Ribozyme (nM)
k
obs
(min
–1
)
0
1
2
3
0 100 200 300
0
0.5
1
1.5
0 1020304050
Ribozyme (nM)
k
obs
(min
-1
))
A
B
C
Fig. 3. Substrate-cleavage reactions. All reactions were conducted
in H10Mg buffer. (A) Representative polyacrylamide gel with the
5¢-end labeled substrate and 166 n
M rPC ribozyme. The positions of
the substrate and the substrate-cleavage product on the gel are
labeled. The lane marked (+) buffer contains a 15-min reaction in
the absence of the ribozyme. (B) Representative plot of the sub-
strate-cleavage reaction at ribozyme concentrations of 5 n
M ( ),
10 n
M (s), 20 nM (h), 40 nM (e), 166 nM (D) and 300 nM (d).
Observed rate constants (k
obs
) were obtained from these plots and
are the average of two independent assays. All data points between
the two independent assays have a standard deviation < 15%.
(C) Non-linear least squares fit to the Michaelis–Menten equation of
the average k
obs
values from (B) versus ribozyme concentration
(0–350 n
M). The plot resulted in a value of k
2
= 4.1 ± 0.5Æmin
)1
and
K
M
= 102 ± 0.4 nM respectively. These values are the average of
the two independent assays. The inset shows a representative plot
of the average k
obs
values from (B) versus ribozyme concentration
(5–40 n
M). The resulting k
2
⁄ K
M
value (2.8 ± 0.5 · 10
7
ÆM
)1
Æmin
)1
)is
the average of the two independent assays.
P. P. Dotson II et al. Kinetics of the trans excision-splicing reaction
FEBS Journal 275 (2008) 3110–3122 ª 2008 The Authors Journal compilation ª 2008 FEBS 3113
substrate association equals substrate dissociation [6,9].
For the chase phase, the mixtures were then incubated
for a time t
2
= 15 min, which ensures that essentially
every substrate molecule that binds to the ribozyme
during t
l
is converted to product. Therefore, the
amount of product formed during the chase period is
representative of the amount of ribozyme–substrate
complex formed during t
1
. Note, however, that if
k
)1
$ k
2
, then both processes will be occurring during
t
2
. The amount of product formed was plot against
time t
1
(Fig. 6A). The k
obs
values reflect the rate of
approach to equilibrium of the ribozyme–substrate
complex formation, which is represented by k
obs
= k
1
[E]+k
)1
[6,9]. The slope of the plot of k
obs
versus
ribozyme concentration gives the rate of substrate
association, k
l
= (1 ± 0.01) · 10
7
Æm
)1
Æmin
-l
(Fig. 6B),
which is in reasonable agreement (for ribozyme reac-
tions) with the calculated value above.
Reversibility of the substrate-cleavage reaction
Under single-turnover conditions, the first-order rate
constant (k
2
) of the substrate-cleavage reaction is
4.1Æmin
)1
(Fig. 2), with a typical end point of 70–80%.
Over the period of 15–60 min, this end point does not
change, indicating that either an internal equilibrium
Table 1. Kinetic parameters for group I intron-derived ribozyme
reactions. The k
cat
values correspond to the k
2
values reported
throughout this text.
Ribozyme origin
k
cat
(min
)1
)
k
cat
⁄ K
M
(M
)1
Æmin
)1
)
K
M
S
(lM)
k
c
(min
)1
)
Pneumocystis carinii
a
4.1 2.8 · 10
7
0.102 5.7
Tetrahymena thermophila
b
0.1 9 · 10
7
0.001 350
Anabaena PCC7120
c
4.0 2.9 · 10
5
15 4.0
Azoarcus sp. BH72
d
0.38 8.5 · 10
5
0.45 –
a
Substrate-cleavage reaction (endogenous guanosine-mediated) for
the Pneumocystis ribozyme (rPC) with 10 m
M MgCl
2
,25mM Hepes
(pH 7.5) and substrate (5¢-AUGACUdGCUC-3¢)at44°C.
b
Substrate-
cleavage reaction (exogenous guanosine-mediated) of the Tetrahy-
mena ribozyme (L21-ScaI) with 0.5 m
M guanosine, 10 mM MgCl
2
,
50 m
M Mes (pH 7) and substrate (5¢-G
2
CCCUCUAAAAA-3¢)at50°C
[6].
c
Substrate-cleavage reaction (exogenous guanosine-mediated)
of the substrate (5¢-CUUAAAAA-3¢) using the Anabaena ribozyme
(L-8 HH) with 2 m
M guanosine, 15 mM MgCl
2
,25mM Hepes
(pH 7.5) at 32 °C [14].
d
Substrate-cleavage reaction (exogenous
guanosine-mediated) of Azoarcus ribozyme (L-10 HH) with 1 m
M
guanosine, 15 mM MgCl
2
,25mM Hepes (pH 7.5) and substrate
(5¢-CAUAAA-3¢)at30°C [17].
–1
–0.5
0
0.5
1
45678910
log k
obs
pH
Fig. 4. pH dependence of the observed rate of substrate cleavage.
Values for k
obs
were obtained from single-turnover reactions at
44 °C using 166 n
M ribozyme, 1.3 nM 5¢-end labeled substrate in
buffer containing 135 m
M KCl and 10 mM MgCl
2
. The buffers used
for this study were 50 m
M Mes (pH 5.0–6.8), 50 mM Hepes
(pH 7.0, 7.5) or 50 m
M Epps (pH 8.0, 8.5). Each rate is the average
of two independent measurements and has a standard deviation
< 15%. The solid line represents the log-linear increase in the data
set from pH of 5–7 (slope = 0.5 ± 0.03). The extrapolation of the
line to pH 7.5 (depicted by dashed lines) gives a value of
0.75 ± 0.1 which corresponds to rate of chemistry (k
c
)of
5.7 ± 1.1Æmin
)1
.
Time (min)
% Product during t
2
0
10
20
30
0246810121416
A
B
Fig. 5. Determination of the rate constant for substrate dissocia-
tion, k
)1
. (A) Scheme of the pulse–chase experiment, which was
conducted in H10Mg buffer at 44 °C and 166 n
M ribozyme. The
chase was initiated by diluting the reaction mixture with H10Mg
buffer. (B) Representative plot of cleaved substrate, after t
1
, versus
time (t
2
) with chase (closed circles) and without added chase (open
circles). The resultant first-order rate constants obtained
with (k
obs, chase
= 2.5 ± 0.04Æmin
)1
) and without (k
obs, no-chase
=
1.5 ± 0.01Æmin
)1
) the chase are the average of two independent
assays. All data points between the two independent assays have
a standard deviation < 10%. From this data, the rate of substrate
dissociation, k
)1
, is 0.9 ± 0.04Æmin
)1
.
Kinetics of the trans excision-splicing reaction P. P. Dotson II et al.
3114 FEBS Journal 275 (2008) 3110–3122 ª 2008 The Authors Journal compilation ª 2008 FEBS
exists between ribozyme–substrate and ribozyme–
product complexes or only 70–80% of the substrate is
reactive. Such an internal equilibrium has previously
been identified in a G-dependent substrate-cleavage
reaction with Anabaena and Tetrahymena ribozymes
[14,15]. Therefore, a pulse–chase experiment was con-
ducted such that this equilibrium, if occurring, could
be disturbed and thus detected [15]. In this assay, the
substrate-cleavage reaction was allowed to proceed to
completion and then an excess of unlabeled 5¢ exon
mimic was added (Fig. 7A). Addition of a large excess
of unlabeled 5¢ exon mimic is expected to prevent
rebinding of any dissociated radiolabeled substrate or
radiolabeled 5¢ exon reaction product. The result
(Fig. 7B) shows that a substantial fraction of the
bound radiolabeled product can be converted back to
radiolabeled substrate, hence an internal equilibrium
exists. Furthermore, the results imply that product
dissociation is slower than or similar to substrate dis-
sociation [15].
Equilibrium dissociation constant of the
substrate-cleavage product, K
d
P
and
substrate, K
d
S
A trace amount of 5¢-end radiolabeled substrate-
cleavage product (the 6-mer) was incubated with vari-
ous concentrations of ribozyme for 90 min at 44 °Cin
H10Mg buffer, and the ribozyme–product complex
was then partitioned from the unbound product
on a native polyacrylamide gel [10]. The equilibrium
dissociation constant of the 5¢ exon product
(K
d
P
=69±6nm) was then determined from a plot
(Fig. 8) of the fraction product bound versus ribozyme
concentration [32,33]. For the equilibrium dissociation
constant of the substrate, K
d
S
, an estimated value can
be obtained from the equation K
d
S
=(k
)1
⁄ k
1
)=
90 nm [19].
Time (min)
% Substrate
0
20
40
60
80
100
0 50 100 150
A
B
Fig. 7. Substrate-cleavage products undergo the reverse reaction.
(A) Scheme of the pulse–chase experiment, which was conducted
using 166 n
M ribozyme and a trace amount of 5¢-end labeled sub-
strate in H10Mg buffer at 44 °C. The reaction was allowed to pro-
ceed for 15 min (t
1
), followed by the addition of excess unlabeled
5¢ exon product as the chase. (B) A plot of the disappearance of
substrate in a normal reaction (no chase, closed circles) and reap-
pearance of the substrate in the presence of chase (open circles).
Each point on the plot is the average of two independent experi-
ments, and have a SD of < 15%. Note that the error bars present
on the graph are too small to be statistically relevant.
Time (t
1
) (min)
% Product
Ribozyme (nM)
k
obs
(min
–1
)
0
20
40
60
0120.5 1.5
0
1
2
3
0 50 100 150 200 250
A
B
Fig. 6. Determination of the rate constant for substrate associa-
tion, k
1
. (A) Representative plot of pulse–chase experiments in
H10Mg buffer at 44 °C with five different ribozyme concentrations:
30 n
M (s), 50 nM ( ), 100 nM (e), 150 nM (r) and 200 nM (d).
All data points between the two independent assays have a
standard deviation < 10%. (B) Representative plot of the k
obs
values against ribozyme concentration. The line is fit to the
equation k
obs
= k
1
[E]+k
)1
and the substrate association rate
(k
1
= 1 ± 0.01 · 10
7
ÆM
)1
Æmin
-l
) was calculated from the slope. Note
that the error bars present on the graph are too small to be statisti-
cally relevant.
P. P. Dotson II et al. Kinetics of the trans excision-splicing reaction
FEBS Journal 275 (2008) 3110–3122 ª 2008 The Authors Journal compilation ª 2008 FEBS 3115
Rate constant for dissociation of the 5¢ exon
product, k
)
3
The product dissociation rate constant (k
)3
) was deter-
mined using a pulse–chase assay (Fig. 9A), combined
with native PAGE. In this assay, an excess of ribo-
zyme was mixed with 1.3 nm 5¢-end labeled 5¢ exon
mimic, which was then incubated in H10Mg buffer
containing 3.4% glycerol at 44 °C for 30 min. An
excess amount of unlabeled 5¢ product was then added
to initiate the chase, and aliquots were removed at des-
ignated times. These aliquots were directly loaded onto
a running native polyacrylamide gel to isolate the
bound and unbound fractions. For quantification, the
amount of product not bound after the chase was sub-
tracted from that at time t
1
, which yields the amount
of product dissociated due to the chase. The rate of
product dissociation (k
)3
= 0.09 ± 0.05Æmin
)1
) was
then obtained from fitting Eqn (1) to a single expo-
nential function (Fig. 9B). Apparently, product diss-
ociation is slower than substrate dissociation, which
has previously been shown for a Tetrahymena ribo-
zyme [6].
Discussion
In this report, a kinetic framework for the first step of
the TES reaction was obtained. Although the TES
reaction is not known to occur in nature, the full-
length circularization reaction, which does occur natu-
rally, has mechanistic similarities [3–5]. Perhaps most
importantly, both reactions utilize a 3¢ terminal guano-
sine as a nucleophile to attack the 5¢ splice site (sub-
strate-cleavage site). Furthermore, neither reaction
requires an exogenous guanosine cofactor, which is
standard for self-splicing reactions. Finally, neither
reaction is dependent on the formation of helix P10
for the 5¢ splice site cleavage reaction (see Fig. 1).
Note that in these studies, deoxyribose-containing
substrates were used to isolate the first reaction step
(substrate cleavage) by preventing the second reaction
step (exon ligation). In addition, the product of the
first reaction step is actually the intermediate in the full
TES reaction.
Substrate binding
The rate constant for the substrate binding the Pneu-
mocystis ribozyme, k
1
, is far below the diffusional limit
of 10
11
Æm
)1
Æmin
)1
for the collision of small molecules
[34]. Thus, unlike classical enzymes which react near
diffusion-controlled limits [31,35–37], the Pneumocystis
Time (min)
% Unbound product
0
5
10
15
20
0 102030405060
A
B
Fig. 9. Determination of the rate constant for dissociation of the 5¢
exon product, k
)3
. (A) Scheme of the pulse–chase experiment con-
ducted with rPC ribozyme and 5¢-end labeled 5¢ exon mimic in
H10Mg buffer containing 3.4% glycerol at 44 °C. In this reaction
t
1
= 30 min. Excess unlabeled 5¢ exon mimic was added to initiate
the chase, and product dissociation was followed by native band-
shift gel electrophoresis. (B) Representative plot of the fraction of
unbound product versus chase time, t
2
. The rate of product dissoci-
ation, k
)3
, is 0.09 ± 0.05Æmin
)1
, which is the average of two inde-
pendent assays with each data point having a standard deviation
typically < 20%.
Ribozyme (nM)
% Product bound
0
20
40
60
0 50 100 150 200 250
Fig. 8. Determination of the equilibrium dissociation constant of
the substrate-cleavage product, K
d
P
. In the reaction, various con-
centrations of ribozyme were mixed with trace amounts of 5¢-end
radiolabeled substrate-cleavage product in H10Mg buffer containing
3.4% glycerol. Shown is a representative plot of the percent sub-
strate-cleavage product bound to the ribozyme versus ribozyme
concentration. The resultant value of K
d
P
is 69 ± 6 nM is the aver-
age of two independent assays with each data point having a stan-
dard deviation < 15%.
Kinetics of the trans excision-splicing reaction P. P. Dotson II et al.
3116 FEBS Journal 275 (2008) 3110–3122 ª 2008 The Authors Journal compilation ª 2008 FEBS
ribozyme is not under diffusion control. This value,
however, is within the range (10
7
–10
9
Æm
)1
Æmin
)1
)
expected for the formation of RNA duplexes [38–42],
as seen with other ribozymes [6,8,13,18,19,43]. Thus,
the rate of assembly of the Pneumocystis ribozyme–
substrate complex appears to be limited by the process
of helix formation. Nevertheless, because k
2
⁄ K
M
(k
2
=
4.1Æmin
)1
and K
M
= 102 nm respectively) approaches
the rate of substrate association, catalysis can be
expected to occur about as fast as base-pairing
between the ribozyme and substrate. This is typical of
ribozymes that bind their substrates through double
helices [6,13,16,19,44].
Substrate cleavage
The observed rate constant for the substrate-cleavage
reaction, k
2
, under single turnover conditions is
4.1Æmin
)1
. Although the true rate constant for the
actual chemical step is being masked, probably by a
local conformational change that occurs after substrate
binding and before the actual chemical step, this rate
is approximately four times faster than the rate con-
stant for substrate dissociation (k
)1
= 0.9Æmin
)1
).
Therefore, although the substrate is more likely to
react than it is to dissociate, the similar order of
magnitude suggests that a non-trivial fraction of the
substrate will dissociate before the substrate-cleavage
reaction occurs.
The ‘catalytic power’ of an RNA-cleaving ribozyme
can be estimated by comparing the observed rate
constant of a catalyzed reaction with that of an
equivalent uncatalyzed reaction. Under simulated
physiological conditions, the uncatalyzed rate constant
of the phosphotransesterification reaction (k
noncat
)is
estimated to be 10
)9
Æmin
)1
[6,45]. Thus, a rate of
4.1Æmin
)1
for the substrate-cleavage reaction repre-
sents a catalytic rate enhancement (k
2
⁄ k
noncat
)of
$ 10
9
-fold. This rate enhancement also corresponds
to $ 13 kcalÆmol
)1
of transition-state stabilization
according to the following equation: DG° = )RT
ln (k
2
⁄ k
noncat
), as discussed [6].
It was previously reported that a Tetrahymena ribo-
zyme can also catalyze a 3¢ terminal guanosine-medi-
ated substrate-cleavage reaction [3,4,15,46]. In one
such study [15], the 3¢ terminal guanosine catalyzed
reaction was reported to behave similar to the exoge-
nous guanosine catalyzed reaction, for which
k
c
= 350Æmin
)1
[6]. In comparison, the P. carinii
endogenous reaction is $ 60-fold slower (k
c
=
5.7 min
)1
; Table 1). This substantial difference might
be due to the Tetrahymena ribozyme being faster than
the Pneumocystis ribozyme, the difference in reaction
conditions, or that the intramolecular guanosine nucle-
ophile in the Pneumocystis ribozyme, although bound
to the guanosine-binding site (GBS), is not bound in
an ideal orientation. Indeed, this last idea may be sup-
ported in that proper alignment of the intramolecular
guanosine nucleophile with respect to the Pneumocystis
ribozyme could be hindered by the absence of a P9.0
helix interaction, which is predicted to align the intra-
molecular guanosine into the GBS [15].
The observed rate constant of substrate cleavage
shows pH independence between pH 7 and 8.5,
implying that in this range the rate of chemistry
associated with substrate cleavage is masked by a
conformational change. The simplest interpretation
of this result is that the rate of substrate cleavage is
not equivalent to the rate of chemistry, and that the
rate of chemistry (extrapolated to be k
c
= 5.7Æmin
)1
)
is faster than the rate of substrate cleavage (mea-
sured to be k
2
= 4.1Æmin
)1
). Note that the nature of
the conformational change is unknown with respect
to the substrate-cleavage reaction, including any spe-
cific rate constants associated with it, and so it is
not included as a separate step in the reaction
scheme (Fig. 2).
Product dissociation
For the fraction of substrates that do undergo the
reaction, the resultant products dissociate from
the ribozyme relatively slowly on the time scale of
the reaction. Furthermore, dissociation of the 5¢ exon
product is slower than the cleavage step (by $ 75-
fold), which significantly impedes the ribozyme from
catalyzing multiple turnover reactions. Of course, the
5¢ exon product of the cleavage reaction is an inter-
mediate in the complete TES reaction, and so slow
product dissociation is beneficial for the TES reac-
tion as a whole. In addition, the product off-rate,
k
)3
, is 20-fold slower than the substrate off-rate, k
)1
.
It was also found in a Tetrahymena ribozyme [6,47]
that the product off-rate is slower than the substrate
off-rate, although in Tetrahymena there is only a
twofold difference. Apparently, there are additional
or more stable interactions that the ribozyme uses to
bind the product relative to the ribozyme binding
the substrate. This is perhaps due to destabilization
of substrate binding via positioning of the 3¢-bridg-
ing phosphoryl oxygen at the cleavage site next to a
required Mg ion in the ground state [47]. As the
negative charge develops on the 3¢ oxygen upon
entering the transition state, this interaction will
become more favorable. This transition state stabil-
ization is thought to be an important stabiliza-
P. P. Dotson II et al. Kinetics of the trans excision-splicing reaction
FEBS Journal 275 (2008) 3110–3122 ª 2008 The Authors Journal compilation ª 2008 FEBS 3117
tion ⁄ destabilization factor in ribozyme-substrate bind-
ing [47].
A conformation change exists between the two
steps of the TES reaction
The substrate guanosine to be excised (G
1
) and its
2¢-OH group are required for the second step of
TES [48], similar to (if not the same as) the role of
the xG in the second step of self-splicing [48–56].
This suggests that the guanosine to be excised is
likely binding to the GBS of the ribozyme for the
exon-ligation step of TES. In the substrate-cleavage
step, however, the 3¢ terminal guanosine (G336) of
the ribozyme (Fig. 1) is binding to that same GBS.
Therefore, for the TES reaction, there is likely a
local conformational change between the two
reaction steps that sees G
1
displace the ribozyme’s
3¢ terminal guanosine for binding into the GBS (see
Fig. 1). The local conformational change that occurs
in TES is likely similar to the local conformational
change that occurs in self-splicing, with the displace-
ment of the intermolecular guanosine by the xGof
the intron [57–60]. Nevertheless, because TES uses
an intramolecular nucleophile and self-splicing uses
an intermolecular nucleophile, the local conforma-
tional changes between the two steps of each reac-
tion can not be identical.
Implications for TES applications
TES substrates, once bound, are four times more likely
to undergo the substrate-cleavage reaction than they
are to dissociate. Therefore, to make more effective
TES ribozymes, one could decrease the rate of sub-
strate dissociation relative to that for the substrate-
cleavage reaction. Potential strategies for achieving this
are to increase the strength of helix P1, either through
target selection or elongation of helix P1. Note, how-
ever, that this strategy could result in a decrease in the
substrate cleavage rate.
Results also suggest that the Pneumocystis ribozyme
catalyzes the substrate-cleavage reaction (catalyzed by
either an intermolecular or intramolecular guanosine)
$ 60-fold slower than the Tetrahymena ribozyme.
Therefore, it appears that there is room for improve-
ment in terms of the rate of reaction. This would be
beneficial not so much in terms of the rate of the over-
all reaction, as the cleavage reaction is not the limiting
step (binding is slower), but in terms of decreasing the
amount of substrate that dissociates from the ribozyme
before reactivity, effectively increasing the yield of the
reaction.
Experimental procedures
Oligonucleotide synthesis and purification
RNA oligonucleotides were obtained from Dharmacon
(Lafayette, CO, USA), deprotected following the manufac-
turer’s protocol, and stored in sterile water. Unlabeled
RNAs were used without further purification. The substrate
RNAs were 5¢-end radiolabeled with T4 polynucleotide
kinase (New England Biolabs, Beverly, MA, USA) and
[
32
P]ATP[cP] (Amersham Pharmacia Biotech, Piscataway,
NJ, USA) and gel purified on a 20% nondenaturing
polyacrylamide gel [33].
Transcription
The ribozyme precursor plasmid was generated as described
previously [33]. Prior to run-off transcription, the ribozyme
plasmid was linearized with XbaI and purified using a QIA-
quick PCR Purification kit (Qiagen, Valencia, CA, USA).
The ribozyme, rPC, was then synthesized by run-off tran-
scription and isolated as described previously [1]. After-
wards, the ribozyme was precipitated with 2-propanol, with
ethanol, dissolved in sterile water, and quantified using a
Beckman DU-650 UV-Vis spectrophotometer (Beckman
Coulter Inc., Fullerton, CA, USA) at 260 nm.
Measurement of observed substrate cleavage
rate constants (k
obs
and k
2
)
The first-order rate constant for substrate cleavage, k
obs
,
was measured under single-turnover conditions, in which
case the release of product would not affect the observed
rate constants. Most reactions were conducted at 44 °Cin
H10Mg buffer, which consists of 50 mm Hepes (25 mm
Na
+
), 135 mm KCl and 10 mm MgCl
2
at pH 7.5. These
reaction conditions appear to be optimal for the TES reac-
tion [1]. For the pH-dependence studies, Hepes (pH 7.5)
was replaced with Mes (pH 5.0–6.8), Hepes (pH 6.8–7.5) or
Epps (pH 7.5–8.5). Reactions were initiated by adding 5 lL
of an 8 nm solution of 5¢-end radiolabeled substrate
[r(5¢-AUGACUdGCUC-3¢)] in the appropriate buffer (at
44 °C) to a 25 lL solution of various concentrations of
ribozyme (6–360 nm) in the same buffer (also at 44 °C). Note
that the ribozyme solution was preincubated at 60 °C for
5 min and then allowed to slow cool to 44 °C to facilitate
folding of the ribozyme prior to the addition of the radio-
labeled substrate. Aliquots (3 lL) were removed at specified
times and quenched with an equal volume of 2 · stop buffer
(10 m urea, 0.1 · TBE, 3 mm EDTA). The substrate and
products were denatured at 90 °C for 1 min and then sepa-
rated on a 12.5% denaturing polyacrylamide gel. The bands
were visualized on a Molecular Dynamics Storm 860
Phosphorimager and quantified using imagequant software
(Molecular Dynamics, GE Healthcare, Piscataway, NJ,
Kinetics of the trans excision-splicing reaction P. P. Dotson II et al.
3118 FEBS Journal 275 (2008) 3110–3122 ª 2008 The Authors Journal compilation ª 2008 FEBS
USA). Data were fit using the kaleidagraph curve-fitting
program (Synergy Software, Reading, PA, USA). The final
concentration of the radiolabeled substrate in all reactions
is 1.3 nm. A typical reaction utilized H10Mg buffer and a
final ribozyme concentration of 166 nm. Pseudo-first-order
rate constants for the appearance of products were fit using
the following single exponential equation:
½P
t
¼½P
1
ð1 À e
Àkt
Þð1Þ
In Eqn (1) [P]
t
and [P]
¥
are the percentages of product
formed at time t and at the end point, respectively, and k is
the first-order rate constant.
Measurement of the substrate dissociation rate
constant (k
)
1
)
Pulse–chase experiments [6,61] were used to measure the
rate constant for substrate dissociation, k
)1
. In these experi-
ments, 10 lL of 200 nm ribozyme in H10Mg buffer was
combined with 2 lLof8nm 5¢-end radiolabeled substrate
in H10Mg buffer for t
1
= 30 s. The ribozyme solution was
preincubated at 60 °C for 5 min and then slow cooled to
44 °C before addition of the substrate, which was also at
44 °C. The chase phase was then initiated by removing
5 lL of the reaction mixture and diluting the reaction mix-
ture with 25 lL of H10Mg buffer (at 44 °C) so that
[E]<K
M
. During the chase period, t
2
, dissociation of
labeled substrate from the ribozyme is essentially irrevers-
ible. Aliquots were removed at various times during the
chase phase and the reaction was quenched by adding an
equal volume of 2 · stop buffer. An otherwise identical
reaction, but without adding the chase (which in this case is
buffer), was carried out in parallel. The first-order observed
rate constants k
obs, chase
and k
obs, no-chase
were obtained
from a single-exponential fit of this data using Eqn (1) (as
a function of t
2
). The observed rate constant for substrate
dissociation (k
)1
) was then calculated (Eqn 2) as the differ-
ence between the two measured observed rate constants:
k
À1
¼ k
obs;chase
À k
obs;noÀchase
ð2Þ
Measurement of the substrate association rate
constant (k
1
)
The rate constant for substrate binding, k
1
, was measured
using a series of pulse–chase experiments. In each reaction,
5 lL of a ribozyme stock (from 36 to 240 nm) in H10Mg
buffer was combined with 1 lLof8nm 5¢-end labeled sub-
strate and allowed to react in a total volume of 6 lL. The
ribozyme solution was preincubated at 60 °C for 5 min and
then slow cooled to 44 °C before the addition of the sub-
strate, which was also at 44 ° C. For each ribozyme concen-
tration, several chase reactions were initiated. In each
chase, 1 lL of the original reaction mixture was removed
and diluted fivefold with H10Mg buffer at 44 °C, t
1
,at
times ranging from 15 to 120 s. The addition of chase ren-
ders the dissociation of the substrate essentially irreversible.
The chase reaction, t
2
, was then allowed to proceed for
15 min, at which point the substrate-cleavage reaction was
essentially complete. The reaction was quenched with an
equal volume of 2 · stop buffer. The percent product
formed during the chase period was plotted against time t
1
.
Observed rate constants (k
obs
) were obtained by fitting the
data to Eqn (1). This observed rate constant measures the
rate of approach to equilibrium where substrate association
is equal to substrate dissociation. Hence, the rate of sub-
strate association was obtained [6,13] by plotting k
obs
against ribozyme concentration and fitting to the equation:
k
obs
¼ k
1
½Eþk
À1
:
Measurement of the dissociation constant, K
d
P
of the ribozyme–product complex
The equilibrium dissociation constant K
d
P
of the 5¢ exon
mimic binding to the ribozyme was determined using native
PAGE [8,12,33,62]. In this assay, several concentrations of
ribozyme, ranging from 1.5 to 300 nm, were preannealed in
5 lL total volume containing 3.4% glycerol and H10Mg
buffer for 5 min at 60 °C. After the solutions slow cooled
to 44 °C, 2.5 lL of a stock of 0.5 nm radiolabeled 5¢ exon
mimic in H10Mg buffer at 44 °C was added. The mixture
was incubated at 44 °C for at least 90 min. To maintain the
integrity of the bound species during gel electrophoresis,
the gel and the running buffer were made of H10Mg buffer
and were prewarmed to 44 °C before the samples were
loaded. The bound and unbound 5¢ exon mimics were sepa-
rated from each other by running 6 lL of each reaction on
a 10% nondenaturing polyacrylamide gel. The gel was
placed on chromatography paper (Whatman 3MM CHR)
and dried under vacuum for 30 min at 70 °C. The bands
were visualized on a Molecular Dynamics Storm 860 Phos-
phorimager and quantified using imagequant software
(Molecular Dynamics). Data were fit using the kaleida-
graph curve-fitting program (Synergy Software) using the
equation: h = [ribozyme]
u
⁄ ([ribozyme]
u
+ K
d
) [32,33]. In
this equation, K
d
is the equilibrium dissociation constant of
the 5¢ exon mimic, h is the fraction of 5¢ exon mimic bound
to the ribozyme, and [ribozyme]
u
is the concentration of
unbound ribozyme in the reaction.
Measurement of rate constant of
substrate-cleavage product dissociation (k
)
3
)
The dissociation rate constant of the 5¢ exon intermediate
(k
)3
), was measured by a pulse–chase protocol, followed by
analysis of the ribozyme ⁄ product complex using native
PAGE. In a typical experimental to measure k
)3
, a solution
of 300 nm ribozyme in 10 lL H10Mg buffer containing
3.4% glycerol was preincubated for 5 min at 60 °C and
P. P. Dotson II et al. Kinetics of the trans excision-splicing reaction
FEBS Journal 275 (2008) 3110–3122 ª 2008 The Authors Journal compilation ª 2008 FEBS 3119
then allowed to slow cool to 44 °C. Then 5 lL of 0.5 nm
5¢-end labeled 5¢ exon intermediate was added and the reac-
tion mixture was incubated at 44 ° C for 30 min to allow
complete binding. A chase reaction was then initiated by
the addition of 40 lL of 5.4 lm unlabeled 5¢ exon interme-
diate in reaction buffer to follow the practically irreversible
dissociation of 5¢ exon intermediate from the ribozyme–
5¢ exon complex. The final concentrations of the reactants
in the chase reaction were 40 nm ribozyme, 33 pmol 5¢-end
labeled substrate-cleavage product and 4 lm unlabeled
5¢ exon intermediate (as chase) in 50 lL reaction volume.
Time points were taken by withdrawing 5 lL aliquot from
the reaction mixture and immediately loaded onto a run-
ning 10% native polyacrylamide gel. For quantification, the
amount of product not bound after the chase was sub-
tracted from that at time t
1
, which yields the amount of
product dissociated due to the chase. The dissociation rate
was obtained using Eqn (1). Additionally, the rate constant
of substrate-cleavage product association (k
3
) was obtained
[19] using the equation: k
3
=k
)3
⁄ K
d
P
.
Acknowledgements
The research was supported by grants from the
Department of Defense Breast Cancer Research
Program DAMD17-03-1-0329, the Kentucky Lung
Cancer Research Program and the Kentucky Research
Challenge Trust Fund. The authors thank two anony-
mous reviewers for insightful suggestions.
References
1 Bell MA, Johnson AJ & Testa SM (2002) Ribozyme-
catalyzed excision of targeted sequences from within
RNA. Biochemistry 41, 15327–15333.
1a Dotson PP II, Sinha J & Testa SM (2008) A Pneumo-
cytis carinii group I intron-derived ribozyme utilizes an
endogenous guanosine as the first reaction step nucleo-
phile in the trans excision-splicing reaction. Biochemistry
47, 4780–4787.
2 Kruger K, Grabowski PJ, Zaug AJ, Sands J, Gottsch-
ling DE & Cech TR (1982) Self-splicing RNA:
autoexcision and autocyclization of the ribosomal
RNA intervening sequence of Tetrahymena. Cell 31,
147–157.
3 Zaug AJ, Grawbowski PJ & Cech TR (1983) Autocata-
lytic cyclization of an excised sequence RNA is a cleav-
age–ligation reaction. Nature 301 , 578–583.
4 Inoue T, Sullivan FX & Cech TR (1986) New reactions
of the ribosomal RNA precursor of Tetrahymena
and the mechanism of self-splicing. J Mol Biol 189,
143–165.
5 Nielsen H, Fiskaa T, Birgisdottir AB, Haugen P, Einvik
C & Johansen S (2003) The ability to form full-length
intron RNA circles is a general property of nuclear
group I introns. RNA 9, 1464–1475.
6 Herschlag D & Cech TR (1990) Catalysis of RNA
cleavage by the Tetrahymena thermophila ribozyme. 1.
Kinetic description of the reaction of an RNA substrate
complementary to the active site. Biochemistry 29,
10159–10171.
7 Herschlag D & Cech TR (1990) Catalysis of RNA
cleavage by the Tetrahymena thermophila ribozyme. 2.
Kinetic description of the reaction of an RNA substrate
that forms a mismatch at the active site. Biochemistry
29, 10172–10180.
8 Pyle AM, McSwiggen JA & Cech TR (1990) Direct
measurement of oligonucleotide substrate binding to
wild-type and mutant ribozymes from Tetrahymena.
Proc Natl Acad Sci USA 87, 8187–8191.
9 Fedor MJ & Uhlenbeck OC (1992) Kinetics of intermo-
lecular cleavage by hammerhead ribozymes. Biochemis-
try 31, 12042–12054.
10 Franzen JS, Zhang M & Peebles CL (1993) Kinetic
analysis of the 5¢ splice junction hydrolysis of a
group II intron promoted domain 5. Nucleic Acids Res
21, 627–634.
11 Smith D & Pace NR (1993) Multiple magnesium ions
in the ribonuclease P reaction mechanism. Biochemistry
32, 5273–5281.
12 Pyle AM & Green JB (1994) Building a kinetic frame-
work for group II intron ribozyme activity: quantitation
of interdomain binding and reaction rate. Biochemistry
33, 2716–2725.
13 Hertel KJ, Herschlag D & Uhlenbeck OC (1994) A
kinetic and thermodynamic framework for the hammer-
head ribozyme reaction. Biochemistry 33, 3374–3385.
14 Zaug AJ, Davila-Aponte JA & Cech TR (1994) Cataly-
sis of RNA cleavage by a ribozyme derived from the
group I intron of Anabaena pre-tRNA(Leu).
Biochemis-
try 33, 14935–14947.
15 Mei R & Herschlag D (1996) Mechanistic investigations
of a ribozyme derived from the Tetrahymena group I
intron: insights into catalysis and the second step of
self-splicing. Biochemistry 35, 5796–5809.
16 Esteban JA, Banerjee AR & Burke JM (1997) Kinetic
mechanism of the hairpin ribozyme. Identification and
characterization of two nonexchangeable conforma-
tions. J Biol Chem 272, 13629–13639.
17 Kuo LY, Davidson LA & Pico S (1999) Characteriza-
tion of the Azoarcus ribozyme: tight binding to guano-
sine and substrate by an unusually small group I
ribozyme. Biochim Biophys Acta 1489, 281–292.
18 Bergman NH, Johnston WK & Bartel DP (2000)
Kinetic framework for ligation by an efficient RNA
ligase ribozyme. Biochemistry 39, 3115–3123.
19 Shih I & Been MD (2000) Kinetic scheme for inter-
molecular RNA cleavage by a ribozyme derived from
Kinetics of the trans excision-splicing reaction P. P. Dotson II et al.
3120 FEBS Journal 275 (2008) 3110–3122 ª 2008 The Authors Journal compilation ª 2008 FEBS
Hepatitis delta virus RNA. Biochemistry 39, 9055–
9066.
20 Bell MA, Sinha J, Johnson AJ & Testa SM (2004)
Enhancing the second step of the trans excision-splicing
reaction of a group I ribozyme by exploiting P9.0 and
P10 for intermolecular recognition. Biochemistry 43,
4323–4331.
21 McConnell TS, Cech TR & Herschlag D (1993) Guano-
sine binding to the Tetrahymena ribozyme: thermody-
namic coupling with oligonucleotide binding. Proc Natl
Acad Sci USA 90, 8362–8366.
22 Herschlag D, Eckstein F & Cech TR (1993) Contribu-
tions of 2¢-hydroxyl groups of the RNA substrate to
binding and catalysis by the Tetrahymena ribozyme. An
energetic picture of an active site composed of RNA.
Biochemistry 32, 8299–8311.
23 Herschlag D, Eckstein F & Cech TR (1993) The impor-
tance of being ribose at the cleavage site in the Tetrahy-
mena ribozyme reaction. Biochemistry 32, 8312–8321.
24 Knitt DS & Herschlag D (1996) pH dependencies of the
Tetrahymena ribozyme reveal an unconventional origin
of an apparent pK
a
. Biochemistry 35, 1560–1570.
25 Herschlag D & Kosla M (1994) Comparison of pH
dependencies of the Tetrahymena ribozyme reactions
with RNA 2¢-substituted and phosphorothioate sub-
strates reveal a rate-limiting conformational step.
Biochemistry 33, 5291–5297.
26 Dahm SC, Derrick WB & Uhlenbeck OC (1993) Evi-
dence for the role of solvated metal hydroxide in the
hammerhead cleavage mechanism. Biochemistry 32,
13040–13045.
27 Curtis EA & Bartel DP (2001) The hammerhead cleav-
age reaction in monovalent cations. RNA 7, 546–552.
28 Dahm SC & Uhlenbeck OC (1991) Role of divalent
metal ions in the hammerhead RNA cleavage reaction.
Biochemistry 30, 9464–9469.
29 Viola RE & Cleland WW (1978) Use of pH studies to
elucidate the chemical mechanism of yeast hexokinase.
Biochemistry 17, 4111–4117.
30 Saenger W (1988) Principles of Nucleic Acid Structure ,
2nd edn. Springer-Verlag, Berlin.
31 Fersht A (1999) Structure and Mechanism in Protein
Science: A Guide to Enzyme Catalysis and Protein Fold-
ing. W. H. Freeman, New York.
32 Weeks KM & Crothers DM (1992) RNA binding
assays for Tat-derived peptides: implications for speci-
ficity. Biochemistry 31, 10281–10287.
33 Testa SM, Haidaris CG, Gigliotti F & Turner DH
(1997) A Pneumocystis carinii group I intron ribozyme
that does not require 2¢ OH groups on its 5¢ exon mimic
for binding to the catalytic core. Biochemistry 36,
15303–15314.
34 Eigen M & Hammes GG (1963) Elementary steps in
enzyme reactions (as studied by relaxation spectros-
copy). Adv Enzymol Relat Areas Mol Biol 25, 1–38.
35 Quast U, Engel J, Heumann H, Krause G & Steffen E
(1974) Kinetics of the interaction of bovine pancreatic
trypsin inhibitor (Kunitz) with alpha-chymotrypsin.
Biochemistry 13, 2512–2520.
36 Hammes GG & Hurst JK (1969) Relaxation spectra of
adenosine triphosphate–creatine phosphotransferase.
Biochemistry 8, 1083–1094.
37 Czerlinski GH & Schreck G (1964) Chemical relaxation
of the reaction of malate dehydrogenase with reduced
nicotinamide adenine dinucleotide determined by fluo-
rescence detection. Biochemistry 3, 89–100.
38 Porschke D & Eigen M (1971) Co-operative non-enzy-
matic base recognition. 3. Kinetics of the helix–coil
transition of the oligoribouridylic–oligoriboadenylic
acid system and of oligoriboadenylic acid alone at
acidic pH. J Mol Biol 62, 361–381.
39 Nelson JW & Tinoco I Jr (1982) Comparison of the
kinetics of ribooligonucleotide, deoxyribooligonucleo-
tide, and hybrid oligonucleotide double-strand forma-
tion by temperature-jump kinetics. Biochemistry 21,
5289–5295.
40 Craig ME, Crothers DM & Doty P (1971) Relaxation
kinetics of dimer formation by self complementary oli-
gonucleotides. J Mol Biol 62, 383–401.
41 Breslauer KJ & Bina-Stein M (1977) Relaxation kinetics
of the helix–coil transition of a self-complementary
ribo-oligonucleotide: A7U7. Biophys Chem 7, 211–216.
42 Ravetch J, Gralla J & Crothers DM (1974) Thermody-
namic and kinetic properties of short RNA helices: the
oligomer sequence AnGCUn. Nucleic Acids Res 1, 109–
127.
43 Bevilacqua PC, Kierzek R, Johnson KA & Turner DH
(1992) Dynamics of ribozyme binding of substrate
revealed by fluorescence-detected stopped-flow methods.
Science 258, 1355–1358.
44 Santoro SW & Joyce GF (1997) A general purpose
RNA-cleaving DNA enzyme. Proc Natl Acad Sci USA
94, 4262–4266.
45 Li Y & Breaker RR (1999) Kinetics of RNA degrada-
tion by specific base catalysis of transesterification
involving the 2¢-hydroxyl group. J Am Chem Soc 121 ,
5364–5372.
46 Zaug AJ & Cech TR (1986) The intervening sequence
RNA of Tetrahymena is an enzyme. Science 231, 470–
475.
47 Narlikar GJ, Gopolakrishnan V, McConnell TS, Us-
man N & Herschlag D (1995) Use of binding energy by
an RNA enzyme for catalysis by positioning and sub-
strate destabilization. Proc Natl Acad Sci USA 92,
3668–3672.
48 Baum DA, Sinha J & Testa SM (2005) Molecular recog-
nition in a trans excision-splicing ribozyme: non-Watson-
Crick base pairs at the 5¢ splice site and xG at the 3¢
splice site can play a role in determining the binding regis-
ter of reaction substrates. Biochemistry 44, 1067–1077.
P. P. Dotson II et al. Kinetics of the trans excision-splicing reaction
FEBS Journal 275 (2008) 3110–3122 ª 2008 The Authors Journal compilation ª 2008 FEBS 3121
49 Moran S, Kierzek R & Turner DH (1993) Binding of
guanosine and 3¢ splice site analogues to a group I ribo-
zyme: interactions with functional groups of guanosine
and with additional nucleotides. Biochemistry 32, 5247–
5256.
50 Bass BL & Cech TR (1986) Ribozyme inhibitors:
deoxyguanosine and dideoxyguanosine are competitive
inhibitors of self-splicing of the Tetrahymena ribosomal
ribonucleic acid precursor. Biochemistry 25, 4473–4477.
51 Bass BL & Cech TR (1984) Specific interaction between
the self-splicing RNA of Tetrahymena and its guanosine
substrate: implications for biological catalysis by RNA.
Nature 308, 820–826.
52 Shan S, Kravchuk AV, Piccirilli JA & Herschlag D
(2001) Defining the catalytic metal ion interactions in
the Tetrahymena ribozyme reaction. Biochemistry 40,
5161–5171.
53 Shan S, Yoshida A, Sun S, Piccirilli JA & Herschlag D
(1999) Three metal ions at the active site of the Tetrahy-
mena group I ribozyme. Proc Natl Acad Sci USA 96,
12299–12304.
54 Sjogren AS, Pettersson E, Sjoberg BM & Stromberg R
(1997) Metal ion interaction with cosubstrate in self-
splicing of group I introns. Nucleic Acids Res 25, 648–
653.
55 Stahley MR & Strobel SA (2005) Structural evidence
for a two-metal-ion mechanism of group I intron splic-
ing. Science 309, 1587–1590.
56 Adams PL, Stahley MR, Gill ML, Kosek AB, Wang J
& Strobel SA (2004) Crystal structure of a group I
intron splicing intermediate. RNA 10, 1867–1887.
57 Cech TR (1990) Self-splicing of group I introns. Annu
Rev Biochem 59, 543–568.
58 Been MD & Perrotta AT (1991) Group I intron self-
splicing with adenosine: evidence for a single nucleo-
side-binding site. Science 252, 434–437.
59 Golden BL & Cech TR (1996) Conformational switches
involved in orchestrating the successive steps of group I
RNA splicing. Biochemistry 35, 3754–3763.
60 Michel F, Hanna M, Green R, Bartel DP & Szostak
JW (1989) The guanosine binding site of the Tetrahy-
mena ribozyme. Nature 342, 391–395.
61 Rose IA, O’Connell EL & Litwin S (1974) Determina-
tion of the rate of hexokinase–glucose dissociation by
the isotope-trapping method. J Biol Chem 249, 5163–
5168.
62 Johnson AK, Baum DA, Tye J, Bell MA & Testa SM
(2003) Molecular recognition properties of IGS-medi-
ated reactions catalyzed by a Pneumocystis carinii
group I intron. Nucleic Acids Res 31, 1921–1934.
Kinetics of the trans excision-splicing reaction P. P. Dotson II et al.
3122 FEBS Journal 275 (2008) 3110–3122 ª 2008 The Authors Journal compilation ª 2008 FEBS