Tài liệu Báo cáo khoa học: Seed-based systematic discovery of specific transcription factor target genes pptx
Bạn đang xem bản rút gọn của tài liệu. Xem và tải ngay bản đầy đủ của tài liệu tại đây (639.11 KB, 15 trang )
Seed-based systematic discovery of specific transcription
factor target genes
Ralf Mrowka1,2,3, Nils Bluthgen4 and Michael Fahling1,3
ă
ă
1
2
3
4
Paul-Ehrlich-Zentrum fur Experimentelle Medizin, Berlin, Germany
ă
AG Systems Biology – Computational Physiology, Berlin, Germany
´
Johannes-Muller-Institut fur Physiologie, Charite-Universitatsmedizin Berlin, Germany
ă
ă
ă
School of Chemical Engineering and Analytical Sciences, Manchester Interdisciplinary Biocentre, University of Manchester, UK
Keywords
feedback; glaucoma; NF-jB; optineurin;
transcription factor target prediction
Correspondence
R. Mrowka, Paul-Ehrlich-Zentrum fur
ă
Experimentelle Medizin, AG Systems
Biology Computational Physiology,
Tucholskystr. 2, D-10117 Berlin, Germany
Fax: +49 30 450528972
Tel: +49 30 450528218
E-mail:
(Received 26 February 2008, revised 1 April
2008, accepted 16 April 2008)
doi:10.1111/j.1742-4658.2008.06471.x
Reliable prediction of specific transcription factor target genes is a major
challenge in systems biology and functional genomics. Current
sequence-based methods yield many false predictions, due to the short and
degenerated DNA-binding motifs. Here, we describe a new systematic genome-wide approach, the seed-distribution-distance method, that searches
large-scale genome-wide expression data for genes that are similarly
expressed as known targets. This method is used to identify genes that are
likely targets, allowing sequence-based methods to focus on a subset of
genes, giving rise to fewer false-positive predictions. We show by cross-validation that this method is robust in recovering specific target genes. Furthermore, this method identifies genes with typical functions and binding
motifs of the seed. The method is illustrated by predicting novel targets of
the transcription factor nuclear factor kappaB (NF-jB). Among the new
targets is optineurin, which plays a key role in the pathogenesis of acquired
blindness caused by adult-onset primary open-angle glaucoma. We show
experimentally that the optineurin gene and other predicted genes are targets of NF-jB. Thus, our data provide a missing link in the signalling of
NF-jB and the damping function of optineurin in signalling feedback of
NF-jB. We present a robust and reliable method to enhance the genomewide prediction of specific transcription factor target genes that exploits the
vast amount of expression information available in public databases today.
The prediction and analysis of the regulatory networks
underlying gene expression is a central challenge in
systems biology and functional genomics [1,2]. Regulation of transcription is the initial mechanism for controlling the expression of genes. Key regulators of
transcription are transcription factors, which bind to
DNA motifs in noncoding regions that control gene
transcription. Therefore, the identification of transcription factor target genes is one major element in the
understanding and reconstruction of the regulatory
network. Although many DNA motifs for transcription factor binding are known and are contained
as consensus sequences and binding matrices in databases such as transfac [3] and jaspar [4], their direct
use for genome-wide matching in promoter sequences
of higher organisms is greatly limited [5]. Current
methods that use sequence data give results that are
dominated by false predictions [5]. The issue of a high
proportion of false positives in pure sequence-based
methods has been known for a long time [6], and also
Abbreviations
CASP4, caspase 4; ChIP, chromatin immunoprecipitation; GAPDH, glyceraldehyde-3-phosphate dehydrogenase; HEK, human embryonic
kidney; HIF-1, hypoxia-inducible factor 1; HNF4, hepatocyte nuclear factor 4; IKK, IjB kinase; NEMO, nuclear factor kappaB essential
modulator; NF-jB, nuclear factor kappaB; OPTN, optineurin; RGA, reporter gene analysis; STAT5A, signal transducer and activator of
transcription 5A; TNF-a, tumor necrosis factor-a.
3178
FEBS Journal 275 (2008) 3178–3192 ª 2008 The Authors Journal compilation ª 2008 FEBS
R. Mrowka et al.
applies for the transcription factors analysed in this
study. The major problem is the short length and high
degeneracy of the DNA-binding motifs, which give rise
to one predicted binding site per 1000–10 000 bp by
sheer chance. Therefore, other resources, such as phylogenetic footprinting have been explored to further
restrict and ‘purify’ potential targets to more likely
candidates [7,8]. Such methods decrease the number of
false predictions by about one order of magnitude,
which is still not good enough for genome-wide predictions. Because the potential list of targets is too large,
further information needs to be exploited to concentrate the analysis on the genes that have a higher probability of being true target genes.
Gene ontology as a controlled and computer-readable way to annotate genes has been used extensively
to characterize clusters of genes from microarray [9,10]
data and also to validate microarray data [11]. Despite
the enormous number of false-positive predictions for
transcription factor targets with current methods, significant correlations with gene ontology terms have
been found that can be used to enhance prediction
quality [12,13]. In addition, statistical methods have
been developed to associate genes with disease [14],
and seed-based computational procedures have been
applied to identify brain cancer-related genes [15].
Currently, experience and knowledge of pathways
and an educated literature search may help us to focus
on possible candidates. The inclusion of information
from expression experiments conducted under different
experimental conditions may hint at potential candidates for further evaluation, as these data provide the
relevant biological functions of transcription factors,
which directly influence mRNA concentrations in the
cell. Well-designed, small-scale expression profile
experiments have been successfully used to identify
transcription factors involved in certain pathways
[16,17]. Especially when applied to time-series data,
seed-based clustering methods have been very successful in identifying novel targets by comparing expression kinetics with known targets for p53 and for
picking up genes regulated in different cell-cycle phases
[18,19]. However, these approaches require dedicated
microarray experiments. We addressed the question as
to whether it is feasible to explore the large body of
expression information that is already stored in public
databases. These datasets might contain information
about expression at different time points for different
cell lines that might be only marginally related to the
transcription factor under investigation, and we wondered whether these datasets would allow us to extract
the relevant information about the action of transcription factors on their targets.
Systematic TF target prediction
In recent years, several microarray techniques have
been developed to measure mRNA concentration on a
genome-wide scale [20]. In addition, efforts have been
made to store individual microarray experiments in
databases. Microarray expression data have been used
in recent times to improve transcription factor target
prediction [21]. In this work, we developed a method
to exploit a dataset of approximately 1200 microarray
experiments in conjunction with a seed group of
known transcription factor target genes and show that
the information available in the databases is sufficient
to increase the accuracy of prediction drastically. We
elucidate and exemplify our seed-distribution-distance
method for predicting novel nuclear factor kappaB
(NF-jB) targets. NF-jB is involved in pathways
important for both physiological processes and disease
conditions. It plays an important role in the control of
immune function, differentiation, inflammation, stress
response, apoptosis, cell survival, processes of development, and progression of cancers [22]. Thus, NF-jB
has become one of the most widely studied transcription factors. Five NF-jB genes (NFKB1, NFKB2,
RELA, c-REL and RELB) belong to the NF-jB gene
family, and the resulting proteins are able to form
homodimers or heterodimers [23]. Prior to activation,
NF-jB is localized in the cytoplasm and is tightly
associated with its inhibitors (IjB proteins) and p100
proteins. Multiple stimuli such as tumor necrosis factor-a (TNF-a), UV radiation and free radicals, activate
NF-jB signalling through activation of IjB kinases
(IKKs), which phosphorylate IjBs and p100 proteins,
subsequently leading to their polyubiquitination and
degradation [24].
Results
The seed-distribution-distance method
We started by defining a ‘seed’ group of known NF-jB
targets by collecting known NF-jB targets mentioned
in an NF-jB review paper [25] matching ensembl
entries, resulting in 91 genes. Joining the 91 target
genes with the genes in the microarray set resulted in
81 genes, which were used as the seed. We obtained
these large-scale microarray expression data [26]
(detailed description of data in supplementary Doc S1)
from the Stanford microarray database [27]. The set
contains genome-wide data from 1202 hybridization
experiments from human tissues and cell lines. Subsequently, we ranked each gene x according to its
similarity L(x) of expression to the seed group
(detailed results given in supplementary Doc S2). We
defined similarity L(x) for a gene x by taking the
FEBS Journal 275 (2008) 3178–3192 ª 2008 The Authors Journal compilation ª 2008 FEBS
3179
Systematic TF target prediction
R. Mrowka et al.
median correlation of gene x to the seed and subtracting its median correlation to all genes (typical distributions of correlations of genes to the seed group are
shown in supplementary Fig. S1). Thus, if L(x) showed
high values, the particular gene was similarly regulated
as the seed gene group. In contrast, if the absolute
value of the similarity measure was low, it indicated
that the median of distribution was close to that correlation distribution of the gene to a randomly selected
group. Using the similarity measure L, we then sorted
all remaining human genes and thereby obtained a
ranking of the genes according to their similarity to
the seed group. To avoid a circular argument, we
would like to stress that for all statistical analyses and
characterization of rank, the seed group was excluded.
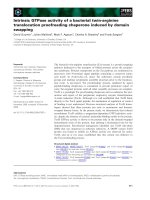
A schematic representation of this procedure is given
in Fig. 1. The essence of the method is that if a gene’s
correlation to those in the seed set (represented by the
median) is larger than the median of the correlation to
all genes, then it is more likely to be related to the seed
set, the members of which are then more likely to be
targets of the transcription factor. This method
requires that at least the initial seed set of true targets
is known, and that other targets are correlated to several genes in the seed set. Furthermore, the method is
based on the assumption that there is a relationship
Fig. 1. Schematic diagram of the workflow
in this study. Expression profiles of a gene
g are compared to the expression profiles of
the seed genes and randomly selected
genes. A distance score L(x) is calculated
that quantifies specific expression similarity
to the seed. The genes are then ranked on
the basis of L(x), searched for putative binding sites in their promoter region, and subjected to a reporter gene assay.
3180
FEBS Journal 275 (2008) 3178–3192 ª 2008 The Authors Journal compilation ª 2008 FEBS
R. Mrowka et al.
Systematic TF target prediction
between gene coexpression and gene coregulation.
The ranking can also be done by other scores than
the median correlation. For instance, we have ranked
the genes using a one-sided P-value derived from a
computationally more extensive Mann–Whitney ranksum test, and found similar performance as with L(x)
(see supplementary Fig. S3).
Top members in the rank show typical NF-jB
functions
We next analysed the top members of the obtained
rank with regard to their gene ontology classification.
For the top 600 genes, we examined whether any gene
ontology classification is significantly enriched using
rigorous statistics [12]. It turns out that the list of significant gene functions of the top 600 genes as shown
in supplementary Table S1 is congruent with the functions of NF-jB described in the literature.
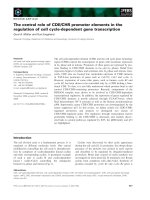
We further analysed the occurrences of NF-jB typical functions within the rank. We found that there was
a steep increase of the density of genes involved in
‘immune response’, starting at approximately rank 700
when moving from lowest to highest ranks. The probability of a gene being involved in the immune response
is therefore greatly increased for the top members in
the rank, as seen in Fig. 2.
Genes involved in immune response
0.25
0.2
Density
Density of occurence
0.2
0.1
0
0.15
0
"high rank"
5000
10 000
position
"low rank"
0.1
0.05
0
High density of putative NF-jB DNA-binding sites
in promoters in the top group of the rank
As the overrepresentation of typical NF-jB-related
biological functions might be due to coexpression
mediated by different transcription factors, we decided
to analyse the sequences of putative promoter regions
of the high-ranking genes.
We predicted binding sites for all vertebrate transcription factors contained in the transfac database
in the 500 bp putative promoter region of all genes in
the ranking. We derived the 500 bp sequences
upstream of the transcriptional start site from the
ensembl database. We chose to limit our search to
500 bp, because we and others observed earlier that
the majority of promoter sequences fall within this
region [12,28].
To illustrate our method, we chose to search for
consensus sequences from the transfac database in
the putative promoter regions, as this method does not
require an additional parameter like more sophisticated weight-matrix methods, which typically require a
cut-off score (see also supplementary Table S5). We
analysed the distribution of occurrence of all predicted
factor-binding sites in the promoters of genes along
the rank. For each predicted binding motif, we calculated the ratio of the number of occurrences in the
upper 5% of the rank divided by the expected occurrence in the top 5% (given by 0.05 times the total
number of occurrences). A list of the motifs sorted by
this ratio has NF-jB-binding motifs in the top ranks,
namely NFKAPPAB65 (P = 0.0028) and NFKAPPAB50 (P = 0.0239) (P-values from the binomial test;
see Experimental procedures). In addition, this list
includes motifs of the transcription factors BACH2
(P = 0.0025), signal transducer and activator of transcription 5A (STAT5A) (P = 0.0036), and VBP
(P = 0.0106), which are enriched on average in the
top group. A graphical representation is given in
Fig. 3 (see also supplementary Table S4).
Robustness of seed-distribution-distance method
0
500
1000
1500
2000
Position of gene in the ranking
Fig. 2. Density of occurrences of genes annotated with the term
‘immune response’ in the ranking after applying the seed-distribution-distance method. Immune response genes are highly enriched
in the top members of the rank (P < 0.0001, two-sided Mann–Whitney rank-sum test). Red, individual occurrences of immune
response genes; black line, density of genes that are annotated
with the term. Inset: density for all genes in the rank.
The original seed group contained 81 known NF-jB
targets (supplementary Table S2). As, for most transcription factors, fewer targets are known, we investigated whether the seed-distribution-distance method
might also give reliable results if the seed was substantially smaller. We applied a cross-validation strategy
by randomly dividing the original 81 targets into
two groups, one group being the seed, and the remaining genes constituting the other group, named the test
group, t. Several sizes of the seed were used (1, 10, 20
FEBS Journal 275 (2008) 3178–3192 ª 2008 The Authors Journal compilation ª 2008 FEBS
3181
Systematic TF target prediction
R. Mrowka et al.
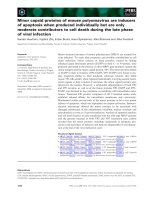
Enrichment of putative transcription factor
binding sites in top group
Histogram of recovery test
NFκB 65
STAT5a
VBP1
2.5
NFκB 50
2
1
Sites not enriched
1.5
Binding sites
for 234 other
vertebrate
transcription
factors
Original seed n = 81
Seed n = 50
Seed n = 20
Seed n = 10
Seed n = 1
0.5
Relative occurence
BACH2
Sites enriched
3
0.4
0.3
0.2
0.1
0.5
0
0
Occurence
Enriched P < 0.025
Depleted P < 0.025
Fig. 3. Distribution of enrichment of putative transcription factorbinding motifs in the ranking after applying the seed-distribution-distance method. The seed-distribution-distance method enriches
genes with putative NF-jB-binding sites in the respective promoter.
The top gene group of the seed rank was analysed regarding transcription factor-binding motif enrichment within the )500 bp promoter region. The binding motifs for NF-jB 50 and NF-jB 65 are
among the transcription factor-binding sites that are most strongly
enriched. Note that the initial seed group was not contained in this
analysis.
and 50 are shown in Fig. 4; cumulative representations
of the distributions are provided in supplementary
Fig. S2). After rank construction using the reduced
seed, the test group was then analysed regarding its
position in the rank. This procedure was repeated 100
times. It turned out that the test group members were
strongly present in the top positions of the rank, and
this was preserved even if a considerable part of the
original targets was not used for the seed. Even if one
used, for example, only 10 of 81 members of the seed,
the remaining 71 genes in the test group were highly
enriched in the top ranks, as shown in Fig. 4.
Moreover, we addressed the question of whether the
seed-distribution-distance method is also effective in
enriching targets for other transcription factors. We
chose E2F [29,30], ETS1 [31,32], hypoxia-inducible
factor 1 (HIF-1) [33], hepatocyte nuclear factor 4
(HNF4), and c-Myc [34], and collected seed groups for
these factors (supplementary Tables S2 and S3). We
applied our method to these seed groups in a jackknife manner (i.e. we iteratively left one seed member
out and determined its position in the rank). For all of
3182
0
2000
4000
6000
8000
10 000 12 000 14 000
Recovered position in gradient
Fig. 4. Recovery of target genes in a cross-validation test: the original seed was divided into two parts: (a) a group of members for
rank construction; and (b) a test group with the remaining members
of the original seed. Histograms of the recovery position of the test
group are shown for the newly constructed ranks using the seed
without the test group (median: s, , h, ). If, for example, 10
genes are used as a seed (71 in the test group), the relative occurrence of the recovered positions are still very high (h), i.e. the
enrichment capability of the seed-distribution-distance method is
still highly preserved. For comparison, the relative occurrence of
members of the original seed in the corresponding rank is given
(d). The error bars indicate the 5th and 95th percentiles of the distribution. Corresponding cumulative histograms are given in supplementary Fig. S2.
these additional transcription factors, the seed members left out were strongly enriched in the top of the
rank (Fig. 5). Moreover, the top members of the rank
were strongly enriched with typical gene ontology
terms of the factors for E2F and HNF4. For ETS1,
HIF-1 and c-Myc, this ontology enrichment is not as
clear as for the other three tested factors. One reason
could be the considerably lower number of gene ontology annotated genes for the specific terms and, in the
case of c-Myc, the broad-spectrum ontologies [34].
The results of this jack-knife procedure also provide
an estimate of how many of the true positives will lie
in the upper 5%: about 18–39% of all targets would
be in the upper 5% of genes of the rank (26% for
NF-jB, 39% for E2F, 29% for ETS1, 18% for HIF-1,
36% for HNF4, and 20% for c-Myc). Thus, applying
the seed-distribution-distance method will enrich the
true targets in the top 5% of the rank by a factor of
4–8.
FEBS Journal 275 (2008) 3178–3192 ª 2008 The Authors Journal compilation ª 2008 FEBS
R. Mrowka et al.
Systematic TF target prediction
Table 1. Potential NF-jB targets identified by the seed-distribution-distance method that are in the top group of the rank and have predicted
NF-jB-binding motifs within their )500 bp upstream promoter region. Interestingly, eight of the 16 identified new targets are known targets
of NF-jB. Note that all potential new targets were not in the initial seed group, so the otherwise known targets therefore constitute a good
validation of our method. The third column contains additional information about the results of the analysis of the ChIP assays and the reporter gene analysis (RGA) followed by a + or ) in case of a positive or negative result, respectively.
Description
Reference for evidence as an NF-jB target
ENSG00000100906
NF-jB inhibitor alpha (NFKBIA)
Sun et al. [58], this article, CHIP+,
RGA+ (positive control)
ENSG00000197635
ENSG00000142539
ENSG00000123240
ENSG00000173432
ENSG00000163739
ENSG00000081041
ENSG00000169245
ENSG00000117151
ENSG00000135604
ENSG00000023445
ENSG00000196954
ENSG00000166718
ENSG00000077150
ENSG00000158714
ENSG00000163435
Dipeptidyl peptidase 4 (DPP4)
Transcription factor Spi-B (SPI-B)
Optineurin (OPTN)
Serum amyloid A protein precursor (SAA1)
Growth-regulated protein a precursor (CXCL1)
Macrophage inflammatory protein 2a precursor (CXCL2)
Small inducible cytokine B10 precursor (CXCL10)
Di-N-acetylchitobiase precursor (CTBS)
Syntaxin-11 (STX11)
Baculoviral IAP repeat-containing protein 3 (BIRC3)
Caspase-4 precursor (EC 3.4.22.-) (CASP4)
Hypothetical protein
Nuclear factor NF-jB p100 subunit (NFKB2)
SLAM family member 8 precursor (SLAMF8)
E74-like factor 3 (ELF3)
ENSEMBL
ID
Taken together, these results suggest that the seeddistribution-distance method is applicable to other
transcription factors as well, and might be used for
much smaller seed sizes than the 81 genes used in the
NF-jB seed.
The list of predicted NF-jB targets and
experimental verification
We assembled a list of predicted NF-jB target genes
by selecting all genes that showed a putative NF-jBbinding site (a match of a transfac consensus motif
of NF-jB) in the 500 bp upstream of the transcription
start site and were members of the upper 5% in the
rank. The resulting list is shown in Table 1. Eight of
the 16 predicted targets have already been reported in
the literature to be direct targets of NF-jB, but were not
in the seed.
We decided to validate three of the novel predicted
targets by performing luciferase reporter assays. We
focused on optineurin (OPTN), among SPI-B, and caspase 4 (CASP4), and chose NFKBIA as a positive
control and DARS from the bottom of our rank as a
negative control. We cloned their human promoters in
a luciferase reporter plasmid and generated identical
plasmids in which the predicted consensus sequence of
the NF-jB-binding site was deleted. A widely used
method to induce NF-jB is stimulation by means of
TNF-a. Human HEK293 cells were transiently transfected with the reporter plasmids, and TNF-a stimula-
This paper, ChIP+, RGA+
This paper, ChIP+, RGA+
Edbrooke et al. [59]
O’Donnell et al. [60]
Guitart et al. [61]
O’Donnell et al. [60], suggested
Hosokawa et al. [62]
This article, RGA+, ChiP)
Lombardi et al. [63]
Grall et al. [64]
tion (1.25–20 ngỈmL)1) was applied. For all three
unmodified promoters, luciferase activity was strongly
induced in a concentration-dependent manner under
TNF-a stimulation in the undeleted plasmid, very similar to our positive control NFKBIA. In contrast, in
the experiment with the plasmids in which we had
deleted the putative NF-jB sites, the concentrationdependent stimulation effect was not seen for OPTN
and CASP4 promoters, and was strongly reduced for
the Spi-B promoter (Fig. 6), indicating that the NF-jB
action was blocked in the deleted mutant. The negative
control (DARS) did not show any significant dosedependent change in expression.
Furthermore, we applied the chromatin immunoprecipitation (ChIP) analysis in order to verify NF-jB
interaction with the predicted NF-jB-binding sites. A
positive ChiP signal was obtained for OPTN and SPI-B
as well as for NFKBIA in stimulated cells (Fig. 6). NFjB-dependent activation of the CASP4 promoter was
not indicated by ChIP analysis in HEK293 cells
(Fig. 6Be). This correlates well with a very low basal
promoter activity, and therefore may be attributed to
a silenced CASP4 promoter in the cellular model used.
Discussion
We have described the seed-distribution-distance
method for the identification of specific transcription
factor target genes. This strategy extracts relevant
information about gene regulation from large-scale
FEBS Journal 275 (2008) 3178–3192 ª 2008 The Authors Journal compilation ª 2008 FEBS
3183
Systematic TF target prediction
Transcription
Factor
Cross-validation
Gene ontology
30
25
Density (%)
Number of genes
E2F
R. Mrowka et al.
20
15
10
5
5
0
0
10
Extracellular matrix
8
Density (%)
Number of genes
ETS1
Cell cycle
10
6
4
2
10
5
0
0
25
Density (%)
Number of genes
30
HIF-1
20
15
10
5
Response to hypoxia
Angiogenesis
10
5
0
0
Liver development
Blood coagulation
Lipid metabolic process
5
Density (%)
Number of genes
6
HNF4
4
3
2
1
10
5
0
0
Immune response
30
Density (%)
Number of genes
40
NFkB
20
10
10
5
0
0
25
Cel proliferation
Density (%)
Number of genes
30
c-Myc
20
15
10
5
10
5
0
0
0
10 000
20 000
0
microarray experiments to generate a distribution-distance-derived target prediction based on a seed set of
known target genes of a specific transcription factor.
The target prediction is based on a combination of
3184
5000
10 000
Position in rank
Position in rank
Fig. 5. Left column: cross-validation of the
seed distribution method for six different
transcription factors. By means of a jackknife method, the recovery position of the
gene left out in the rank was calculated for
each transcription factor seed group. There
is a clear and high enrichment in the top
ranks for each transcription factor tested.
Right column: we applied the seed distribution method to rank genes. We calculated
the gene ontology density for typical ontologies of the corresponding factor. Enrichment
corresponds to an increased density at the
top ranks as compared with the density at
the bottom ranks.
transcription factor-binding site information and the
distribution distance. We took especial care to keep
our method simple and the number of free parameters
as low as possible, so our results do not depend on
FEBS Journal 275 (2008) 3178–3192 ª 2008 The Authors Journal compilation ª 2008 FEBS
R. Mrowka et al.
any parameter fine-tuning. Despite the simplicity of
the method, our predictions are very reliable, with 11
of the 16 predictions being true targets, corresponding
to an upper bound of the false discovery rate of 33%.
On the basis of a jack-knife method, we estimate that
our seed-based method of ranking genes will enrich
true target genes within the top 5% by a factor of 4–8.
Thus, incorporating the vast amount of microarray
data stored in databases can help to reduce the
extraordinarily high amount of false-positives obtained
with purely sequence-based methods [5,7,35]. More
sophisticated clustering methods might even improve
the prediction quality further. We provide both statistical and biological evidence that the seed-distributiondistance method is robust and applicable to other
transcription factors and is hence very useful in predicting specific transcription factor target genes.
Top rank members are involved in typical
NF-jB-regulated functions and are enriched
with putative NF-jB-binding sites
The distance criterion for generating the rank is a kind
of expression profile similarity measure with respect to
the seed group. It is not a priori clear that similarly
regulated genes share the same gene function. The
NF-jB analysis, however, reveals that the seed-distribution-distance method highly enriches genes in the
top ranks that share typical NF-jB-regulated functions. For instance, the processes immune responses,
complement activation, regulation of T-cell differentiation and immune cell activation are significantly present in the top group (supplementary Table S1).
Moreover, we found specific enrichment of predicted
binding motifs for NF-jB 50 and NF-jB 65 in the top
5% of the genes among three others. We would expect
the other factors to be functionally related to NF-jB.
This is the case for STAT5A, which has been reported
to be involved in severe combined immunodeficiency
[36] and is involved in the immune response [37].
Please note that these statistics were obtained without
the initial seed group. Therefore, it would have been
possible in our example to determine with high certainty
from the constructed rank which seed group was used to
build up the rank, namely a group with NF-jB targets.
OPTN is a direct NF-jB target
We predict a list of new NF-jB targets that were not
in the initial seed (Table 1). Eight of the 16 predicted
novel targets have been previously confirmed. Three
other predicted NF-jB targets were experimentally
investigated in this study, and were identified as direct
Systematic TF target prediction
NF-jB targets. OPTN, Spi-B and CASP4 were in our
predicted list of new targets. Deletions in the OPTN
gene are causative for the adult-onset primary openangle glaucoma [38]. Glaucoma affects 67 million people worldwide [39], and is the second largest cause of
bilateral blindness in the world [40]. It has been suggested that OPTN is involved in the TNF-a signalling
pathway [41]; however, the molecular mode of action
has been unknown up to now. It has been suggested
that OPTN blocks the protective effect of E3-14.7K on
TNF-a-mediated cell killing, and hence OPTN may be
part of the TNF-a signalling pathway that can shift
the equilibrium towards induction of apoptosis [38,41].
Recently, it has been shown that OPTN increases cell
survival and translocates to the nucleus upon an apoptotic stimulus that is dependent upon the GTPase
activity of Rab8, an interaction partner of OPTN [42].
Interestingly, this protective function of OPTN is lost
when the OPTN protein is changed to the mutated
form E50K, which is typical for patients with normal
tension glaucoma [42]. We show that a deletion of a
putative NF-jB-binding site in the promoter region of
OPTN completely abolishes the enhancing action and
modulatory effect of NF-jB on OPTN (Fig. 6).
Our experiments show clearly that OPTN is a direct
target of NF-jB. Recent findings indicated that TNF-a
potentiates glutamate neurotoxicity through the
blockade of glutamate transporter activity [43,44]. Furthermore, it was shown that OPTN and NF-jB essential modulator (NEMO) are competitive inhibitors of
one another [45]. NEMO represents the regulatory
subunit of IKK, which is essential for NF-jB activation [46]. Together with our data, this makes it apparent that OPTN is part of a negative feedback system
that is important for NF-jB action. Elevated OPTN
expression reduces induced NF-jB activation [45], and
is therefore protective against induced neuronal cell
death, which depends on NF-jB activity. This is in
line with findings indicating that the protective function of OPTN is lost upon truncation resulting from
the insertion of a premature stop codon, and when the
OPTN protein is changed to the mutated form E50K,
which is markedly reduced in patients suffer from
glaucoma [42]. Our data provide the missing link in
the signalling of NF-jB and the damping function of
OPTN in signalling feedback of NF-jB.
The knowledge about the direct action of NF-jB on
OPTN will greatly enhance our understanding of the
signalling pathways relevant for antiapoptosis, and will
be helpful in designing possible new cell survival strategies in glaucoma patients.
The two other newly identified and verified target
genes of the NF-jB transcription factor seem to be
FEBS Journal 275 (2008) 3178–3192 ª 2008 The Authors Journal compilation ª 2008 FEBS
3185
Systematic TF target prediction
R. Mrowka et al.
A. Reporter gene activity
(a)
B. ChIP analysis
(a)
Control DNA
putative
Lucreportergene
NFkB site
–409
–409
Relative values
10.000
putative Lucreportergene
NFkB site
deletion
1.000
0.100
n.s.
0.010
0.001
Control TNF- Control
alpha
Input
Anti-rabbit-AB
TNFalpha
Anti-NFkB-AB
(b)
120
1000
100
800
80
600
60
400
40
P = 0.94
200
20
0
0
NFKBIA promoter
P < 4.2*10
1.25 ng·mL–1
2.5 ng·mL–1
5 ng·mL–1
10 ng·mL–1
20 ng·mL–1
Control
TNF- Control
alpha
Input
TNFalpha
Anti-rabbit-AB
Control
TNFalpha
Anti-NFkB-AB
(c)
–26
OPTN
10.000
TNF-alpha
1.8
1.6
1.4
1.2
1
0.8
0.6
0.4
0.2
0
Control
1.25 ng·mL–1
2.5 ng·mL–1
–1
5 ng·mL
10 ng·mL–1
20 ng·mL–1
P < 0.03
1.000
0.100
0.010
Control
TNFalpha
Control TNFalpha
Control TNFalpha
Anti-rabbit-AB
Input
OPTN
Anti-NFkB-AB
OPTN NFkB del
(d)
P < 4.2*10
(d)
–12
SPIB
10.000
45
TNF-alpha
40
1.25 ng·mL–1
30
Relative values
Control
35
2.5 ng·mL–1
5 ng·mL–1
25
10 ng·mL–1
20
20 ng·mL–1
15
10
1.000
P < 0.01
0.100
Control
5
0
SPI-B
(e)
0.35
1.25 ng·mL
0.3
2.5 ng·mL–1
–1
5 ng·mL–1
10 ng·mL–1
20 ng·mL–1
0.15
Anti-NFkB-AB
10.000
Control
0.2
Anti-rabbit-AB
TNFalpha
CASP4
TNF-alpha
0.25
TNF- Control
alpha
(e)
0.45
0.4
TNF- Control
alpha
Input
SPI-B NFkB del
P < 3.2*10–5
Luciferase activity (firefly/renilla)
P < 0.003
1.000
0.100
Relative values
Luciferase activity (firefly/renilla)
Control
DARS promoter
(c)
Luciferase activity (firefly/renilla)
NFKBIA
10.000
TNF-alpha
Relative values
P < 10–15
Relative values
1200
Luciferase activity(rel.values)
Luciferase activity (firefly/renilla)
(b)
1.000
0.100
n.s.
0.010
0.001
0.1
Control
0.05
0
CASP4
3186
TNF- Control
alpha
CASP4 NFkB del
Input
TNF- Control
alpha
TNFalpha
Control TNFalpha
Anti-rabbit-AB
Anti-NFkB-AB
FEBS Journal 275 (2008) 3178–3192 ª 2008 The Authors Journal compilation ª 2008 FEBS
R. Mrowka et al.
involved in important physiological processes related
to typical known functions of NF-jB. It is known
that the Spi-B transcription factor is expressed in
adult pro-T cells, with Spi-B being maximal in the
newly committed cells at the DN3 stage [47].
Furthermore, Spi-B can interfere with T-cell development [47]. CASP4 can function as an endoplasmic
reticulum stress-specific caspase in humans, and may
be involved in pathogenesis of Alzheimer’s disease
[48].
When does the seed-distribution-distance
method work?
The major assumption of our method is that genes
that are regulated by the same factor show at least
some coregulation. We use a genome-wide based similarity measure L(x) based on the comparisons of the
median values of two correlation distributions. For
each gene (x) in the genome, we calculate L(x), which
is the median correlation of gene x with all the genes
within the seed set minus the median correlation of
gene x with all the rest of the genes in the genome.
Our approach is able to ‘add up’ contributions form
all the genes in the seed set, and by the use of the median and not the mean, it can discard a reasonable
amount of outliers. Subtracting the median correlation
with the rest of the genome corrects for the correlation
structure of the expression dataset as a whole. We also
tried a more sophisticated scoring scheme by ranking
the genes on the basis of a Mann–Whitney rank-sum
test, which did not improve the performance of the
ranking procedure.
The seed-distribution-distance method is extremely
robust and produces high enrichment even if a considerable part of the seed is not present. This was shown
by the cross-validation procedure and the subsequent
recovery test.
Systematic TF target prediction
The seed-distribution-distance method is expected to
produce a biologically meaningful rank if the seed
group is homogeneous with respect to its expression
correlation. If, for instance, the seed group contains
completely unrelated expression clusters that are
located in the cluster space in a linearly independent
way, the resulting distance measure might not to be
capable of building up a transcription factor-specific
rank. In this case, one would need to cluster the seed
group into subseeds and to build up individual clusterspecific ranks. For instance, this might be necessary in
the case of transcription factors that target different
genes depending on the splice form of the transcription
factor. Interestingly, however, in our analysis, the performance of the method seems not to depend crucially
on the homogeneity of the expression of the seed
group, as some seed groups that performed well in the
cross-validation test had large intraseed variations
(supplementary Fig. S4).
A second consideration relates to the expression
dataset. The seed-distribution-distance method relies
on the assumption that the transcription factor of
interest shows some biological activity in the data. If,
for example, the transcription factor of interest is completely shut down in all experiments, one would not
expect to be able to recover the regulation response of
that factor. This issue might be of importance for
genes that are only active at tight periods during development. One solution to this problem would be to
generate expression experiments with artificial expression of that transcription factor or to include native
material from that developmental period in the microarray analysis.
The third consideration relates to the size of the
seed. One would expect that if the seed is too small to
define the target response adequately, the rank will be
poorly defined. However, our bootstrapping test
showed that 10 seed genes are capable of enriching
Fig. 6. Experimental validation of predicted NF-jB targets by functional analyses and physical NF-jB interaction with the predicted NF-jBbinding sites in the nuclear chromatin context. (A) RGA. HEK293 cells were transfected and treated for 24 h with TNF-a in a dose-dependent
manner (n = 4). (a) Schematic illustration of experimental design. RGA was measured with unmodified native promoter constructs (left column) and in constructs where the putative NF-jB-binding sites were deleted (right column, NF-jB del). (b) Promoter activity for NFKBIA,
which is known to be a target of NF-jB, and a negative control (DARS). Only the NFKBIA promoter responded in a dose-dependent manner
under stimulation with TNF-a. (c, d, e) RGA for the (c) OPTN, (d) SPI-B and (e) CASP4 promoter: All experiments showed a dose-dependent
increase in promoter activity under stimulation with TNF-a. Deletion of the putative NF-jB-binding site resulted in significantly attenuated
dose-dependent responses. (B) ChIP analysis. HEK293 cells were cultured with TNF-a (10 ngỈmL)1) or without (control) for 24 h prior to
crosslinking and ChIP using anti-rabbit serum (negative control) or an antibody to NF-jB. Relative values of immunoprecipitated DNA were
assessed by real-time PCR (n = 3). (a) Amplification of a coding region part of the intron-less gene encoding GAPDH, which should show no
promoter-like activity and contains no potential NF-jB-binding element, served as control DNA. (b–e) Verification of the predicted NF-jB-binding sites was obtained for the (b) positive control NFKBIA as well as (c) OPTN and (d) SPI-B. NF-jB-dependent activation of (e) the CASP4
promoter is not indicated by ChIP analysis in HEK293 cells.
FEBS Journal 275 (2008) 3178–3192 ª 2008 The Authors Journal compilation ª 2008 FEBS
3187
Systematic TF target prediction
R. Mrowka et al.
target genes considerably. At the other extreme, if, for
example the seed size approximates the ‘total number’
of targets, one cannot expect to recover many new targets. We assume that the latter does not apply for
most of the transcription factors.
Our aim was to provide a method to incorporate
large-scale microarray data to improve the detection
of functional binding sites for a given transcription
factor. To illustrate this, we decided to use matches of
consensus sequences as a simple parameter-free
method to detect binding sites in promoter sequences.
More sophisticated methods to detect transcription
factor-binding sites are available, and will very likely
enhance the performance, e.g. by having a strong statistical or physical model for binding based on positional frequency matrices [49–51], or by using
knowledge about cooperation among transcription factors [52]. Also, incorporating additional sequencebased information such as conservation of promoters
to related species is likely to improve the analysis.
Moreover, a better set of promoters derived from
experimentally determined promoters might further
improve the analysis [53]. Taken together, our results
suggest that the huge body of transcriptome data
available in databases can be used to strongly enhance
the prediction of transcription factor targets for cases
in which targeted microarray experiments are not
available or are too cost-intensive. The described systematic genome-wide approach for identification of
transcription factor targets is robust and efficient, and
systematically identifies new target genes for any given
transcription factor. We predict that the exploitation
of the expression data stored in public databases with
our or similar seed-based methods will improve the
search for new target genes of transcription factors.
Definition of the rank
For all gene pairs in the expression dataset, we calculated
the correlation coefficient in their expression:
P
P P
n xi yi À xi yi
qffiffiffiffiffiffiffiffiffiffiffiffiffiffiffiffiffiffiffiffiffiffiffiffiffiffiffiffiffiffiffiffiffiffiqffiffiffiffiffiffiffiffiffiffiffiffiffiffiffiffiffiffiffiffiffiffiffiffiffiffiffiffiffiffiffiffiffiffi
¼
P
P
P
P
n xi2 À ð xi Þ2 n yi2 À ð yi Þ2
with xi and yi being their the expression values of gene x
and gene y in experiment i. We omitted experiments in the
calculation of the correlation coefficient where one of the
genes had no expression value, and discarded correlation
coefficients for further analysis if the number of common
experiments that could be used to calculate the correlation
coefficient was 10 or fewer. Given a seed group, we then
3188
Molecular cloning
The OPTN promoter and a part of the 5¢-UTR was cloned
into the pGL3-Basic (Cat. no. E1751; Promega GmbH,
Mannheim, Germany) plasmid at the SacI and HindIII sites
using the tailed primers opti423F (5¢-ACTGAGCTCGGC
ATTCTCCTCTTTCTGTGG-3¢) and opti423R (5¢-ACGT
AAGCTTGGTGCCTAGGGCTGATGCGC-3¢).
The predicted NF-jB-binding site, corresponding to
ccgggaaattcccc, was deleted from the reporter gene construct by means of a PCR strategy. The following primer
inserts were verified by DNA sequencing.
The controls DARS and NFKBIA were generated using
the MluI ⁄ XhoI sites of pGL-3Basic. Inserts were generated
by PCR using the MluI ⁄ XhoI tailed primers DARSfw
(5¢-ACTACGCGTAGTCCAAGAGAGGAGAAACC-3¢)
and DARSrv (5¢-ACTCTCGAGCCCGGAGCGCTGGCG
GCCGC-3¢), and NFKBIAfw (5¢-ACTGAGCTCCCGA
CGACCCCAATTCAAATCG-3¢) and NFKBIArv (5¢-ACT
GAAGCTTTGTGGGCTCTGCAGCGCCGC-3¢).
The SPI-B and CASP constructs were generated using
the MluI ⁄ XhoI tailed primers SPI-Bfw (5¢-ACTGAGCTC
GTGAACCCCAGCCCTTCCTCGAT-3¢) and SPI-Brv
(5¢-ACTGAAGCTTGGTGGTGCCGGGCGGGCTGT-3¢),
and the SacI ⁄ HindIII tailed primers CASP4fw (5¢-ACT
ACGCGTAGCAAAGAGTGCTGCCTCCTCCTTCCT-3¢)
and CASP4rv (5¢-ACTCTCGAGTTCCCTGGTACAGAG
CACCT-3¢). The predicted NF-jB-binding site gggggaa
tcccc in the CASP4 construct and the predicted NF-jBbinding site ggggatcccc of SPI-B were deleted using a PCR
strategy.
Transient cell transfection
Experimental procedures
rx;y
calculate a score L(x) for all genes x outside the seed by
taking the median correlation to the seed and subtracting
the median correlation to all genes (i.e. its random median
correlation).
HEK293 cells were cultured in 96-well plates (lClear Platte
96K; Greiner BIO-ONE GmbH, Frickenhausen, Germany)
in DMEM (high glucose; PAA Laboratories GmbH, Colbe,
ă
Germany), supplemented with 10% heat-inactivated fetal
bovine serum, 50 UặmL)1 penicillin, 50 lgỈmL)1 streptomycin, 15 mm Hepes and 2 mmolỈL)1 glutamine, at 37 °C in a
5% CO2 atmosphere.
Cotransfections were performed with the firefly luciferase
pGL3-basic vector (Promega), as well as its transformed
promoter variants, and the Renilla luciferase phRL-TK
vector using the RotiFect Reagent (Carl Roth GmbH,
Karlsruhe, Germany), according to the manufacturer’s protocol. After 6 h, the transfection medium was removed, and
medium supplemented with TNF-a solvent (controls) or
medium supplemented with TNF-a (1.25–20 ngỈmL)1,
n = 4 each) was added, and cells were incubated for 24 h.
FEBS Journal 275 (2008) 3178–3192 ª 2008 The Authors Journal compilation ª 2008 FEBS
R. Mrowka et al.
Luciferase assays
Cells were lysed after 24 h of treatment using 30 lL of
passive lysis buffer (Cat. no. E1941; Promega) after medium removal and gentle washing with NaCl ⁄ Pi. The
assays were performed on a Luminoskan RS (Labsystems
Luminoscan RS, Helsinki, Finland) plate-luminometer
using the injector system. The firefly luminescence was
measured by injecting 100 lL of buffer 1 (470 lm d-luciferin, 270 lm CoA, 33.3 mm dithiothreitol, 530 lm ATP,
2.67 mm MgSO4, 20 mm Tricine, 0.1 mm EDTA), and the
Renilla luminescence was measured after injecting 100 lL
of buffer 2 (1.1 m NaCl, 2.2 mm Na2EDTA, 0.22 m
KxPO4, pH 5.1, 0.44 mgỈmL)1 BSA, 1.3 mm NaN3,
1.43 lm coelenterazin, adjusted finally to pH 5.0; all compounds were obtained from PJK, Germany). The Luminoskan RS device was automatically controlled by a PC
using customized software (in-house development by
R. Mrowka).
The relative light units of firefly luminescence were
divided by the relative light units of Renilla luminescence
of each well to obtain normalization with respect to cell
number and transfection efficacy.
ChIP
HEK293 cells were cultured for 24 h under control conditions or TNF-a (10 ngỈmL)1) treatment as described before.
The final cell number was 2 · 107 cells per dish. The cells
were then treated with formaldehyde (1% final concentration). The crosslinking procedure was stopped after 15 min
by adding glycine (125 mm final concentration). For ChIP,
the ChIP assay kit [Cat. no. 17-295; Millipore GmbH
(Upstate), Schwalbach ⁄ Ts, Germany] was applied according
to the manufacturer’s protocol, and an anti-(rabbit serum)
(Cat. no. sc-2317, negative antibody control Santa Cruz
Biotechnology, Inc., Heidelberg, Germany) and an antibody to NF-jB p65 (A) (Cat. no. sc-109; Santa Cruz Biotechnology, Inc.) were used. The immunoprecipitated DNA
was purified and then quantified by real-time PCR (GeneAmp 5700; Applied Biosystems, Darmstadt, Germany) using
SYBR green and the ready-to-use heat-activated ImmoMix
(Cat. no. 25020; Bioline, Luckenwalde, Germany). The
following primers, bridging the predicted NF-jB-binding
sites, were used for ChIP analysis: NFKBIA forward,
5¢-ACCCCAGCTCAGGGTTTAGGCTTCT-3¢; NFKBIA
reverse, 5¢-TGGCTGGGGATTTCTCTGGG-3¢; OPTN
forward, 5¢-ACCCGGGTCCCAGCCTCGAC-3¢; OPTN
reverse, 5¢-GACAGCCAGCCGCTCCCTGC-3¢; SPI-B forward, 5¢-TCCAGCTCCTGTCCCATCTC-3¢; SPI-B reverse,
5¢-TGTCACATGGCAGGGATGGC-3¢; and CASP4 forward, 5¢-GTCTGGCAACCCCTGTTGAAT-3¢; CASP4
reverse, 5¢-GCCTGCTGGCTCTGAAGAGTATC-3¢. Amplification of a coding region part of the intron-less
gene encoding glyceraldehyde-3-phosphate dehydrogenase
Systematic TF target prediction
(GAPDH: forward, 5¢-CACCATCTTCCAGGAGCGAG-3¢;
and reverse, 5¢-GCAGGAGGCATTGCTGAT-3¢) served as
control DNA.
Databases
The sequences of the 500 bp upstream regions of all human
genes, as well as the annotation with terms from the gene
ontology, were obtained from emsembl [54], using the tool
ensmart [55]. In this analysis, we neglect the problem of
multiple promoters, and assume that the beginning of the
longest transcript in ensembl for a gene is the transcription
start site. Binding matrix data come from TRANSCFAC
version 6.1 [56]. Human microarray data were obtained
from the Stanford Microarray database [27], as used in Stuart et al. [26], which contains a collection of 1202 experiments form different independent investigations, including
expression profiles from cancer samples, cell lines and different tissue samples, and expression data from studies of
diverse biological processes, including cell cycle, stress, signalling, and apoptosis. All preprocessing, such as normalization of the microarray data, is described in Stuart et al.
[26]. This set contains 13 555 gene entries, and 12 435 genes
were matched to ensembl genes. Those matched genes
were used for further analysis and the seed-distribution-distance method. For the gene ontology analysis, we used all
8915 genes of the dataset that had a gene ontology annotation in the ensembl database. The seed group was defined
by collecting all NF-jB target genes mentioned in an
NF-jB review paper [25]. These genes were matched to
human ensembl gene entries, resulting in 81 NF-jB seed
genes. Joining those genes with available genes in the
expression set resulted in 60 NF-jB seed genes. These 60
resulting genes for NF-jB and the other transcription factors analysed in this study are given in supplementary
Table S2.
Statistics
Enrichment of putative transcription factor binding
sites in the top group
The binomial test was used to test for binding site enrichment in the top group. The two categories for the binomial
were: gene having a specific binding site is in the top group,
gene is not in the top group. The null hypothesis was that
there is no deviation of the observed distribution from the
theoretical distribution that would be present if there was
no preference. The alternative hypothesis was that there is
a deviation in a one-tailed manner (enrichment, depletion).
The consensus sequences for vertebrate transcription factors
from transfac version 6.1 [56] were used for prediction, and transcription factors with a minimum genomewide promoter hit count of 30 were included in the
analysis.
FEBS Journal 275 (2008) 3178–3192 ª 2008 The Authors Journal compilation ª 2008 FEBS
3189
Systematic TF target prediction
R. Mrowka et al.
Reporter gene activity
For the concentration- and group-dependent analysis, we
applied a two-way anova with repeated measurement statistics, and the null hypothesis was rejected at the 0.05 level.
Reporter gene activity is presented as mean and standard
deviation.
8
9
Gene ontology overrepresentation
Genes were annotated with gene ontology annotation using
ENSMART. For each gene ontology term, we then tested
whether it is overrepresented in the annotation of the upper
600 genes using a multiple-testing corrected Fisher’s exact
test. This test is based on the hypergeometric distribution
and calculates a false-discovery rate for each P-value
threshold. We selected a maximum expectable falsediscovery rate of 0.05 to determine significantly overrepresented terms. Details of the test are described in [57].
Acknowledgements
11
12
13
14
We would like to thank H. Herzel, H.-G. Holzutter,
ă
C. Gille, S. Kielbasa, H. Scholz, A. Patzak and J. Siemens for helpful discussions. N. Bluthgen acknowledges
ă
support from DFG, SFB 618 Theoretical Biology. MF
acknowledges support from DFG FA 84512-1.
15
16
References
1 Banerjee N & Zhang MQ (2002) Functional genomics
as applied to mapping transcription regulatory networks. Curr Opin Microbiol 5, 313–317.
2 Cohen CD, Klingenhoff A, Boucherot A, Nitsche A,
Henger A, Brunner B, Schmid H, Merkle M, Saleem
MA, Koller KP et al. (2006) Comparative promoter
analysis allows de novo identification of specialized cell
junction-associated proteins. Proc Natl Acad Sci USA
103, 5682–5687.
3 Wingender E, Chen X, Fricke E, Geffers R, Hehl R,
Liebich I, Krull M, Matys V, Michael H, Ohnhauser R
et al. (2001) The TRANSFAC system on gene expression regulation. Nucleic Acids Res 29, 281–283.
4 Sandelin A, Alkema W, Engstrom P, Wasserman WW
& Lenhard B (2004) JASPAR: an open-access database
for eukaryotic transcription factor binding profiles.
Nucleic Acids Res 32, D91–D94.
5 Wasserman WW & Sandelin A (2004) Applied bioinformatics for the identification of regulatory elements.
Nat Rev Genet 5, 276–287.
6 Bulyk ML (2003) Computational prediction of transcription-factor binding site locations. Genome Biol 5,
201, doi: 10.1186/gb-2003-5-1-201.
7 Wasserman WW, Palumbo M, Thompson W, Fickett
JW & Lawrence CE (2000) Human–mouse genome
3190
10
17
18
19
20
21
22
comparisons to locate regulatory sites. Nat Genet 26,
225–228.
Dieterich C, Grossmann S, Tanzer A, Ropcke S, Arndt
PF, Stadler PF & Vingron M (2005) Comparative promoter region analysis powered by CORG. BMC
Genomics 6, 24, doi: 10.1186/1471-2164-6-24.
Eisen MB, Spellman PT, Brown PO & Botstein D
(1998) Cluster analysis and display of genome-wide
expression patterns. Proc Natl Acad Sci USA 95,
14863–14868.
Quackenbush J (2001) Computational analysis of microarray data. Nat Rev Genet 2, 418–427.
Beissbarth T (2006) Interpreting experimental results
using gene ontologies. Methods Enzymol 411, 340–352.
Bluthgen N, Kielbasa SM & Herzel H (2005) Inferring
combinatorial regulation of transcription in silico.
Nucleic Acids Res 33, 272–279.
Qian Z, Lu L, Liu X, Cai YD & Li Y (2007) An
approach to predict transcription factor DNA binding
site specificity based upon gene and transcription factor
functional categorization. Bioinformatics 23, 2449–2454.
Walker MG, Volkmuth W & Klingler TM (1999)
Pharmaceutical target discovery using Guilt-by-Association: schizophrenia and Parkinson’s disease genes. Proc
Int Conf Intell Syst Mol Biol, 282–286.
Li A & Horvath S (2007) Network neighborhood analysis with the multi-node topological overlap measure.
Bioinformatics 23, 222–231.
Tullai JW, Schaffer ME, Mullenbrock S, Kasif S &
Cooper GM (2004) Identification of transcription factor
binding sites upstream of human genes regulated by the
phosphatidylinositol 3-kinase and MEK ⁄ ERK signaling
pathways. J Biol Chem 279, 20167–20177.
Levenson JM, Choi S, Lee SY, Cao YA, Ahn HJ, Worley KC, Pizzi M, Liou HC & Sweatt JD (2004) A bioinformatics analysis of memory consolidation reveals
involvement of the transcription factor c-rel. J Neurosci
24, 3933–3943.
Barenco M, Tomescu D, Brewer D, Callard R, Stark J
& Hubank M (2006) Ranked prediction of p53 targets
using hidden variable dynamic modeling. Genome Biol
7, R25.
Liu D, Umbach DM, Peddada SD, Li L, Crockett PW
& Weinberg CR (2004) A random-periods model for
expression of cell-cycle genes. Proc Natl Acad Sci USA
101, 7240–7245.
Brown PO & Botstein D (1999) Exploring the new
world of the genome with DNA microarrays. Nat Genet
21, 33–37.
Dai X, He J & Zhao X (2007) A new systematic computational approach to predicting target genes of transcription factors. Nucleic Acids Res 35, 4433–4440.
Sarkar FH & Li Y (2008) NF-kappaB: a potential
target for cancer chemoprevention and therapy. Front
Biosci 13, 2950–2959.
FEBS Journal 275 (2008) 3178–3192 ª 2008 The Authors Journal compilation ª 2008 FEBS
R. Mrowka et al.
23 Carmody RJ & Chen YH (2007) Nuclear factor-kappaB: activation and regulation during toll-like receptor
signaling. Cell Mol Immunol 4, 31–41.
24 Hayden MS & Ghosh S (2004) Signaling to NF-kappaB. Genes Dev 18, 2195–2224.
25 Wu JT & Kral JG (2005) The NF-kappaB ⁄ IkappaB signaling system: a molecular target in breast cancer therapy. J Surg Res 123, 158–169.
26 Stuart JM, Segal E, Koller D & Kim SK (2003) A
gene-coexpression network for global discovery of conserved genetic modules. Science 302, 249–255.
27 Demeter J, Beauheim C, Gollub J, Hernandez-Boussard
T, Jin H, Maier D, Matese JC, Nitzberg M, Wymore F,
Zachariah ZK et al. (2007) The Stanford Microarray
Database: implementation of new analysis tools and
open source release of software. Nucleic Acids Res 35,
D766–D770.
28 Dieterich C, Cusack B, Wang H, Rateitschak K, Krause A & Vingron M (2002) Annotating regulatory
DNA based on man–mouse genomic comparison. Bioinformatics 18(Suppl. 2), S84–S90.
29 Bracken AP, Ciro M, Cocito A & Helin K (2004) E2F
target genes: unraveling the biology. Trends Biochem
Sci 29, 409–417.
30 Xu X, Bieda M, Jin VX, Rabinovich A, Oberley MJ,
Green R & Farnham PJ (2007) A comprehensive ChIPchip analysis of E2F1, E2F4, and E2F6 in normal and
tumor cells reveals interchangeable roles of E2F family
members. Genome Res 17, 1550–1561.
31 Sementchenko VI & Watson DK (2000) Ets target genes:
past, present and future. Oncogene 19, 6533–6548.
32 Hollenhorst PC, Shah AA, Hopkins C & Graves BJ
(2007) Genome-wide analyses reveal properties of
redundant and specific promoter occupancy within the
ETS gene family. Genes Dev 21, 1882–1894.
33 Semenza GL (2003) Targeting HIF-1 for cancer therapy. Nat Rev Cancer 3, 721–732.
34 Fernandez PC, Frank SR, Wang L, Schroeder M, Liu
S, Greene J, Cocito A & Amati B (2003) Genomic
targets of the human c-Myc protein. Genes Dev 17,
1115–1129.
35 Wasserman WW & Fickett JW (1998) Identification of
regulatory regions which confer muscle-specific gene
expression. J Mol Biol 278, 167–181.
36 Yao Z, Cui Y, Watford WT, Bream JH, Yamaoka K,
Hissong BD, Li D, Durum SK, Jiang Q, Bhandoola A
et al. (2006) Stat5a ⁄ b are essential for normal lymphoid
development and differentiation. Proc Natl Acad Sci
USA 103, 1000–1005.
37 Moriggl R, Sexl V, Piekorz R, Topham D & Ihle JN
(1999) Stat5 activation is uniquely associated with cytokine signaling in peripheral T cells. Immunity 11, 225–
230.
38 Rezaie T, Child A, Hitchings R, Brice G, Miller L,
Coca-Prados M, Heon E, Krupin T, Ritch R, Kreutzer
Systematic TF target prediction
39
40
41
42
43
44
45
46
47
48
49
50
51
52
53
D et al. (2002) Adult-onset primary open-angle glaucoma caused by mutations in optineurin. Science 295,
1077–1079.
Quigley HA (1996) Number of people with glaucoma
worldwide. Br J Ophthalmol 80, 389–393.
Quigley HA & Vitale S (1997) Models of open-angle
glaucoma prevalence and incidence in the United States.
Invest Ophthalmol Vis Sci 38, 83–91.
Li Y, Kang J & Horwitz MS (1998) Interaction of an
adenovirus E3 14.7-kilodalton protein with a novel
tumor necrosis factor alpha-inducible cellular protein
containing leucine zipper domains. Mol Cell Biol 18,
1601–1610.
De Marco N, Buono M, Troise F & Diez-Roux G
(2006) Optineurin increases cell survival and translocates to the nucleus in a Rab8-dependent manner upon
an apoptotic stimulus. J Biol Chem 281, 16147–16156.
Beg AA & Baltimore D (1996) An essential role for
NF-kappaB in preventing TNF-alpha-induced cell
death. Science 274, 782–784.
Zou JY & Crews FT (2005) TNF alpha potentiates glutamate neurotoxicity by inhibiting glutamate uptake in
organotypic brain slice cultures: neuroprotection by
NF kappa B inhibition. Brain Res 1034, 11–24.
Zhu G, Wu CJ, Zhao Y & Ashwell JD (2007) Optineurin negatively regulates TNFalpha-induced NF-kappaB
activation by competing with NEMO for ubiquitinated
RIP. Curr Biol 17, 1438–1443.
Rudolph D, Yeh WC, Wakeham A, Rudolph B, Nallainathan D, Potter J, Elia AJ & Mak TW (2000) Severe
liver degeneration and lack of NF-kappaB activation in
NEMO ⁄ IKKgamma-deficient mice. Genes Dev 14, 854–
862.
David-Fung ES, Yui MA, Morales M, Wang H, Taghon
T, Diamond RA & Rothenberg EV (2006) Progression of
regulatory gene expression states in fetal and adult proT-cell development. Immunol Rev 209, 212–236.
Hitomi J, Katayama T, Eguchi Y, Kudo T, Taniguchi
M, Koyama Y, Manabe T, Yamagishi S, Bando Y,
Imaizumi K et al. (2004) Involvement of caspase-4 in
endoplasmic reticulum stress-induced apoptosis and
Abeta-induced cell death. J Cell Biol 165, 347–356.
Benos PV, Lapedes AS & Stormo GD (2002) Is there a
code for protein–DNA recognition? Probab(ilistical)ly.
Bioessays 24, 466–475.
Stormo GD (2000) DNA binding sites: representation
and discovery. Bioinformatics 16, 16–23.
Roider HG, Kanhere A, Manke T & Vingron M (2007)
Predicting transcription factor affinities to DNA from a
biophysical model. Bioinformatics 23, 134–141.
Frith MC, Li MC & Weng Z (2003) Cluster-buster:
finding dense clusters of motifs in DNA sequences.
Nucleic Acids Res 31, 3666–3668.
Sandelin A, Carninci P, Lenhard B, Ponjavic J, Hayashizaki Y & Hume DA (2007) Mammalian RNA
FEBS Journal 275 (2008) 3178–3192 ª 2008 The Authors Journal compilation ª 2008 FEBS
3191
Systematic TF target prediction
54
55
56
57
58
59
60
61
62
63
64
R. Mrowka et al.
polymerase II core promoters: insights from genomewide studies. Nat Rev Genet 8, 424–436.
Hubbard T, Barker D, Birney E, Cameron G, Chen Y,
Clark L, Cox T, Cuff J, Curwen V, Down T et al.
(2002) The Ensembl genome database project. Nucleic
Acids Res 30, 38–41.
Hammond MP & Birney E (2004) Genome information
resources – developments at Ensembl. Trends Genet 20,
268–272.
Wingender E, Dietze P, Karas H & Knuppel R (1996)
TRANSFAC: a database on transcription factors and
their DNA binding sites. Nucleic Acids Res 24, 238–241.
Bluthgen N, Brand K, Cajavec B, Swat M, Herzel H &
Beule D (2005) Biological profiling of gene groups utilizing gene ontology. Genome Inform Ser Workshop
Genome Inform 16, 106–115.
Sun SC, Ganchi PA, Ballard DW & Greene WC (1993)
NF-kappa B controls expression of inhibitor I kappaB
alpha: evidence for an inducible autoregulatory pathway. Science 259, 1912–1915.
Edbrooke MR, Burt DW, Cheshire JK & Woo P (1989)
Identification of cis-acting sequences responsible for
phorbol ester induction of human serum amyloid A
gene expression via a nuclear factor kappaB-like transcription factor. Mol Cell Biol 9, 1908–1916.
O’Donnell SM, Holm GH, Pierce JM, Tian B, Watson
MJ, Chari RS, Ballard DW, Brasier AR & Dermody
TS (2006) Identification of an NF-kappaB-dependent
gene network in cells infected by mammalian reovirus.
J Virol 80, 1077–1086.
Guitart A, Riezu-Boj JI, Elizalde E, Larrea E, Berasain
C, Aldabe R, Civeira MP & Prieto J (2005) Hepatitis C
virus infection of primary tupaia hepatocytes leads to
selection of quasispecies variants, induction of interferon-stimulated genes and NF-kappaB nuclear translocation. J Gen Virol 86, 3065–3074.
Hosokawa Y, Suzuki H, Nakagawa M, Lee TH & Seto
M (2005) API2–MALT1 fusion protein induces
transcriptional activation of the API2 gene through
NF-kappaB binding elements: evidence for a positive
feed-back loop pathway resulting in unremitting
NF-kappaB activation. Biochem Biophys Res Commun
334, 51–60.
Lombardi L, Ciana P, Cappellini C, Trecca D, Guerrini
L, Migliazza A, Maiolo AT & Neri A (1995) Structural
and functional characterization of the promoter regions
of the NFKB2 gene. Nucleic Acids Res 23, 2328–2336.
Grall F, Gu X, Tan L, Cho JY, Inan MS, Pettit AR,
Thamrongsak U, Choy BK, Manning C, Akbarali Y
et al. (2003) Responses to the proinflammatory
3192
cytokines interleukin-1 and tumor necrosis factor alpha
in cells derived from rheumatoid synovium and other
joint tissues involve nuclear factor kappaB-mediated
induction of the Ets transcription factor ESE-1. Arthritis Rheum 48, 1249–1260.
Supplementary material
The following supplementary material is available
online:
Doc. S1. Information about the microarray experiments.
Doc. S2. Seed_ranks.zip: the zip archive contains files
of the results of the seed distribution method for
the different transcription factors described in this
article.
Fig. S1. Histograms of correlation coefficients from
expression data for three individual genes.
Fig. S2. Cumulative histograms of the cross-validation
analysis with different seed sizes.
Fig. S3. Cross-validation of the seed distribution
method in for six different transcription factors by
means of the median-based ranking procedure as used
in the article and a ranking procedure based on P-values of Mann–Whitney statistics.
Fig. S4. Histograms of correlation coefficients of
expression data for individual seed groups and all
possible pairs.
Table S1. Analysis of the overrepresented gene ontology classifications of the top 600 genes in the rank
with a false discovery rate of less than 1 0.001.
Table S2. List of ensembl gene IDs used as seeds for
the seed distribution method of this article.
Table S3. Literature sources of the seed lists.
Table S4. Distribution of enrichment of putative transcription factor-binding motifs (transfac) in the ranking after applying the seed-distribution-distance
method.
Table S5. Sequences of the NF-jB consensi that have
been used in the analysis.
This material is available as part of the online article
from
Please note: Blackwell Publishing are not responsible
for the content or functionality of any supplementary
materials supplied by the authors. Any queries (other
than missing material) should be directed to the corresponding author for the article.
FEBS Journal 275 (2008) 3178–3192 ª 2008 The Authors Journal compilation ª 2008 FEBS