financial accounting tools for business decision making 6e solution manual chapter 2
Bạn đang xem bản rút gọn của tài liệu. Xem và tải ngay bản đầy đủ của tài liệu tại đây (365.02 KB, 61 trang )
Kimmel, Weygandt, Kieso, Trenholm, Irvine
Financial Accounting, Sixth Canadian Edition
CHAPTER 2
A Further Look at Financial Statements
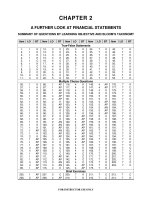
ASSIGNMENT CLASSIFICATION TABLE
Study Objectives
Questions
Brief
Exercises
Exercises
A
Problems
B
Problems
BYP
1. Identify the sections of a
classified statement of
financial position.
1, 2, 3, 4,
5, 6, 7
1, 2, 3, 4
1, 2, 3, 4,
5
1, 2, 3, 4
1, 2, 3, 4
1, 4, 6
2. Identify and calculate
ratios for analyzing a
company's liquidity,
solvency and profitability.
8, 9, 10,
11, 12, 13,
14, 15
5, 6, 7
6, 7, 8
5, 6, 7, 8
5, 6, 7, 8
2, 4, 7
3. Describe the framework
for the preparation and
presentation of financial
statements.
16, 17, 18,
19, 20, 21,
22, 23, 24,
25
8, 9, 10
9, 10
9, 10
9, 10
3, 5, 7
Solutions Manual
2-1
Chapter 2
Copyright © 2014 John Wiley & Sons Canada, Ltd. Unauthorized copying, distribution, or transmission of this page is strictly prohibited.
Kimmel, Weygandt, Kieso, Trenholm, Irvine
Financial Accounting, Sixth Canadian Edition
ASSIGNMENT CHARACTERISTICS TABLE
Problem
Number
Description
Difficulty
Level
Time
Allotted (min.)
Moderate
15-25
Simple
15-25
1A
Classify accounts.
2A
Prepare assets section.
3A
Prepare liabilities and equity sections.
Moderate
15-25
4A
Prepare financial statements; discuss relationships.
Moderate
15-25
5A
Calculate ratios and comment on liquidity, solvency,
and profitability.
Simple
10-20
6A
Calculate ratios and comment on liquidity, solvency,
and profitability.
Moderate
20-30
7A
Calculate ratios and comment on liquidity, solvency,
and profitability.
Simple
10-20
8A
Comment on liquidity, solvency, and profitability.
Moderate
15-20
9A
Discuss financial reporting objective, qualitative
characteristics, and elements.
Moderate
15-20
10A
Discuss bases of measurement.
Moderate
20-30
1B
Classify accounts.
Moderate
15-25
2B
Prepare assets section.
Simple
15-25
3B
Prepare liabilities and equity sections.
Moderate
15-25
4B
Prepare financial statements; discuss relationships.
Moderate
15-25
5B
Calculate ratios and comment on liquidity, solvency,
and profitability.
Simple
10-20
6B
Calculate ratios and comment on liquidity, solvency,
and profitability.
Moderate
20-30
Solutions Manual
2-2
Chapter 2
Copyright © 2014 John Wiley & Sons Canada, Ltd. Unauthorized copying, distribution, or transmission of this page is strictly prohibited.
Kimmel, Weygandt, Kieso, Trenholm, Irvine
Financial Accounting, Sixth Canadian Edition
ASSIGNMENT CHARACTERISTICS TABLE (Continued)
Problem
Number
Description
Difficulty
Level
Time
Allotted (min.)
Simple
10-20
7B
Calculate ratios and comment on liquidity, solvency,
and profitability.
8B
Comment on liquidity, solvency, and profitability.
Moderate
15-20
9B
Discuss financial reporting objective, qualitative
characteristics, and elements.
Moderate
15-20
Moderate
20-30
10B
Identify bases of measurement.
ASSIGNMENT CHARACTERISTICS TABLE
Solutions Manual
2-3
Chapter 2
Copyright © 2014 John Wiley & Sons Canada, Ltd. Unauthorized copying, distribution, or transmission of this page is strictly prohibited.
Kimmel, Weygandt, Kieso, Trenholm, Irvine
Financial Accounting, Sixth Canadian Edition
ANSWERS TO QUESTIONS
1.
Current assets are assets that are expected to be converted into cash, sold, or used
up within one year of the company’s financial statement date or its operating cycle,
whichever is longer. Examples of current assets include: cash, accounts receivable,
merchandise inventory and supplies.
2.
The term operating cycle stands for the average time it takes to go from cash to cash
in producing revenue. In a merchandising business, this means the time it takes to
purchase inventory, pay cash to suppliers, sell the inventory on account, and then
collect cash from customers. In a service business, it stands for the time it takes to
pay employees, provide services on account, and then collect the cash from
customers.
3.
(a)
Current assets are assets that are expected to be converted into cash, sold, or
used up within one year of the company’s financial statement date or its
operating cycle, whichever is longer. Non-current assets are assets that are not
expected to be converted into cash, sold, or used up by the business within one
year of the financial statement date or its operating cycle. In other words, noncurrent assets are all assets that are not classified as current assets.
(b)
Current assets are assets that are expected to be converted into cash, sold, or
used up within one year of the company’s financial statement date or its
operating cycle, whichever is longer. Current liabilities are obligations that are
to be paid or settled within one year of the company’s financial statement date
or its operating cycle, whichever is longer. Ideally, current assets will exceed
current liabilities for a company.
Showing items as current in nature matters because doing so assists the user
of the financial statements to assess the business’s liquidity.
4.
(a)
Current liabilities are obligations that are to be paid or settled within one year of
the company’s financial statement date or its operating cycle, whichever is
longer.
(b)
Examples of current liabilities include: bank indebtedness, accounts payable,
accrued liabilities and current maturities of long-term debt.
Solutions Manual
2-4
Chapter 2
Copyright © 2014 John Wiley & Sons Canada, Ltd. Unauthorized copying, distribution, or transmission of this page is strictly prohibited.
Kimmel, Weygandt, Kieso, Trenholm, Irvine
Financial Accounting, Sixth Canadian Edition
Answers to Questions (Continued)
5.
(a)
(b)
The major differences between current liabilities and non-current liabilities are:
Difference
Source of payment
Current Liabilities
Existing current assets
or other current liabilities
Non-Current Liabilities
Other than existing current
assets or other current
liabilities
Time of expected
payment
Within one year
Beyond one year
Nature of items
Debts pertaining to the
Mortgages, notes, loans,
operating cycle and other bonds, and other nonshort-term debts
current liabilities
Some liabilities, such as bank loans, appear on the statement of financial
position with a current and non-current portion. Included in the balance of the
bank loan payable are principal payments that will be due in the next year. That
amount must be shown as a current liability as of the company’s financial
statement date. The remaining principal balance is classified as a non-current
liability.
6.
The two components of shareholders' equity and the purpose of each are: (1) Share
capital is used to record investments of assets, ie. cash, in the business by the owners
(shareholders). If there is only one class of shares, it is known as common shares. (2)
Retained earnings is used to record accumulated profit, net of any losses and
dividends paid, retained in the business.
7.
Statements, using the common practice among North American companies, are
prepared by classifying the items on the statement of financial position in order of
liquidity, ranking the items with the most liquidity first.
The statement of financial position prepared using a reverse-liquidity order shows
assets first, followed by shareholders’ equity and liabilities. The assets section starts
with non-current assets followed by current assets. Non-current assets include
goodwill and intangible assets; property, plant, and equipment; and long-term
investments, which are normally grouped under a non-current heading. This differs
from the separate disclosure of non-current assets without a heading that is more
usual in North America. Within the current assets section, items are listed in reverse
order of liquidity; that is, cash is normally shown last. Items within the property, plant,
and equipment section are normally listed in order of permanency. Shareholders’
equity is shown next, followed by liabilities. The liabilities section presents non-current
liabilities before current liabilities, and current liabilities are listed in reverse order of
liquidity similar to current assets.
Solutions Manual
2-5
Chapter 2
Copyright © 2014 John Wiley & Sons Canada, Ltd. Unauthorized copying, distribution, or transmission of this page is strictly prohibited.
Kimmel, Weygandt, Kieso, Trenholm, Irvine
Financial Accounting, Sixth Canadian Edition
Answers to Questions (Continued)
8.
(a)
Liquidity ratios measure a company’s short-term ability to pay its current
liabilities and meet its unexpected needs for cash. Examples of liquidity ratios
include: Working capital and current ratio.
(b)
Solvency ratios measure a company’s ability to survive over a long period of
time. An example of a solvency ratio is the debt to total assets ratio.
(c)
Profitability ratios measure a company’s operating success for a given period of
time. Examples of profitability ratios include: Earnings per share and priceearnings ratio.
9.
The current ratio is a better measure of liquidity than working capital when making
comparisons between different businesses. The amount of working capital is an
absolute amount. It could vary tremendously depending on the size of the operations
of the business. The current ratio on the other hand presents a relationship of the
amount of current assets compared to current liabilities and is therefore appropriate as
a tool to compare the liquidity of different size businesses.
10.
Current assets include accounts receivable and inventory. These may have increasing
balances because of uncollectible receivables or slow-moving inventory. This would
cause the current ratio to increase. Even though the current ratio may seem high, it is
an artificial measure of liquidity if receivables and inventory cannot be easily or quickly
convertible into cash. Consequently, the current ratio alone does not provide a
complete assessment of liquidity.
11.
Dong Corporation is more solvent as only 45% of its assets are financed by debt
whereas 55% of Du's assets are financed by debt. A company carrying a higher
proportion of debt has an increased likelihood of encountering financial difficulties and
is therefore considered less solvent.
12.
Raising money using debt adds more risk to a company than raising money through
equity because the terms of repayment of debt require cash outflows for the payment
of interest and repayment of principal. These payments tap into cash balances that
could hurt the company’s liquidity. In contrast to debt, equity does not have to be
repaid.
13.
Earnings per share comparisons among different companies are difficult due to
variations in the financing structure of the companies and in the number of shares
issued. Hence, there is no industry average for earnings per share. On the other hand,
since the price-earnings ratio uses earnings per share relative to the market price of
the common shares, the ratio can be compared among companies.
Solutions Manual
2-6
Chapter 2
Copyright © 2014 John Wiley & Sons Canada, Ltd. Unauthorized copying, distribution, or transmission of this page is strictly prohibited.
Kimmel, Weygandt, Kieso, Trenholm, Irvine
Financial Accounting, Sixth Canadian Edition
Answers to Questions (Continued)
14.
Investors appear to favour TD Bank. Its higher price-earnings ratio indicates that
investors are willing to pay more for the company's shares and have more favourable
expectations of future growth.
15.
Increases in the earnings per share, price-earnings ratio, and the current ratio are
considered to be signs of improvement because:
•
An increase in the earnings per share means that the amount of profit per share
is greater than in the previous period.
•
An increase in the price-earnings ratio means that the share price has
increased at a greater rate than the company’s earnings per share, which
implies the market believes future profit will continue to increase.
•
An increase in the current ratio indicates that the company has more current
assets available to settle its current liabilities and is more liquid (assuming the
components of current assets (e.g., receivables and inventory) are also liquid.
On the other hand, the debt to total assets ratio measures how much of the company
is financed by debt. The more debt a company has, the higher the debt to total assets
ratio. A company with a higher debt level has increased financial risk due to higher
fixed interest and principal repayments, and is less solvent than a company with a
lower level of debt.
16.
(a) The conceptual framework is a coherent system of interrelated objectives and
fundamentals that can lead to consistent standards. The framework prescribes the
nature, function, and limits of financial accounting statements. It guides choices
about what to present in financial statements, decisions about alternative ways of
reporting economic events, and the selection of appropriate ways of
communicating such information.
(b) Internationally, the conceptual framework may vary from country to country.
Canadian companies use the same framework, whether they are reporting under
IFRS or under ASPE.
17.
(a) The primary objective of financial reporting is to provide information useful to
existing and potential investors, lenders, and other creditors in making decisions
about providing resources to the company.
(b) The main users of financial reporting are investors, lenders, and other creditors.
Solutions Manual
2-7
Chapter 2
Copyright © 2014 John Wiley & Sons Canada, Ltd. Unauthorized copying, distribution, or transmission of this page is strictly prohibited.
Kimmel, Weygandt, Kieso, Trenholm, Irvine
Financial Accounting, Sixth Canadian Edition
Answers to Questions (Continued)
18.
The going concern assumption states that the business will remain in operation for the
foreseeable future. The timing of when the asset will be converted to cash or used in
operations and when liabilities are to be paid determines their classification on the
statement of financial position. Since the business is expected to remain in operation
for the foreseeable future, these elements can continue to be reported in accordance
with their respective current or non-current classifications. If the company were about
to be shut down, all of its assets and liabilities would be classified as current.
19.
The fundamental qualitative characteristics are (1) relevance and (2) faithful
representation.
Relevant information will impact a user’s decision by having predictive value,
confirmatory value or both. Faithful representation means that the financial statements
should reflect the economic reality of what really exits or has happened. The
information must be complete, neutral, and free from material error.
20.
Materiality is related to relevance in that they are both defined in terms of what
influences or makes a difference to the decision-maker. In order to be relevant to a
financial statement user, a transaction or amount must make a difference to the user
in the making of a decision. An item is considered to be material if its omission or
misstatement could influence the decision.
21.
The four enhancing qualitative characteristics are (1) comparability, (2) verifiability, (3)
timeliness, and (4) understandability. There is no prescribed order in applying these
characteristics.
22.
The cost constraint means that information will be presented only when the benefit
associated with it exceeds the cost of providing it. In attempting to fulfill a
completeness objective when obtaining financial information, one could expend
considerable resources. The cost of this search may greatly outweigh any benefit in
achieving the completeness objective. Consequently, the search for completeness will
be restricted by this constraint.
23.
The elements of financial statements are broad categories or classes of financial
statement effects of transactions and other events. They include assets, liabilities,
equity, income (including gains), and expenses (including losses). The grouping is
selected in accordance with the economic characteristics of the transactions.
Solutions Manual
2-8
Chapter 2
Copyright © 2014 John Wiley & Sons Canada, Ltd. Unauthorized copying, distribution, or transmission of this page is strictly prohibited.
Kimmel, Weygandt, Kieso, Trenholm, Irvine
Financial Accounting, Sixth Canadian Edition
Answers to Questions (Continued)
24.
The two bases are historical cost and fair value. The fair value basis of accounting is
applied to those assets which are intended to be sold and whose fair value is readily
available. Securities traded on the stock exchanges would be a good example of
assets reported at their fair value. The historical cost basis of accounting is used for
most of the remaining assets used by the business. Since in most cases the intention
is to use the assets to earn revenue, the fair value of the asset is not as relevant as its
cost.
25.
In order to be relevant for decision making, the measurement of elements of financial
statements need to reflect amounts that are reliable. For assets that are intended to
be sold, the current fair value of the assets becomes the most relevant measurement
as it approximates the current amount of cash that could be obtained on the sale of
the asset. On the other hand, for assets held for use by the corporation, the value at
resale is not as relevant to the financial statement user. In that case, the cost of the
assets is the better measurement for reporting the financial statement element. For
example, inventory will become cost of goods sold when sold. It is relevant to compare
the actual cost of the inventory to the amount of the revenue generated from its sale.
Using the cost basis of accounting gives a faithful representation of the transaction
that has occurred from the sale of inventory.
Solutions Manual
2-9
Chapter 2
Copyright © 2014 John Wiley & Sons Canada, Ltd. Unauthorized copying, distribution, or transmission of this page is strictly prohibited.
Kimmel, Weygandt, Kieso, Trenholm, Irvine
Financial Accounting, Sixth Canadian Edition
SOLUTIONS TO BRIEF EXERCISES
BRIEF EXERCISE 2-1
(a)
(b)
(c)
(d)
(e)
(f)
(g)
(h)
5
1
3
3
1
4
8
5
Accounts payable
Accounts receivable
Accumulated depreciation
Buildings
Cash
Patents
Dividends
Income tax payable
(i)
(j)
(k)
(l)
(m)
(n)
(o)
(p)
(q)
2
3
1
7
1
6
5
1
5
Long-term Investments
Land
Merchandise inventory
Common shares
Supplies
Mortgage payable, due in 20 years
Current portion of mortgage payable
Prepaid insurance
Unearned revenue
BRIEF EXERCISE 2-2
SWANN LIMITED
Statement of Financial Position (Partial)
Assets
Current assets
Cash
Accounts receivable
Merchandise inventory
Supplies
Prepaid insurance
Total current assets
$16,400
14,500
9,000
4,200
3,900
$48,000
BRIEF EXERCISE 2-3
SHUM CORPORATION
Statement of Financial Position (Partial)
Property, plant, and equipment
Land
Buildings
Less: Accumulated depreciation—buildings
Equipment
Less: Accumulated depreciation—equipment
Total property, plant, and equipment
$ 65,000
$110,000
33,000
$70,000
25,000
77,000
45,000
$187,000
Solutions Manual
2-10
Chapter 2
Copyright © 2014 John Wiley & Sons Canada, Ltd. Unauthorized copying, distribution, or transmission of this page is strictly prohibited.
Kimmel, Weygandt, Kieso, Trenholm, Irvine
Financial Accounting, Sixth Canadian Edition
BRIEF EXERCISE 2-4
HIRJIKAKA INC.
Statement of Financial Position (Partial)
Current liabilities
Accounts payable
Salaries payable
Interest payable
Income tax payable
Unearned revenue
Current portion of mortgage payable
Total current liabilities
$22,500
3,900
5,200
6,400
900
5,000
$43,900
BRIEF EXERCISE 2-5
(a)
($ in thousands)
2012
Working capital:
Working capital:
$453,629 – $229,503 = $224,126
$336,980 – $235,365 = $101,615
Current ratio:
$453,629 = 2.0:1
$229,503
(b)
2011
Current ratio:
$336,980 = 1.4:1
$235,365
The working capital more than doubled in 2012 and the current ratio increased
substantially when compared to 2011. Indigo's liquidity has improved in 2012
compared with 2011.
Solutions Manual
2-11
Chapter 2
Copyright © 2014 John Wiley & Sons Canada, Ltd. Unauthorized copying, distribution, or transmission of this page is strictly prohibited.
Kimmel, Weygandt, Kieso, Trenholm, Irvine
Financial Accounting, Sixth Canadian Edition
BRIEF EXERCISE 2-6
(a)
(in USD millions)
2012
Debt to total assets ratio:
($1,566.8 + $711.8) = 51.2%
($1,337.4 + $3,115.8)
(b)
2011
Debt to total assets ratio:
($977.4 + $969.4) = 49.6%
($1,242.2 + $2,684.0)
The company’s solvency was weaker in 2012 compared with 2011 because total debt
has increased as a proportion of total assets.
BRIEF EXERCISE 2-7
(a)
($ in thousands)
2012
(b)
2011
Earnings per share:
Earnings per share:
$46,782 = $0.67 per share
70,033
$56,666 = $0.81 per share
69,969
Price-earnings ratio:
Price-earnings ratio:
$12.99 = 19.4 times
$ 0.67
$12.40 = 15.3 times
$ 0.81
The decrease in profit and in the earnings per share during the year would indicate
that profitability has deteriorated in 2012. In spite of the decline in profit, investors
appear to have more confidence in Leon’s future profit as indicated by the increase in
the price-earnings ratio in 2012.
Solutions Manual
2-12
Chapter 2
Copyright © 2014 John Wiley & Sons Canada, Ltd. Unauthorized copying, distribution, or transmission of this page is strictly prohibited.
Kimmel, Weygandt, Kieso, Trenholm, Irvine
Financial Accounting, Sixth Canadian Edition
BRIEF EXERCISE 2-8
(a)
(b)
(c)
(d)
(e)
(f)
Faithful representation
Verifiability
Understandability
Cost
Going concern
Fair value
BRIEF EXERCISE 2-9
(a)
(b)
(c)
(d)
(e)
(f)
(g)
(h)
(i)
(j)
(k)
(l)
(m)
10
5
1
2
4
13
8
12
9
3
11
6
7
BRIEF EXERCISE 2-10
(a)
Sosa Ltd. has purchased the land for sale and not for use. The current fair value of
the land becomes the most relevant measurement as it approximates the current
amount of cash that could be obtained on the sale of the asset.
(b)
Mohawk has purchased land for use and not for sale. The current fair value is not as
relevant to the financial statement user in this case. The historical cost of the land is
the better measurement for reporting the land on the statement of financial position.
Solutions Manual
2-13
Chapter 2
Copyright © 2014 John Wiley & Sons Canada, Ltd. Unauthorized copying, distribution, or transmission of this page is strictly prohibited.
Kimmel, Weygandt, Kieso, Trenholm, Irvine
Financial Accounting, Sixth Canadian Edition
SOLUTIONS TO EXERCISES
EXERCISE 2-1
(a)
(b)
(c)
(d)
(e)
(f)
(g)
(h)
(i)
(j)
(k)
(l)
(m)
(n)
5
1
3
3
7
5
5
4
5
1
1
3
6
1
Accounts payable and accrued liabilities
Accounts receivable
Accumulated depreciation
Buildings and leasehold improvements
Common shares
Current maturities of long-term debt
Dividends payable
Goodwill
Income and other taxes payable
Income and other taxes receivable
Inventories
Land
Long-term debt
Prepaid expenses
Solutions Manual
2-14
Chapter 2
Copyright © 2014 John Wiley & Sons Canada, Ltd. Unauthorized copying, distribution, or transmission of this page is strictly prohibited.
Kimmel, Weygandt, Kieso, Trenholm, Irvine
Financial Accounting, Sixth Canadian Edition
EXERCISE 2-2
BIG ROCK BREWERY INC.
Statement of Financial Position (partial)
December 31, 2012
(in thousands)
Assets
Current assets
Cash
Accounts receivable
Inventories
Prepaid expenses and other
Total current assets
Property, plant, and equipment
Land
Buildings
Less: Accumulated depreciation
Machinery and equipment
Less: Accumulated depreciation
Mobile equipment
Less: Accumulated depreciation
Office furniture
Less: Accumulated depreciation
Total property, plant, and equipment
Intangible assets
Total assets
$4,281
2,358
3,892
364
$10,895
$ 2,516
$11,070
827
$20,800
6,480
$645
149
$310
140
10,243
14,320
496
170
27,745
128
$38,768
Solutions Manual
2-15
Chapter 2
Copyright © 2014 John Wiley & Sons Canada, Ltd. Unauthorized copying, distribution, or transmission of this page is strictly prohibited.
Kimmel, Weygandt, Kieso, Trenholm, Irvine
Financial Accounting, Sixth Canadian Edition
EXERCISE 2-3
SAPUTO INC.
Statement of Financial Position (partial)
March 31, 2012
(in thousands)
Liabilities and Shareholders' Equity
Current liabilities
Accounts payable and accrued liabilities
Income taxes payable
Bank loans payable
Total current liabilities
Non-current liabilities
Long-term debt
Deferred income taxes payable
Other long-term liabilities
Total non-current liabilities
Total liabilities
Shareholders' equity
Common shares
Retained earnings
Total shareholders’ equity
Total liabilities and shareholders' equity
$571,814
163,996
166,631
$ 902,441
$379,875
156,632
54,486
590,993
1,493,434
$ 629,606
1,467,108
2,096,714
$3,590,148
Solutions Manual
2-16
Chapter 2
Copyright © 2014 John Wiley & Sons Canada, Ltd. Unauthorized copying, distribution, or transmission of this page is strictly prohibited.
Kimmel, Weygandt, Kieso, Trenholm, Irvine
Financial Accounting, Sixth Canadian Edition
EXERCISE 2-4
(a)
Profit
= Revenues – Expenses
= $73,040 – $5,000 – $4,750 – $48,680
= $14,610
Retained earnings = Beginning retained earnings + Profit – Dividends
= $66,520 + $14,610 – $0
= $81,130
(b)
SUMMIT LTD.
Statement of Financial Position
December 31, 2015
Assets
Current assets
Cash
Accounts receivable
Supplies
Prepaid insurance
Total current assets
Long-term investments
Property, plant, and equipment
Land
Buildings
Less: Accumulated depreciation
Equipment
Less: Accumulated depreciation
Total property, plant, and equipment
Total assets
$ 15,040
13,780
740
390
29,950
30,000
$54,000
$128,800
45,600
$62,400
17,770
83,200
44,630
181,830
$241,780
Liabilities and Shareholders' Equity
Current liabilities
Accounts payable
Interest payable
Current portion of mortgage payable
Total current liabilities
Mortgage payable ($95,000 – $13,600)
Total liabilities
Shareholders' equity
Common shares
Retained earnings
Total shareholders’ equity
Total liabilities and shareholders' equity
$14,050
1,600
13,600
$ 29,250
81,400
110,650
$50,000
81,130
131,130
$241,780
Solutions Manual
2-17
Chapter 2
Copyright © 2014 John Wiley & Sons Canada, Ltd. Unauthorized copying, distribution, or transmission of this page is strictly prohibited.
Kimmel, Weygandt, Kieso, Trenholm, Irvine
Financial Accounting, Sixth Canadian Edition
EXERCISE 2-5
BATRA CORPORATION
Income Statement
Year Ended July 31, 2015
Revenues
Service revenue
Rent revenue
Total revenues
Expenses
Salaries expense
Rent expense
Depreciation expense
Utilities expense
Interest expense
Supplies expense
Total expenses
Profit before income tax
Income tax expense
Profit
$81,100
18,500
99,600
$44,700
10,800
3,000
2,600
2,000
900
64,000
35,600
5,000
$30,600
BATRA CORPORATION
Statement of Changes in Equity
Year Ended July 31, 2015
Balance, August 1, 2014
Issued common shares
Profit
Dividends
Balance, July 31, 2015
Common
Shares
Retained
Earnings
$ 6,000
4,000
$17,940
000 000
$10,000
30,600
(12,000)
$36,540
Total Equity
$23,940
4,000
30,600
(12,000)
$46,540
Solutions Manual
2-18
Chapter 2
Copyright © 2014 John Wiley & Sons Canada, Ltd. Unauthorized copying, distribution, or transmission of this page is strictly prohibited.
Kimmel, Weygandt, Kieso, Trenholm, Irvine
Financial Accounting, Sixth Canadian Edition
EXERCISE 2-5 (Continued)
BATRA CORPORATION
Statement of Financial Position
July 31, 2015
Assets
Current assets
Cash
Trading investments
Accounts receivable
Supplies
Total current assets
Property, plant, and equipment
Equipment
Less: Accumulated depreciation
Total property, plant, and equipment
Total assets
$ 5,060
20,000
17,100
1,500
$43,660
$35,900
6,000
29,900
$73,560
Liabilities and Shareholders' Equity
Current liabilities
Accounts payable
Interest payable
Bank loan payable
Total liabilities
Shareholders' equity
Common shares
Retained earnings
Total shareholders’ equity
Total liabilities and shareholders' equity
$ 4,220
1,000
21,800
$27,020
$10,000
36,540
46,540
$73,560
Solutions Manual
2-19
Chapter 2
Copyright © 2014 John Wiley & Sons Canada, Ltd. Unauthorized copying, distribution, or transmission of this page is strictly prohibited.
Kimmel, Weygandt, Kieso, Trenholm, Irvine
Financial Accounting, Sixth Canadian Edition
EXERCISE 2-6
(a)
Current ratio:
$60,000
$40,000
(b)
= 1.5:1
Current ratio:
($60,000 – $20,000 )= 2:1
($40,000 – $20,000
(c)
The request of the CFO to pay off an accounts payable ahead of the due date is
clearly done to manipulate the current ratio. His instructions to make the payment
came after he was presented with the calculation of the current ratio. In this case the
current ratio which is meant to show Padilla’s liquidity position has been artificially
altered by a simple payment on account.
That said, it is not unethical to pay an account payable in advance of its due date.
Rather, it is the motivation for the transaction that would lead one to conclude that the
CFO is acting unethically.
Solutions Manual
2-20
Chapter 2
Copyright © 2014 John Wiley & Sons Canada, Ltd. Unauthorized copying, distribution, or transmission of this page is strictly prohibited.
Kimmel, Weygandt, Kieso, Trenholm, Irvine
Financial Accounting, Sixth Canadian Edition
EXERCISE 2-7
(a)
(in millions)
2012
2011
Working capital:
$103.5 – $30.8 = $72.7
Working capital:
$77.3 – $78.0 = $(0.7)
Current ratio:
$103.5
$30.8
= 3.4:1
$77.3
$78.0
= 1.0:1
Debt to total assets ratio:
($30.8 + $114.8) = 45.3%
($103.5 + 217.8)
(b)
($78.0 + $218.2)
($77.3 + $422.5)
= 59.3%
Huntingdon’s liquidity and solvency improved dramatically in 2012 when compared to
2011.
(c)
2012
Working capital (in millions)
Current ratio
Debt to total assets ratio
Huntingdon
$72.7
3.4:1
45.3%
Plazacorp
$(48.6)
0.1:1
58.6%
First
Capital
$12.8
1.0:1
55.4%
Industry
n/a
0.9:1
65.0%
First
Capital
$(276.6)
0.5:1
58.7%
Industry
n/a
2.0:1
71.0%
2011
Working capital (in millions)
Current ratio
Debt to total assets ratio
Huntingdon
$(0.7)
1.0:1
59.3%
Plazacorp
$(8.9)
0.7:1
63.9%
Solutions Manual
2-21
Chapter 2
Copyright © 2014 John Wiley & Sons Canada, Ltd. Unauthorized copying, distribution, or transmission of this page is strictly prohibited.
Kimmel, Weygandt, Kieso, Trenholm, Irvine
Financial Accounting, Sixth Canadian Edition
EXERCISE 2-7 (Continued)
(c) (Continued)
Based on working capital and the current ratio, Huntingdon’s liquidity is the best
(highest) of the three companies, as the current ratio far exceeds the ratios for
Plazacorp and First Capital as well as the industry average. Compared to 2011, all
companies improved working capital and the current ratio except Plazacorp which has
the worst (lowest), with insufficient current assets to cover its current liabilities and
with a negative working capital position.
Based on the debt to total assets ratio, which improved for all three companies and for
the industry as a whole, Huntingdon’s solvency is the best of the three companies,
exceeding the industry average by a large margin. Plazacorp’s solvency is the worst of
the three companies, as is its liquidity.
EXERCISE 2-8
(a)
(in thousands)
2012
2011
Earnings per share:
Earnings per share:
$264,583 = $0.67 per share
395,234
Price-earnings ratio:
$19.59
$0.67
(b)
= 29.2 times
$449,844
394,662
= $1.14 per share
Price-earnings ratio:
$18.41
$1.14
= 16.1 times
The decrease in the earnings per share during the year would indicate that profitability
has deteriorated dramatically in 2012. However, investors appear to have more
confidence in Cameco's future profitability as indicated by the increase in the priceearnings ratio in 2012 and by the increase in the share price in 2012.
Solutions Manual
2-22
Chapter 2
Copyright © 2014 John Wiley & Sons Canada, Ltd. Unauthorized copying, distribution, or transmission of this page is strictly prohibited.
Kimmel, Weygandt, Kieso, Trenholm, Irvine
Financial Accounting, Sixth Canadian Edition
EXERCISE 2-9
(a)
(b)
(c)
(d)
(e)
(f)
7
10
11
3
2
8
(g)
(h)
(i)
(j)
(k)
(l)
1
6
4
5
9
12
EXERCISE 2-10
1.
(a) The cost basis of accounting is involved in this situation.
(b) The cost basis of accounting has been violated. The land was reported at its fair
value when it should have remained at its historical cost.
2.
(a) The fair value basis of accounting is involved in this situation.
(b) The principle has not been violated since the parcel of land is being held for resale
and not for use.
3.
(a) The assumption involved in this situation is the going concern assumption.
(b) The going concern assumption has been violated. The elements on the statement
of financial position should have been classified between current and non-current.
Solutions Manual
2-23
Chapter 2
Copyright © 2014 John Wiley & Sons Canada, Ltd. Unauthorized copying, distribution, or transmission of this page is strictly prohibited.
Kimmel, Weygandt, Kieso, Trenholm, Irvine
Financial Accounting, Sixth Canadian Edition
SOLUTIONS TO PROBLEMS
PROBLEM 2-1A
Item
Accumulated depreciation
Cash
Common (ordinary) shares
Current income tax payable
Current income tax recoverable
Interest-bearing loans and borrowings (current)
Interest-bearing loans and borrowings (non-current)
Inventories
Investments
Plant, equipment, and vehicles
Trade and other payables
Trade and other receivables
Trademarks
Statement of Financial
Position Category
Contra asset to plant, equipment,
and vehicles in the property, plant,
and equipment section
Current assets
Share capital
Current liabilities
Current assets
Current liabilities
Non-current liabilities
Current assets
Non-current assets
Property, plant, and equipment
Current liabilities
Current assets
Intangible assets
Solutions Manual
2-24
Chapter 2
Copyright © 2014 John Wiley & Sons Canada, Ltd. Unauthorized copying, distribution, or transmission of this page is strictly prohibited.
Kimmel, Weygandt, Kieso, Trenholm, Irvine
Financial Accounting, Sixth Canadian Edition
PROBLEM 2-2A
(a)
Item
Accounts receivable
Accumulated depreciation—aircraft
Accumulated depreciation—buildings
Accumulated depreciation—ground
property and equipment
Accumulated depreciation—leasehold
Improvements
Accumulated depreciation—spare
engines and parts
Aircraft
Buildings
Cash
Ground property and equipment
Inventory
Intangible assets
Leasehold improvements
Other assets
Prepaid expenses, deposits, and other
Spare engines and parts
Statement of Financial
Position Category
Current assets
Property, plant, and equipment (contra account)
Property, plant, and equipment (contra account)
Property, plant, and equipment (contra account)
Property, plant, and equipment (contra account)
Property, plant, and equipment (contra account)
Property, plant, and equipment
Property, plant, and equipment
Current assets
Property, plant, and equipment
Current assets
Intangible assets
Property, plant, and equipment
Other assets
Current assets
Property, plant, and equipment
Solutions Manual
2-25
Chapter 2
Copyright © 2014 John Wiley & Sons Canada, Ltd. Unauthorized copying, distribution, or transmission of this page is strictly prohibited.