financial accounting tools for business decision making 6e solution manual chapter 6
Bạn đang xem bản rút gọn của tài liệu. Xem và tải ngay bản đầy đủ của tài liệu tại đây (718.98 KB, 94 trang )
Kimmel, Weygandt, Kieso, Trenholm, Irvine
Financial Accounting, Sixth Canadian Edition
CHAPTER 6
Reporting and Analyzing Inventory
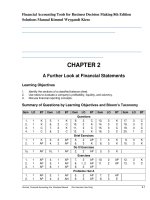
ASSIGNMENT CLASSIFICATION TABLE
Study Objectives
Questions
Brief
Exercises
Exercises
1. Describe the steps in
determining inventory
quantities.
1, 2, 3, 4
1, 2
1, 2
2. Apply the methods of
cost determination using
specific identification,
FIFO, and average
under a perpetual
inventory system.
5, 6, 7,
*18, *20,
*21
3, 4, 5, 6,
*14, *15
3. Explain the effects on
financial statement of
choosing each of the
inventory cost
determination methods.
8, 9, 10
4. Identify the effects of
inventory errors on the
financial statements
A
Problems
1A
B
Problems
BYP
1B
3, 6
3, 4, 5, 6, 2A, 3A,
7, *15, *16 4A, 5A,
6A, *15A,
*16A
2B, 3B,
4B, 5B,
6B, *15B,
*16B
3, 5,
6, 7
7
3, 6, 7, 12
3A, 5A
3B, 5B
1, 3,
5, 7
11, 12, 13
8, 9
8, 9
4A, 7A, 8A 4B, 7B, 8B 4
5. Demonstrate the
presentation and
analysis of inventory.
14, 15, 16,
17
10, 11, 12
10, 11, 12
6A, 7A,
8A, 9A,
10A, 11A,
12A, *14A
*6. Apply the FIFO and
average cost inventory
cost determination
methods under a
periodic inventory
system (Appendix 6A).
*18, *19,
*20, *21
*13, *14,
*15
*13, *14,
*15, *16
*13A,
*13B,
*14A,
*14B,
*15A, *16A *15B, *16B
6B, 7B,
8B, 9B,
10B, 11B,
12B, *14B
1, 2, 4
*Note: All asterisked Questions, Exercises, and Problems relate to material contained in the
appendices to each chapter.
Solutions Manual
6-1
Chapter 6
Copyright © 2014 John Wiley & Sons Canada, Ltd. Unauthorized copying, distribution, or transmission of this page is strictly prohibited.
Kimmel, Weygandt, Kieso, Trenholm, Irvine
Financial Accounting, Sixth Canadian Edition
ASSIGNMENT CHARACTERISTICS TABLE
Problem
Number
Description
Difficulty
Level
Time
Allotted (min.)
Simple
30-40
1A
Identify items in inventory.
2A
Apply specific identification.
Moderate
30-40
3A
Apply perpetual FIFO and answer questions about
effects.
Moderate
30-40
4A
Apply perpetual average cost and discuss errors.
Moderate
30-40
5A
Apply perpetual FIFO and average cost; compare
effects.
Moderate
35-45
6A
Record transactions using perpetual average cost;
apply LCNRV.
Moderate
30-40
7A
Determine effects of inventory error for two years.
Moderate
20-25
8A
Determine effects of inventory errors for multiple
years.
Moderate
25-30
9A
Determine and record LCNRV.
Moderate
15-25
10A
Record and present LCNRV valuation for multiple
periods.
Moderate
15-25
11A
Calculate ratios and comment on liquidity.
Moderate
25-30
12A
Compare ratios; comment on liquidity and profitability. Moderate
25-30
*13A
Apply periodic FIFO and average cost.
Moderate
25-35
*14A
Prepare partial financial statements and assess
effects.
Moderate
20-30
*15A
Apply perpetual and periodic FIFO.
Moderate
25-35
*16A
Apply perpetual and periodic average cost.
Moderate
25-35
Simple
30-40
1B
Identify items in inventory.
Solutions Manual
6-2
Chapter 6
Copyright © 2014 John Wiley & Sons Canada, Ltd. Unauthorized copying, distribution, or transmission of this page is strictly prohibited.
Kimmel, Weygandt, Kieso, Trenholm, Irvine
Financial Accounting, Sixth Canadian Edition
ASSIGNMENT CHARACTERISTICS TABLE (Continued)
Problem
Number
2B
Description
Apply specific identification.
Difficulty
Level
Moderate
Time
Allotted (min.)
25-35
3B
Apply perpetual FIFO and answer questions about
effects.
Moderate
30-40
4B
Apply perpetual average cost and discuss errors.
Moderate
30-40
5B
Apply perpetual FIFO and average cost; compare
effects.
Moderate
30-40
6B
Record transactions using perpetual FIFO; apply
LCNRV.
Moderate
30-40
7B
Determine effects of inventory error for two years.
Moderate
25-35
8B
Determine effects of inventory errors for multiple
years.
Moderate
25-35
9B
Determine and record LCNRV.
Moderate
15-25
10B
Record and present LCNRV valuation for multiple
periods.
Moderate
15-25
11B
Calculate ratios and comment on liquidity.
Moderate
25-30
12B
Compare ratios; comment on liquidity and profitability. Moderate
25-30
*13B
Apply periodic FIFO and average cost.
Moderate
25-35
*14B
Prepare partial financial statements and assess
effects.
Moderate
20-30
*15B
Apply perpetual and periodic FIFO.
Moderate
25-35
*16B
Apply perpetual and periodic average cost.
Moderate
25-35
Solutions Manual
6-3
Chapter 6
Copyright © 2014 John Wiley & Sons Canada, Ltd. Unauthorized copying, distribution, or transmission of this page is strictly prohibited.
Kimmel, Weygandt, Kieso, Trenholm, Irvine
Financial Accounting, Sixth Canadian Edition
ANSWERS TO QUESTIONS
1. Taking a physical inventory involves actually counting, weighing or measuring each kind
of inventory on hand. Retailers, such as hardware stores, generally have thousands of
different items to count. This is normally done when the store is closed to minimize errors
due to the movement of merchandise. Tom will probably count items and mark the
quantity, description, and inventory number on pre-numbered inventory tags (unless the
company has more advanced technology that can read bar codes on inventory products
– we will assume that they do not). He should only include items in the inventory that are
in saleable condition.
Ideally, strong internal control should be exerted over the physical inventory count. For
example, Tom should not have responsibility for the custody or record-keeping for the
inventory. He should also count in teams of two, or there should be a second counter
checking the accuracy of the count.
Adjustments may also have to be made to the physical inventory count for any goods in
transit. For example, inventory purchased FOB shipping point that is still in transit will
have to be included in inventory. Inventory that has been shipped by Kikujiro to
customers FOB destination and not received by the customer before year-end will also
have to be included in the count. Finally, any of Kikujiro’s inventory held by other retailers
on consignment will have to be included in the count as well.
2.
Internal control consists of all the related methods and measures adopted within an
organization to help it achieve reliable financial reporting, effective and efficient
operations, and compliance with relevant laws and regulations. The use of internal
control procedures will result in a more accurate and reliable inventory count.
For example, the counting should be done by employees who do not have responsibility
for the custody or record-keeping for the inventory. Each counter should verify the
validity of each inventory item by checking that the items actually exist, how many there
are and what condition they are in. To ensure accuracy, counting should be completed in
teams of two and all inventory counts should be rechecked. Finally pre-numbered
inventory tags should be used to ensure that all inventory is counted and none is
counted twice. The pre-numbering of the tags will assist in the retracing of the count
back to the physical inventory on hand and will also assist in establishing to the
completeness of the count, when the inventory is compiled from the tags.
3.
(a) The goods will be included in Janine Ltd.’s (the seller’s) inventory if the terms of sale
are FOB destination.
(b) The goods will be included in Fastrak Corporation’s (the buyer’s) inventory if the
terms of sale are FOB shipping point.
Solutions Manual
6-4
Chapter 6
Copyright © 2014 John Wiley & Sons Canada, Ltd. Unauthorized copying, distribution, or transmission of this page is strictly prohibited.
Kimmel, Weygandt, Kieso, Trenholm, Irvine
Financial Accounting, Sixth Canadian Edition
Answers to Questions (Continued)
4.
(a) Include: the inventory items belong to Kingsway.
(b) Include: the inventory items belong to Kingsway.
(c) Exclude: the customer has purchased the inventory item and legal ownership has
passed to the customer.
5. The specific identification method tracks the physical flow of individual inventory items,
matching the cost of the actual item sold against the revenue from that item. An example
of inventory where the specific identification would be appropriate would be for goods
that are not ordinarily interchangeable, such as automobiles with unique serial numbers.
The FIFO inventory cost method assumes the first inventory purchased is the first
inventory sold. The most recent purchases are assumed to remain in ending inventory.
Inventory such as groceries could be accounted for using the FIFO cost method since
older items should be sold first. The average cost method assumes that all goods
available for sale are indistinguishable or homogeneous. Inventory such as hardware
could be accounted for using an average cost method.
6. Average assumes that the goods available for sale are identical. FIFO assumes that the
first goods purchased are the first to be sold. Specific identification matches the actual
physical flow of merchandise.
7. A new weighted average unit cost must be calculated after each purchase because a
new cost amount is added to the “cost pool”. This changes the total dollars in the cost
pool and the quantity of units on hand in the cost pool. A sale withdraws units and total
dollars from the cost pool at the weighted average cost. This does not affect the
weighted average cost of the remaining units. That is, the weighted average cost of the
remaining units is unchanged after a sale.
8. A company should consider:
• Whether the goods are interchangeable or not, or whether they are produced or
segregated for specific projects;
• Whether the method corresponds most closely to the physical flow of goods;
• Whether the method reports inventory on the statement of financial position that is
close to the inventory’s most recent cost; and
• Whether the method is used for other inventories with a similar nature and usage.
9. Average produces the better income statement valuation because the cost of goods sold
is determined using more recent inventory prices. This better matches current costs with
current revenues.
FIFO produces the better valuation on the statement of financial position because the
ending inventory is determined using the most recent prices. Since the normal intent is to
replace the inventory after it is sold, the most recent prices are more relevant for
decision-making.
Solutions Manual
6-5
Chapter 6
Copyright © 2014 John Wiley & Sons Canada, Ltd. Unauthorized copying, distribution, or transmission of this page is strictly prohibited.
Kimmel, Weygandt, Kieso, Trenholm, Irvine
Financial Accounting, Sixth Canadian Edition
Answers to Questions (Continued)
10. (a) No effect – cash is not affected by the choice of inventory cost methods.
(b) In a period of declining prices, FIFO will produce a lower ending inventory as
inventory is determined using the most recent (lower) prices. Average will produce a
higher ending inventory as ending inventory incorporates the higher older prices.
(c) The cost of goods sold effect is opposite to that of ending inventory. Hence, cost of
goods sold will be higher under FIFO and lower under the average cost method.
(d) Because of the effect on the cost of goods sold as outlined in (c), profit will be lower
under FIFO and higher under average.
(e) The impact on retained earnings will be the same as the impact on profit and ending
inventory—lower in a period of declining prices using FIFO and higher using average
cost.
11. The error should be corrected if it will change the figures presented on the financial
statements. While retained earnings may not change, other financial statement items and
comparative figures may change. This information may impact a user’s decision.
12. (a) Mila Ltd.’s 2014 profit will be understated by $5,000. This is because an
understatement of ending inventory will result in an overstatement of cost of goods
sold. If cost of goods sold is overstated, then profit will be understated.
(b) 2014 retained earnings will be understated by $5,000 because profit is understated
(see (a) above).
(c) 2014 total shareholders’ equity will be understated by $5,000 because the retained
earnings balance is understated (see (b) above).
(d) 2015 profit will be overstated $5,000. This is because beginning inventory is
understated by $5,000, which will result in an understatement of cost of goods sold
(recognizing that 2014 ending inventory is 2015 beginning inventory). If cost of
goods sold is understated, then profit will be overstated.
(e) 2015 retained earnings will be correct because the understatement in profit in 2014
and overstatement in 2015 will cancel each other.
(f) 2015 total shareholders’ equity will be correct because the retained earnings
balance is correct.
Solutions Manual
6-6
Chapter 6
Copyright © 2014 John Wiley & Sons Canada, Ltd. Unauthorized copying, distribution, or transmission of this page is strictly prohibited.
Kimmel, Weygandt, Kieso, Trenholm, Irvine
Financial Accounting, Sixth Canadian Edition
Answers to Questions (Continued)
13. (a) At the end of the fiscal year, before the inventory is adjusted to the inventory count,
Shediac’s assets (Merchandise Inventory) would be overstated and its liabilities
would be overstated (Accounts Payable). There would be no effect on shareholders’
equity.
(b) Since the merchandise is not on hand at the time of the inventory count, the
shipment from Bathurst would not be counted. This in turn would cause the inventory
count to be lower than the perpetual inventory record. Normally when such a
discrepancy arises, the Inventory account will be adjusted downward with a credit to
reflect the amount of merchandise actually on hand. The corresponding debit in this
adjusting entry would be to Cost of Goods Sold. The summary effect of the initial
error and the count adjustment would be an overstatement in Cost of Goods Sold
and Accounts Payable.
Because Cost of Goods Sold is overstated, gross profit and profit are understated as
well as Retained Earnings. At the end of Shediac’s current year, after the adjustment
is made for the results of the inventory count, the overall impact on the accounting
equation is no effect on assets, an overstatement of liabilities (Accounts Payable),
and an understatement of shareholders’ equity (Retained Earnings).
14. (a) Cost refers to the original cost of inventory as determined by using specific
identification, or the FIFO or average cost methods.
(b) Net realizable value is the selling price less any costs required to make the goods
ready for sale.
(c) The lower of cost and net realizable value rule should be applied at the end of the
accounting period, before financial statements are prepared.
15. Cost of Goods Sold is debited when recording a decline in inventory value under the
lower of cost and net realizable value rule because a decline in the value of inventory is
considered to be a cost of buying and selling merchandise. These declines are usually
considered part of the risk associated with carrying inventory and part of the costs of
carrying a variety and quantity of goods on hand.
16. An increase in the days in inventory ratio from one year to the next would be seen as
deterioration in the company’s efficiency in managing inventory. It means that the
inventory is being held for a longer period of time, which increases the risk of spoilage
and obsolescence.
Solutions Manual
6-7
Chapter 6
Copyright © 2014 John Wiley & Sons Canada, Ltd. Unauthorized copying, distribution, or transmission of this page is strictly prohibited.
Kimmel, Weygandt, Kieso, Trenholm, Irvine
Financial Accounting, Sixth Canadian Edition
Answers to Questions (Continued)
17. (a) An inventory turnover ratio that is too high may indicate that the company is losing
sales opportunities because of inventory shortages. Inventory shortages may also
cause customer ill will and result in lost future sales.
(b) If the inventory turnover is too low, it may indicate that the company is having
difficulty selling its inventory and the inventory may become obsolete.
*18. Periodic and perpetual inventory systems differ in the accounting treatment for
inventories. Under a perpetual inventory system inventory records are updated for every
purchase and sale transaction. The cost of goods sold is recorded each time a sale is
made. Under a periodic system, the inventory is only updated at the end of the period
when a physical inventory count is performed. Inventory purchases throughout the year
are debited to a Purchases account in a periodic inventory system rather than a
Merchandise Inventory account. When a sale is recorded in a periodic inventory system,
no entry is made to record the cost of the sale. Cost of goods sold is calculated
separately after the physical inventory count is performed.
*19. Ending inventory is known as a result of the physical inventory count. To determine cost
of goods sold, the total amount of inventory available for sale needs to be determined
first in order to determine what inventory has been sold (goods available for sale –
ending inventory = cost of goods sold). Goods sold are not tracked separately in a
periodic inventory system.
*20. In both systems, the first costs in are the costs assigned to the goods sold so no matter
what system is used, the cost of goods sold will always consist of the oldest units and
these would are assumed to be on hand when using either method.
*21. In a perpetual system, the average cost per item is recalculated every time a purchase
transaction takes place. In a periodic system, the average is determined based on the
total goods available for sale during the period. If there are cost changes during the
period, the average cost per item will differ in a perpetual and periodic inventory system.
Solutions Manual
6-8
Chapter 6
Copyright © 2014 John Wiley & Sons Canada, Ltd. Unauthorized copying, distribution, or transmission of this page is strictly prohibited.
Kimmel, Weygandt, Kieso, Trenholm, Irvine
Financial Accounting, Sixth Canadian Edition
SOLUTIONS TO BRIEF EXERCISES
BRIEF EXERCISE 6-1
(a) Ownership of the goods belongs to the consignor (Helgeson). Thus, these goods should
be included in Helgeson’s inventory.
(b) Goods held on consignment belong to the other company and should not be included in
Helgeson’s inventory.
(c) The goods in transit belong to the customer as the terms of shipment are FOB shipping
point. They should not be included in Helgeson’s inventory because title transferred to
the customer as soon as the goods were shipped.
(d) The goods in transit should not be included in the inventory count because ownership by
Helgeson does not occur until the goods reach the buyer.
(e) The goods in transit belong to Helgeson because ownership does not transfer until the
customer receives the goods. They should be included in Helgeson’s inventory.
(f) The goods purchased belong to the buyer, Helgeson as the terms of shipment are FOB
shipping point. Title transferred to Helgeson as soon as the goods were shipped so even
though they have not been received they should be included in Helgeson’s inventory.
BRIEF EXERCISE 6-2
$66,000
(6,000)
(1,000)
4,000
$63,000
Count
Held on consignment
Sold
August 28 shipment plus freight, FOB shipping point ($3,750 + $250)
Correct inventory cost
Solutions Manual
6-9
Chapter 6
Copyright © 2014 John Wiley & Sons Canada, Ltd. Unauthorized copying, distribution, or transmission of this page is strictly prohibited.
Kimmel, Weygandt, Kieso, Trenholm, Irvine
Financial Accounting, Sixth Canadian Edition
BRIEF EXERCISE 6-3
Cost of Goods Available for Sale
3 electric pianos @ $600 =
2 electric pianos @ $475 =
$1,800
950
$2,750
Ending Inventory
(a) Specific Identification
2 pianos @ $600 =
1 piano @ $475 =
$1,200
475
$1,675
Cost of Goods Sold
$2,750 – $1,675 = $1,075
(Proof: 1 piano @ $600 + 1
piano @ $475 = $1,075)
(b) If management wished higher profit, it could have sold two pianos from the last shipment
that had a lower cost. If it wished lower profit, it could have sold the first two pianos
purchased.
BRIEF EXERCISE 6-4
[1]
[2]
[3]
[4]
[5]
[6]
[7]
[8]
[9]
[10]
[11]
[12]
[13]
[14]
[15]
[16]
[17]
[18]
$450 ÷ 30 = $15
15 (from April 1)
$18 (from April 1)
30 (from April 6)
$15 (from April 6)
(15 @ $18) + (30 @ $15) = $720
$18 (from April 1)
$15 (from April 6)
(15 @ $18) + (10 @ $15) = $420
15 + 30 – 15 – 10 = 20
$15
20 @ $15 = $300
$144 ÷ 12 = $12
20
$15
12
$12
(20 @ $15) + (12 @ $12) = $444
Solutions Manual
6-10
Chapter 6
Copyright © 2014 John Wiley & Sons Canada, Ltd. Unauthorized copying, distribution, or transmission of this page is strictly prohibited.
Kimmel, Weygandt, Kieso, Trenholm, Irvine
Financial Accounting, Sixth Canadian Edition
BRIEF EXERCISE 6-5
[1]
[2]
[3]
[4]
[5]
[6]
[7]
[8]
[9]
[10]
[11]
[12]
[13]
$15 ($450 ÷ 30)
45 (15 + 30)
$720 ($270 + $450)
$16 ($720 (from [3]) ÷ 45 (from [2]))
$16 (from [4])
25 x $16 = $400
45 (from [2]) – 25 sold = 20
$720 (from [3]) – $400 (from [6]) = $320
$320 (from [8]) ÷ 20 (from [7]) = $16. Notice how the average does not change after a
sale.
$144 ÷ $12 = 12
20 (from [7]) + 12 (from [10]) = 32
$320 (from [8]) + $144 = $464
$464 (from [12]) ÷ 32 (from [11]) = $14.50
Solutions Manual
6-11
Chapter 6
Copyright © 2014 John Wiley & Sons Canada, Ltd. Unauthorized copying, distribution, or transmission of this page is strictly prohibited.
Kimmel, Weygandt, Kieso, Trenholm, Irvine
Financial Accounting, Sixth Canadian Edition
BRIEF EXERCISE 6-6
(a)
FIFO cost method
Date Description
Purchases
Cost of Goods Sold
Aug. 2 Purchase
250
$7
$ 1,750
3 Purchase
500
10
5,000
10 Sale
15 Purchase
900
12
1,650
$17,550
250
250
500
$7
7
10
$ 1,750
1,750
5,000
10
10
12
10
12
4,500
4,500
10,800
1,250
10,800
250
50
$7
10
$2,250
325
10
3,250
450
450
900
125
900
$5,500
1,025
10,800
25 Sale
Ending Inventory
625
$12,050
Check: $5,500 + $12,050 = $17,550
(b) Average cost method
Date Description
Aug. 2 Purchase
3 Purchase
Purchases
Ending Inventory
250 $ 7.00 $ 1,750.00
250
500
750
9.00
450
9.00 04,050.00
1,350
11.00 514,850.00
3,575.00 1,025
11.00 11,275.00
10.00
5,000.00
10 Sale
15 Purchase
Cost of Goods Sold
300 $9.00 $2,700.00
900
12.00
10,800.00
25 Sale
325 11.00
1,650
$17,550.00 625
$6,275.00
375
$ 7.00 $ 1,750.00
6,750.00
$11,275.00
Check: $6,275 + $11,275 = $17,550
Solutions Manual
6-12
Chapter 6
Copyright © 2014 John Wiley & Sons Canada, Ltd. Unauthorized copying, distribution, or transmission of this page is strictly prohibited.
Kimmel, Weygandt, Kieso, Trenholm, Irvine
Financial Accounting, Sixth Canadian Edition
BRIEF EXERCISE 6-7
(a)
Average. The ending inventory is valued at the average of the cost of the product,
including earlier costs. Since this method yields a higher ending inventory than average
cost when prices are falling, the result will not be closer to replacement cost. This result
is achieved with the FIFO cost method.
(b)
FIFO. The cost of goods is valued using the earlier, higher costs. Since the revenue
reflects current lower prices, the FIFO cost method does not match current costs
against revenue when prices are falling. This result is better achieved by the average
cost method.
(c)
One of the guidelines that management should consider is choosing an inventory cost
method that corresponds as closely to the physical flow of goods as possible. A cost
method that provides an ending inventory cost close to the inventory’s recent cost is
also preferable.
BRIEF EXERCISE 6-8
Total assets in the statement of financial position will be overstated by the amount that
ending inventory is overstated, $25,000. When the purchase of inventory was recorded, an
account payable would have been created, so total liabilities will also be overstated by
$25,000 (assuming the “supplier” was not paid). Shareholders’ equity will not be affected.
BRIEF EXERCISE 6-9
When items are not counted, an adjustment would be made to lower the balance in the
Merchandise Inventory account to reflect the difference between the amount counted (which
is lower) and the amount recorded in the account. This would be done by crediting
Merchandise Inventory. The offsetting debit would be to Cost of Goods Sold, thereby
overstating this account and reducing profit.
In the following year, assuming that these goods are sold, their cost is zero so cost of goods
sold would be understated and profit overstated. Assuming that there are no errors when
counting inventory at the end of next year, this profit overstatement when combined with the
previous year profit understatement, would cancel each other out and make retained
earnings correctly stated at the end of next year.
These effects are summarized below.
Assets
Liabilities
Shareholders’ equity
Current Year
Understated $7,000
No impact
Understated $7,000
Next Year
No impact
No impact
No impact
Solutions Manual
6-13
Chapter 6
Copyright © 2014 John Wiley & Sons Canada, Ltd. Unauthorized copying, distribution, or transmission of this page is strictly prohibited.
Kimmel, Weygandt, Kieso, Trenholm, Irvine
Financial Accounting, Sixth Canadian Edition
BRIEF EXERCISE 6-10
(a)
Inventory Categories
Camcorders
Cameras
DVD players
Total valuation
Cost
$11,000
9,000
14,000
$34,000
NRV
$10,200
9,500
12,800
$32,500
LCNRV
$10,200
9,000
12,800
$32,000
The lower of cost and net realizable value is $32,000.
(b)
Cost of Goods Sold .........................................................................
Merchandise Inventory.........................................................
$34,000 – $32,000 = $2,000
2,000
2,000
Solutions Manual
6-14
Chapter 6
Copyright © 2014 John Wiley & Sons Canada, Ltd. Unauthorized copying, distribution, or transmission of this page is strictly prohibited.
Kimmel, Weygandt, Kieso, Trenholm, Irvine
Financial Accounting, Sixth Canadian Edition
BRIEF EXERCISE 6-11
(a) Cost of Goods Sold ...................................................................
Merchandise Inventory.........................................................
$54,700 – $52,500 = $2,200
2,200
2,200
(b) $54,700
BRIEF EXERCISE 6-12
(a)
Inventory Turnover (2012)
Days in Inventory (2012)
Inventory Turnover (2011)
Days in Inventory (2011)
(b)
$7,929
= 5.4 times
($1,503 + $1,449) ÷ 2
365
= 68 days
5.4
$7,326
= 6.2 times
($1,449 + $933) ÷ 2
365
= 59 days
6.2
The inventory management deteriorated in 2012 as evidenced by the increase in
number of days in inventory from 59 days in 2011 to 68 days in 2012. This was
corroborated by the declining inventory turnover. This deterioration signifies that the
inventory was sold more slowly.
Solutions Manual
6-15
Chapter 6
Copyright © 2014 John Wiley & Sons Canada, Ltd. Unauthorized copying, distribution, or transmission of this page is strictly prohibited.
Kimmel, Weygandt, Kieso, Trenholm, Irvine
Financial Accounting, Sixth Canadian Edition
*BRIEF EXERCISE 6-13
Beginning inventory
Purchases
(370 @ $9) + (700 @ $12) + (800 @ $11)
Goods available for sale
Ending inventory
Goods sold
Units
0
Dollars
$
0
1,870
1,870
(600)
1,270
20,530
$20,530
(a) FIFO
Ending inventory: (600 units @ $11) = $6,600
Cost of goods sold = Goods available for sale – ending inventory
$20,530 – $6,600 = $ 13,930
Proof: Cost of goods sold = (370 × $9) + ( 700 × $12) + (200 x $11) = $ 13,930
(b) Average
Note: Unrounded numbers have been used in the average cost calculations, although the
numbers have been rounded to the nearest cent for presentation purposes. Because of
this, some amounts may not appear to multiply exactly because of the rounding in the
presentation.
Weighted average cost = $20,530 ÷ 1,870 = $10.98
Ending inventory: 600 × $10.98 = $ 6,578.17
Cost of goods sold = Goods available for sale – ending inventory
$20,530 – $ 6,587.17 = $ 13,942.83
Proof: Cost of goods sold = 1,270 × ($20,530 ÷ 1,870) = $ 13,942.83
Solutions Manual
6-16
Chapter 6
Copyright © 2014 John Wiley & Sons Canada, Ltd. Unauthorized copying, distribution, or transmission of this page is strictly prohibited.
Kimmel, Weygandt, Kieso, Trenholm, Irvine
Financial Accounting, Sixth Canadian Edition
*BRIEF EXERCISE 6-14
(a) Ending Inventory: (13 × $4.50) + (2 × $5.00) = $68.50
Cost of goods sold = Goods available for sale – ending inventory
$216.00 – $68.50 = $147.50
Proof: Cost of goods sold = (15 × $4.50) + (16 × $5.00) = $147.50
(b) No, the answer under a perpetual system would be the same as the first goods
purchased are assumed to be the first goods sold.
(c)
Cost of Goods Sold ....................................................................
Merchandise Inventory.........................................................
5 × $5.00 = $25
25
25
Solutions Manual
6-17
Chapter 6
Copyright © 2014 John Wiley & Sons Canada, Ltd. Unauthorized copying, distribution, or transmission of this page is strictly prohibited.
Kimmel, Weygandt, Kieso, Trenholm, Irvine
Financial Accounting, Sixth Canadian Edition
*BRIEF EXERCISE 6-15
(a)
Jan.
FIFO Perpetual
3
3
9
15
15
Accounts Receivable ............................................
Sales (500 × $6) ..........................................
3,000
Cost of Goods Sold (500 × $4) .............................
Merchandise Inventory .................................
2,000
Merchandise Inventory (1,000 × $4) .....................
Accounts Payable ........................................
4,000
Cash .....................................................................
Sales (800 x $8) ...........................................
6,400
Cost of Goods Sold [(200 × $4) + (600 × $4)] ......
Merchandise Inventory .................................
3,200
3,000
2,000
4,000
6,400
3,200
(b) FIFO Periodic
Jan.
3
9
15
Accounts Receivable .............................................
Sales ............................................................
3,000
Purchases .............................................................
Accounts Payable .........................................
4,000
Cash ......................................................................
Sales .............................................................
6,400
3,000
4,000
6,400
Solutions Manual
6-18
Chapter 6
Copyright © 2014 John Wiley & Sons Canada, Ltd. Unauthorized copying, distribution, or transmission of this page is strictly prohibited.
Kimmel, Weygandt, Kieso, Trenholm, Irvine
Financial Accounting, Sixth Canadian Edition
SOLUTIONS TO EXERCISES
EXERCISE 6-1
1. Do not include – Shippers Ltd. does not own items held on consignment.
2. Include in inventory – Shippers Ltd. still owns the items as they were only shipped on
consignment.
3. Include in inventory – Shipping terms FOB destination means that Shippers Ltd. owns
the items until they reach the customer.
4.
Do not include in inventory. Freight costs on goods shipped to customers are included in
Freight Out or Delivery Expense.
5. Do not include in inventory – The shipping terms are FOB shipping point so ownership
has transferred to the customer. Shippers Ltd. should record this as a sale on the income
statement.
6.
Do not include in inventory. The shipping terms are FOB destination so Shippers Ltd.
does not own the goods until they arrive at Shippers Ltd.’s premises.
7. Include in inventory – Shipping terms FOB shipping point means that ownership
transferred at the time of shipping and therefore, Shippers Ltd. owns the goods in transit.
Solutions Manual
6-19
Chapter 6
Copyright © 2014 John Wiley & Sons Canada, Ltd. Unauthorized copying, distribution, or transmission of this page is strictly prohibited.
Kimmel, Weygandt, Kieso, Trenholm, Irvine
Financial Accounting, Sixth Canadian Edition
EXERCISE 6-2
(a) Ending inventoryphysical count ............................................................
1. Add to inventory. Title remains with Novotna until purchaser
receives goods .....................................................................................
2. Add to inventory. Title passed to Novotna when goods were shipped .
3. Add to inventory. Title passed to Novotna when goods were shipped .
4. No effect. Title passes to purchaser upon shipment when terms are
FOB shipping point ..............................................................................
5. Add to inventory. Novotna owns the goods out on consignment .........
6. Deduct from inventory. Obsolete inventory should be written off to
cost of goods sold. ...............................................................................
Correct inventory ......................................................................................
$285,000
35,000
95,000
28,000
0
30,500
(15,000)
$458,500
(b) Since inventory is usually the largest current asset on a company’s statement of financial
position, errors can have a significant impact. In making a decision to grant a short-term
bank loan, the bank will be looking at Novotna’s liquidity by calculating the current ratio
as well as the inventory turnover and days sales in inventory. Any error in the inventory
count will affect these ratios. In addition, the errors will also affect Novotna’s profitability
by impacting the cost of goods sold on the income statement.
Solutions Manual
6-20
Chapter 6
Copyright © 2014 John Wiley & Sons Canada, Ltd. Unauthorized copying, distribution, or transmission of this page is strictly prohibited.
Kimmel, Weygandt, Kieso, Trenholm, Irvine
Financial Accounting, Sixth Canadian Edition
EXERCISE 6-3
(a) The company would identify, by serial number, the items remaining in inventory. The
sum of the cost of the items remaining in inventory would become the ending inventory
balance. Then, the company would identify the cost of the items sold, again by using
serial numbers to determine the cost of each item sold. The total cost of items sold would
become the cost of goods sold.
(b) It could choose to sell specific units purchased at specific costs if it wished to impact
profit selectively. If it wished to minimize profit it would choose to sell the units purchased
at higher costs–in which case the cost of goods sold would be $1,540 ($800 + $740) and
gross profit would be $1,060 ($2,600 – $1,540). If it wished to maximize profit it would
choose to sell the units purchased at lower costs; in which case the cost of goods sold
would be $1,420 ($740 + $680) and gross profit would be $1,180 ($2,600 – $1,420).
(c) Discount Electronics should consider the nature of the inventory items. The specific
identification system is best suited to inventory items are clearly identified from each
other and that are not ordinarily interchangeable, or to products that are produced and
segregated for specific projects. The specific identification system produces the most
accurate measure of ending inventory and matching of cost of goods sold to sales. It is
however more time-consuming and expensive to apply. If the inventory items are
interchangeable, Discount Electronics should consider the use of either the FIFO or
average cost flow methods.
Solutions Manual
6-21
Chapter 6
Copyright © 2014 John Wiley & Sons Canada, Ltd. Unauthorized copying, distribution, or transmission of this page is strictly prohibited.
Kimmel, Weygandt, Kieso, Trenholm, Irvine
Financial Accounting, Sixth Canadian Edition
EXERCISE 6-4
(a)
Date
Description
Purchases
Cost of Goods Sold
Apr. 1 Beg. inventory
Ending Inventory
50 $210
100 225 $33,000
50 $210
25 225 $ 16,125
3 Sale
10 Purchase
75
75
200
225
225
275
16,875
25
25
300
275
275
290
6,875
93,875
57,625 125
290
36,250
200 $275 $ 55,000
75
175
17 Sale
24 Purchase
300
290
225
275
87,000
25
175
30 Sale
30 Balance
500
65,000
275
290
$142,000 525
$138,750 125
71,875
290 $36,250
Check: $138,750 + $36,250 = $175,000 ($33,000 + $142,000)
(b)
Sales
Apr. 3
Units
75
Sales Price/Unit
$400
Total
$ 30,000
17
250
400
100,000
30
200
400
80,000
$210,000
Gross profit = $210,000 – $138,750 = $71,250
Gross profit margin = $71,250 ÷ $210,000 = 33.9%
(c) The gross profit is higher than if the average cost method had been used in a perpetual
inventory system because cost of goods sold is lower under FIFO in a period of rising
prices than it would be using the average cost method. Under FIFO, ending inventory is
higher, cost of goods sold is lower and gross profit is higher.
Solutions Manual
6-22
Chapter 6
Copyright © 2014 John Wiley & Sons Canada, Ltd. Unauthorized copying, distribution, or transmission of this page is strictly prohibited.
Kimmel, Weygandt, Kieso, Trenholm, Irvine
Financial Accounting, Sixth Canadian Edition
EXERCISE 6-5
(a) Note: Unrounded numbers have been used in the average cost calculations, although the
numbers have been rounded to the nearest cent for presentation purposes. Because of
this, some amounts may not appear to multiply exactly because of the rounding in the
presentation.
Date
Description
Purchases
Cost of Goods Sold
June 1 Beginning
6 Purchase
500 $125.00 $ 62,500.00
1,200 $127.00 $152,400.00
10 Sale
14 Purchase
Ending Inventory
1,000
1,800
128.00
1,600
1,000
30 Balance
4,000
129.00
$126,411.76
‘230,400.00
16 Sale
26 Purchase
$126.41
127.56
204,088.47
129,000.00
$511,800.00
2,600
$330,500.23
1,700
126.41
214,900.00
700
126.41
88,488.24
2,500
127.56
318,888.24
900
127.56
114,799.77
1,900
128.31
243,799.77
1,900
$243,799.77
Check: $330,500.23 + $243,799.77 = $574,300 ($62,500 + $511,800)
(b)
Sales = (1,000 @ $200) + (1,600 @ $205) = $528,000
Gross profit = $528,000 – $330,500 = $197,500
Gross profit margin = $197,500 ÷ $528,000 = 37.4%
(c) The gross profit is lower than it would be using the FIFO cost method because the cost of
the product being purchased is rising.
Solutions Manual
6-23
Chapter 6
Copyright © 2014 John Wiley & Sons Canada, Ltd. Unauthorized copying, distribution, or transmission of this page is strictly prohibited.
Kimmel, Weygandt, Kieso, Trenholm, Irvine
Financial Accounting, Sixth Canadian Edition
EXERCISE 6-6
(a) (1) FIFO
Date
Purchases
Cost of Goods Sold
Balance
June 1 Beginning inventory
150 @ $5 = $ 750
12
230 @ $6 = $1,380
150 @ $5
230 @ $6 = 2,130
15
150 @ $5
100 @ $6 = $1,350 130 @ $6 =
780
16
450 @ $7 = 3,150
130 @ $6
450 @ $7 = 3,930
23
150 @ $8 = 1,200
130 @ $6
450 @ $7
150 @ $8 = 5,130
27
130 @ $6
10 @ $7
440 @ $7 = 3,860 150 @ $8 = 1,270
Total
$5,730
$5,210
$1,270
Check: $5,210 + $1,270 = $6,480 ($750 + $5,730)
(a) (2) Average
Note: Unrounded numbers have been used in the average cost calculations, although the
numbers have been rounded to the nearest cent for presentation purposes. Because of this,
some amounts may not appear to multiply exactly because of the rounding in the
presentation.
Date
June 1
12
15
16
23
27
Total
Purchases
Beginning inventory
230 @ $6 = $1,380.00
Cost of Goods Sold
250 @ $5.61 = $1,401.32
450 @ $7
150 @ $8
= 3,150.00
= 1,200.00
$5,730.00
570 @ $6.96 = 3,965.54
$5,366.86
Balance
150 @ $5.00 = $ 750.00
380 @ $5.61 = 2,130.00
130 @ $5.61 = 728.68
580 @ $6.69 = 3,878.68
730 @ $6.96 = 5,078.68
160 @ $6.96 = 1,113.14
$1,113.14
Check: $5,366.86 + $1,113.14 = $6,480 ($750 + $5,730)
(b) The average cost method results in a higher cost of goods sold because the cost of
inventory is rising.
(c) The FIFO cost method results in a higher profit because it produces the lower cost of
goods sold when prices are rising.
Solutions Manual
6-24
Chapter 6
Copyright © 2014 John Wiley & Sons Canada, Ltd. Unauthorized copying, distribution, or transmission of this page is strictly prohibited.
Kimmel, Weygandt, Kieso, Trenholm, Irvine
Financial Accounting, Sixth Canadian Edition
EXERCISE 6-6 (Continued)
(d) The FIFO cost method results in a higher ending inventory because the cost of inventory
is rising.
(e) Both cost methods result in the same pre-tax cash flow. The cost methods do not change
the pre-tax cash flows of a company.
EXERCISE 6-7
(a)
FIFO cost method
Date
Oct. 2
15
Units
9,000
15,000
Purchases
Cost
Total
$12 $108,000
14 210,000
29
(b)
Date
Oct. 2
15
29
Cost of Goods Sold
Units
Cost
Total
9,000
13,000
$12
14
$290,000
Units
9,000
9,000
15,000
2,000
Balance
Cost
Total
$12 $108,000
12
14
318,000
14
28,000
Average cost method
Units
9,000
15,000
Purchases
Cost
Total
$12 $108,000
14
210,000
Cost of Goods Sold
Units
Cost
Total
22,000
$13.25
$291,500
Units
9,000
24,000
2,000
Balance
Cost
Total
$12.00
$108,000
13.25
318,000
13.25
26,500
(c)
Sales
Cost of goods sold (from above)
Gross profit
Operating expenses
Profit before income tax
Income tax expense (30%)
Profit
FIFO
$525,000
290,000
235,000
200,000
35,000
10,500
$ 24,500
Average
$525,000
291,500
233,500
200,000
33,500
10,050
$ 23,450
Solutions Manual
6-25
Chapter 6
Copyright © 2014 John Wiley & Sons Canada, Ltd. Unauthorized copying, distribution, or transmission of this page is strictly prohibited.