Tài liệu Báo cáo khoa học: Directed evolution of trimethoprim resistance inEscherichia coli doc
Bạn đang xem bản rút gọn của tài liệu. Xem và tải ngay bản đầy đủ của tài liệu tại đây (262.86 KB, 11 trang )
Directed evolution of trimethoprim resistance
in Escherichia coli
Morgan Watson, Jian-Wei Liu and David Ollis
Research School of Chemistry, Australian National University, Canberra, Australia
Naturally occurring enzyme inhibitors are found in
every living organism, serving purposes ranging from
the regulation of metabolism to weapons against com-
petitors, predators and prey. By contrast, artificial
enzyme inhibitors serve two primary purposes; to aid
the study of enzymes and biological pathways, and to
serve as drugs in medical applications [1]. The synergy
between these two approaches is well illustrated when
examination of the means by which an enzyme becomes
resistant to an antagonist furthers our understanding of
the functionality of the enzyme itself. However, the
study of the mechanistic relationship between inhibition
by antibacterials and enzymatic activity is complicated
by the systematic differences between susceptible and
resistant forms of an enzyme. Clinical isolates typically
have multiple mutations present [2] and in some cases
bear little resemblance to the native form [3] so it is dif-
ficult to determine the effect of any one mutation.
Although we can examine the result of the mutations,
we can only postulate about the reasons that gave rise
to them. Directed evolution provides a mechanism for
simplifying these studies. Controlling selection pres-
sures on the enzyme, by controlling the environment of
the host organism during the evolution of resistance [4],
allows control over the number of mutations intro-
duced, and ensures that the resistant forms produced
are related to the susceptible native form. This allows
us to determine additional information on why the
mutations arose and in what order multiple mutations
accumulated, information that is not always available
for samples isolated from other sources. Screening tech-
niques used in directed evolution also enable us to pro-
duce multiple mutant forms of the enzyme, all of which
have potentially used different methods to overcome
the obstacles present in the directed evolution process.
This allows for a greater understanding of enzyme
mechanisms than studies of clinical isolates. Directed
evolution is gaining popularity as a means of studying
enzymes and has recently been used to examine other
antibacterial resistance systems [5].
Because of its central role in one-carbon metabo-
lism, dihydrofolate reductase (DHFR) has long been a
Keywords
antibiotic resistance; dihydrofolate
reductase; directed evolution; trimethoprim
Correspondence
M. Watson, Research School of Chemistry,
Australian National University, Canberra,
ACT 0200, Australia
Fax: +61 261 250 750
Tel: +61 261 258 017
E-mail:
(Received 2 January 2007, revised 12 March
2007, accepted 22 March 2007)
doi:10.1111/j.1742-4658.2007.05801.x
Directed evolution is a useful tool in the study of enzymes. It is used in this
study to investigate the means by which resistance to the antibiotic trimeth-
oprim develops in dihyrofolate reductase from Escherichia coli. Mutants
with clinical levels of resistance were obtained after only three generations.
After four generations of directed evolution, several mutants were charac-
terized, along with some point mutants made to investigate amino acid
changes of interest. Several mutations were found to grant resistance to
trimethoprim, both by reducing the binding affinity of the enzyme for the
drug, and by increasing the activity of the enzyme.
Abbreviations
DHF, 5,6-dihydrofolate; DHFR, dihydrofolate reductase; MHA, Mueller Hinton agar; MIC, minimum inhibitory concentration; THF,
5,6,7,8-tetrahydrofolate; TMP, trimethoprim.
FEBS Journal 274 (2007) 2661–2671 ª 2007 The Authors Journal compilation ª 2007 FEBS 2661
target for drugs [6,7]. The structure and function of
native forms of DHFR from a variety of sources have
been studied. DHFR from Escherichia coli is a mono-
meric protein of $ 18 kDa. The structure of the native
form has been determined, including complexes with
both substrates and a number of inhibitors [8]. DHFR
catalyses the reduction of NADPH and 5,6-dihydrofo-
late (DHF) to NADP
+
and 5,6,7,8-tetrahydrofolate
(THF), via the redox reaction:
DHF þ NADPH þ H
þ
! THF þ NADP
þ
Binding of the substrates is ordered, with the reaction
proceeding by the binding of first NADPH then DHF,
followed by the release of NADP
+
and binding of
another NADPH molecule before the release of THF.
THF release is the rate-limiting step in the reaction [9].
DHFR is also capable of reducing folate to DHF,
although at a considerably slower rate than the reduc-
tion of DHF to THF. This reduction is essential for
maintaining the cellular pool of reduced folate
required to synthesize thymidylate, purines and methi-
onine [10,11]. Compounds used to inhibit DHFR are
collectively know as antifolates, and are used to treat a
variety of conditions ranging from bacterial infections
and malaria to cancer. This study uses the antifolate
drug trimethoprim (TMP) (Fig. 1). TMP is used as an
antibiotic as it has a high degree of specificity for bac-
terial DHFRs over eukaryotic DHFRs.
The widespread use of antifolates has lead to the
development of resistance to many of the compounds
[12,13], and numerous studies of DHFR from many
organisms [11]. The breadth of information available
on DHFR and the significance of it in the treatment
of a range of conditions makes it an ideal subject for
examining the ability of directed evolution to aid us in
understanding and overcoming the rise of resistance to
enzyme inhibitors.
In this study, we used directed evolution to generate
a library of E. coli DHFR mutants with resistance to
TMP. Selected mutants were characterized kinetically
using fluorescence techniques. Third- and fourth-gen-
eration mutants were found which possessed greatly
increased levels of TMP resistance, with only minor
deleterious effects on activity, and in many cases
improvement of either substrate K
m
values or k
cat
. The
location and probable effect of repeatedly occurring
mutations has been examined.
Results and Discussion
Library generation
Each round of evolution libraries consisted of
$ 100 000 cfu. Of these, $ 250–300 colonies were
selected for secondary screening, and the best 20–25
colonies selected for sequencing. From those se-
quenced, 10–15 mutants were shuffled to produce the
next round of mutants. Amino acid changes
observed in the sequenced mutants are shown in
Table 1. There were a few false positives so the
numbering of mutants is not necessarily sequential.
No duplicates were seen, presumably because of the
large number of potential combinations of generated
mutants.
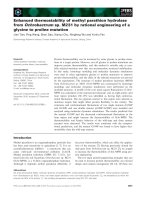
Fig. 1. Comparison of the structure of
5,6-dihydrofolate (DHF) and trimethoprim
(TMP). Of particular interest is the
substitution of an amine group on TMP for
the double bonded oxygen in DHF (circled).
Directed evolution in E. coli M. Watson et al.
2662 FEBS Journal 274 (2007) 2661–2671 ª 2007 The Authors Journal compilation ª 2007 FEBS
Table 1. List of mutants generated. Mutations found in those resistant colonies sequenced. Only mutations that occur more than once
are shown, this may result in some mutants appearing identical. The percentage of mutants containing a given mutation in each round is
indicated.
Residue 10 20 21 26 30 45 94 109 115 153 158
WTVMPAWHIKIFR
1-04 A
1-06 L
1-07 Q
1-10 L
1-13 S
1-16 V R
% R1 16.7 16.7 17 ⁄ 17
(L ⁄ Q)
16.7 16.7 0 16.7 0 0 16.7 0 ⁄ 0
(W ⁄ Q)
2-01 V T L
2-05 R L
2-06 A V R L
2-07 A R L
2-08 Q L
2-10 V R L
2-11 L R
2-12 Q T R
2-13 A R L V
2-14 A L L
2-15 Q L
2-16 Q R
2-17 A Q S
2-18 R L
2-19 A Q L
2-20 L L
% R2 37.5 18.75 19 ⁄ 38
(L ⁄ Q)
12.5 56.25 0 75 0 6.25 6.25 0 ⁄ 0
(W ⁄ Q)
3-02 V T R L V
3-03 V T V S
3-04 V T L
3-05 V T L V
3-06 T R L R
3-07 A T R R L
3-08 A T R R L
3-09 A V T R L
3-10 A V T R L V
3-13 A V T L
3-14 T R L R
3-15 V T L
3-16 V T L R V
3-17 T R R L
3-18 A T R L R
3-19 T R L R
3-20 R L
% R3 35.29 52.94 0 ⁄ 0
(L ⁄ Q)
94.12 47.06 35.29 94.12 29.14 29.14 5.88 0 ⁄ 0
(W ⁄ Q)
4-01 V T R L R W
4-02 V T R R V Q
4-03 A V T L
4-04 V T L
4-06 V T L V
4-07 A V T R L
4-08 V T L R
4-09 A V T R L R Q
M. Watson et al. Directed evolution in E. coli
FEBS Journal 274 (2007) 2661–2671 ª 2007 The Authors Journal compilation ª 2007 FEBS 2663
The genes sequenced at the end of the first genera-
tion contained only one or two mutations each.
With the exception of F53S, these mutations recom-
bine in subsequent rounds so that at the end of four
rounds a number of these mutations (M20V, A26T,
I94L) occurs in most of the resistant enzymes. The
A26T and H45R mutations only become common in
the third and fourth generations. One of these,
H45R, originated only in the third round, but
quickly became common. The favouring of these
mutations at higher levels of TMP provides a good
indication that they either confer a high level of
resistance, or are necessary to allow other mutations
that confer such resistance.
There are three mutations that vanish from later
rounds after being common in earlier ones; P21L,
P21Q, and W30R. It is possible that these are too inef-
fective to survive in later rounds, or it may be that
although these mutations are capable of protecting the
bacteria from TMP, they are incompatible with the
M20V mutation (never occurring together in Table 1)
and are lost as the M20V mutation (shown to be a
considerably more effective mutation on Table 2)
becomes more common. Other mutations show neither
affinity nor conflict with each other. Not shown in
Table 1 are mutations that only occurred in one
mutant, demonstrating little selective advantage.
Protein expression and purification
All mutants were expressed to between 80 and 100%
of the level of native DHFR, so we can conclude that
the observed resistance during selection was not due to
increased overexpression. All enzymes were purified to
> 95% pure, as judged by visual inspection of a Coo-
massie Brilliant Blue-stained SDS gel.
Kinetic assays
Kinetic constants determined from the initial rate
reactions are shown in Table 2. These were deter-
mined using Michaelis–Menten plots of the data
collected. K
m
values obtained for the native form
are consistent with those available in the literature
(0.7–3.2 lm for DHF and 0.94–6.8 lm for NADPH)
as were the k
cat
values (literature values of 18–29Æs
)1
)
[10,14–16].
With two exceptions, the kinetic constants measured
for DHF and NADPH binding of the mutants show a
remarkable similarity to that of the native form. This
suggests that the native activity is the minimum
required for viable cells. Two mutants showing an
improvement on these constants, 3-20 and 4-4, both
had significantly increased K
m
values for NADPH.
Both of these, along with several other mutants, had
an increased k
cat
. This may, to some extent, compen-
sate for the increased K
m
values. The prevalence of
increased k
cat
values in both directed evolution and
single-site mutants suggests that it may also play a
direct role in TMP resistance. Many of the single-site
mutants possess k
cat
values far higher than those of
the directed evolution mutants that contain them. This
is especially true for the third generation, whereas
mutants in generation four have more comparable k
cat
values. This leads to the conclusion that the effects of
the single-site mutants are not additive, and are cap-
able of interfering with each other. Only the fourth-
round generation selection conditions were sufficiently
Table 1. Continued.
Residue 10 20 21 26 30 45 94 109 115 153 158
4-10 V T R L
4-11 T R L
4-12 V T R L V
4-13 V
4-14 V T L
4-15 T R L R
4-16 A
4-17 A V T L W
4-18 V T L
4-20 V T R L
% R4 27.8 83.3 0 ⁄ 0
(L ⁄ Q)
88.9 0.0 50.0 83.3 27.8 16.7 0.0 11 ⁄ 11
(W ⁄ Q)
% Total 31.6 49.1 7 ⁄ 12
(L ⁄ Q)
59.6 31.6 26.3 77.2 17.5 15.8 5.3 3 ⁄ 3
(W ⁄ Q)
Directed evolution in E. coli M. Watson et al.
2664 FEBS Journal 274 (2007) 2661–2671 ª 2007 The Authors Journal compilation ª 2007 FEBS
stringent to select combinations of mutations compar-
able to the single-site mutants.
Binding assays
Binding constants are given in Table 2. A significant
increase in K
d
is apparent between generations three
and four. However, the K
d
of 3-20 is only a little
higher than that of the native form, begging the ques-
tion of why this mutant was selected and how it has
achieved a minimum inhibitory concentration (MIC)
value comparable with other TMP-resistant mutants.
The reason for this would appear to lie in the k
cat
value for 3-20, the highest for all round three mutants.
In this case, it would appear that an increased k
cat
value is capable of conferring resistance to the effects
of TMP, even in the presence of a K
d
that is not signi-
ficantly different from the native DHFR.
The TMP binding constants for the single-site
mutants reveals some interesting results. The very high
K
d
values for M20V and H45R suggest that a far more
stringent set of selection methods could be applied ear-
lier, and the comparatively low K
d
values for the direc-
ted mutants is a result of insufficient evolutionary
selection. More interesting is that these K
d
values can
be obtained with little loss of substrate binding and
k
cat
. Combination of M20V and H45R with others
appears to result in the lowering of K
d
, compensated
for by increases in k
cat
, allowing the enzyme to exploit
both paths to resistance.
Stability assays
All enzymes tested had a t
50
(defined as the tempera-
ture required for irreversible loss of 50% of maximal
activity after 30 min incubation) of 56 ± 4 °C. There
was no significant difference between the wild-type
E. coli DHFR and any of the mutants (Table 2). Sta-
bility was monitored for its potential to explain anti-
biotic resistance in terms of protein stability rather
than enhanced kinetics. However, it appears that
native E. coli DHFR is already a relatively stable
enzyme and the mutations examined in this study had
little effect on this stability. The temperatures required
to cause an irreversible loss of activity in the enzyme
are clearly higher than those experienced by the
enzyme at any point in this study or in the cell. Main-
taining this level of stability may be a requirement to
produce viable cells.
MIC tests
Susceptibility tests revealed an increased resistance to
TMP for all mutants, and although the degree of over-
expression resulting from our choice of vector makes
direct comparisons with the MIC values for TMP
Table 2. Kinetic constants of analysed mutants. Mutations present in the directed evolution mutants are listed. Errors indicated are standard
errors. MIC and t
50
determinations were only preformed on directed evolution mutants. Methods of determination of kinetic values are given
in the Experimental procedures. Values given are the means of three determinations, and the errors are the standard deviation of the
results.
Mutant
K
m
(DHF)
l
M Error
K
m
(NADPH)
l
M Error
k
cat
s
)1
Error
K
d
(TMP)
n
M Error
MIC
lgÆmL
)1
t
50
°C Error Mutations
wt 0.806 0.077 0.952 0.046 26.39 0.94 9.1 0.3 2 56.0 0.5
3-2 0.890 0.025 1.460 0.063 29.06 3.28 39.5 4.5 100 57.6 1.3 M20V, A26T, H45R,
A84V, I94L, I115V
3-3 0.885 0.039 1.480 0.072 29.23 6.10 108.4 22.6 > 200 55.0 0.9 M20V, A26T, I115V, F153S
3-6 0.332 0.017 0.592 0.022 13.27 0.05 54.8 0.2 > 200 56.5 1.0 A26T, W30R, I94L, K109R
3-20 2.230 1.750 6.100 2.720 289.90 106.79 13.3 4.9 100 57.9 1.5 W30R, I94L
4-1 0.998 0.045 0.156 0.027 22.29 2.66 876.5 104.7 100 57.7 0.8 M20V, A26T, H45R, I94L,
K109R, P129L, A144T, R158W
4-4 2.110 0.612 3.100 0.819 246.91 42.50 242.4 41.7 200 55.8 1.1 M20V, A26T, I94L, R159G
4-9 2.220 0.209 0.987 0.104 201.93 3.04 938.6 14.1 > 200 57.7 0.6 S3R, V10A, M20V, A26T, H45R,
Q65R, I94L, K109R, E154K
4-18 1.560 0.126 0.880 0.064 431.61 35.39 776.1 63.6 200 55.8 1.1 M20V, A26T, W74C, I94L, D116Y
V10A 0.494 0.021 1.860 0.033 368.81 89.73 332.8 81.0
M20V 1.180 0.077 0.523 0.022 65.04 1.04 1096.7 17.6
A26T 0.327 0.036 0.449 0.023 120.23 8.08 166.2 11.2
W30R 0.272 0.120 2.020 0.203 264.10 0.31 132.5 0.2
H45R 0.501 0.054 0.070 0.053 150.39 3.37 618.4 13.8
I94L 2.060 0.707 1.230 0.672 438.60 14.38 160.9 5.3
M. Watson et al. Directed evolution in E. coli
FEBS Journal 274 (2007) 2661–2671 ª 2007 The Authors Journal compilation ª 2007 FEBS 2665
reported for clinical isolates difficult, comparisons are
still possible. Other studies have shown susceptible
forms of DHFR to be inhibited by TMP concentra-
tions in the 1–2 lgÆmL
)1
range [17], the same as deter-
mined in this study for native protein in our
overexpression system. It is also worth noting that
TMP-resistant isolates from other studies were resist-
ant to concentrations of TMP in the range of 16–32
times that of the susceptible form [17]. Some of the
DHFR mutants generated in this study were resistant
to TMP concentrations of more than 100 times that of
the native enzyme, so that it is very likely that these
would be of clinical significance.
Although one would intuitively expect these increa-
ses to parallel those of the mutant K
i
values, this is
not the case. Cellular resistance appears to be depend-
ant on all the kinetic properties of the enzyme, not
just its affinity for TMP. This is illustrated with the
increase in k
cat
in many mutants and single-site muta-
tions, especially in the case of 3-20, where TMP resist-
ance appears solely dependant on the increase in k
cat
noted above.
Single-site mutations: structure ⁄ function
correlations
Many of the point mutants examined are located
in close proximity to either the active site, or in the
FG and M20 Loops (Fig. 2). As the role of these loops
in catalysis of the reduction of DHF has been well
established [8], the manner in which these residues can
impact the binding and activity of the enzyme are rel-
atively straightforward. The role of more distantly
located residues is less easily discerned. No region of
the active site remains untouched by the mutations,
with the examined point mutations spread across the
binding residues for both DHF and NADPH, as well
as affecting the M20 loop.
Of the single-site mutants examined in this study,
four have been identified previously as mutation sites
in clinically isolated TMP-resistant genes. These four
are V10A, M20V, W30R and I94L [2,18]. Two of
these, M20V and I94L, become very common in later
generations of this evolution, while V10A maintains a
steady presence and W30R starts out strong, but is
eventually ousted by M20V, which it appears to be
incompatible with.
Val10Ala
Although located distant to the active site, potential
exists for this mutation to have an effect on the
binding of substrates due to the movement of the
M20 and FG loops during catalysis [8]. Alteration of
the conformation of these loops at any stage in the
catalytic cycle could account for the observed differ-
ences in kinetics.
Met20Val
This mutation falls on the highly studied M20 loop
mentioned above, and is known to play an import-
ant role in the catalytic cycle of DHFR [8].
Although this mutation gives the greatest improve-
ment in TMP resistance of all the point mutants
studied, it is also the only point mutant to have a
lower k
cat
than the wild-type enzyme. This pair of
effects match well with the frequency data shown in
Table 1, as the concentration of TMP used in the
selection process increases, so too does the frequency
of M20V, as the trade off between resistance and
activity shifts to favour resistance.
GH F
AEBCD
Fig. 2. Line representation of E. coli DHFR.
b sheets are shown as arrows, a helices are
shown as rectangles. Locations of those
mutations listed in Table 1 are indicated as
grey discs. The binding sites for NADPH
and DHF ⁄ TMP are indicated.
Directed evolution in E. coli M. Watson et al.
2666 FEBS Journal 274 (2007) 2661–2671 ª 2007 The Authors Journal compilation ª 2007 FEBS
Ala26Thr
Although located near the M20 loop, this mutation
has a markedly different effect to M20V. Although
it confers an unremarkable level of resistance, it
improves the binding of both DHF and NADPH.
The k
cat
of the A26T point mutant is also relatively
high compared with other point mutants. It is likely
that the primary role of this mutation is not to pro-
vide resistance through reduced affinity for TMP,
but to help negate some of the negative effects other
mutations have on the activity of DHFR.
Trp30Arg
The substitution of arginine for tryptophan at resi-
due 30 introduces an additional -NH
3
- moiety into
the DHF-binding site (while maintaining the existing
-NH
2
- group already present), in proximity to a dou-
ble-bonded oxygen residue possessed by DHF but
lacking in TMP (as shown in Fig. 1). This allows
for the formation of an additional hydrogen bond
with DHF, stabilizing its binding, while destabilizing
the binding of TMP. The net result of this is a kin-
etic profile similar to that of A26T. Unlike A26T,
W30R would appear to be incompatible with M20V,
never occurring in the same mutant, and eventually
being lost as the frequency of M20V increased. The
reason for this incompatibility appears to lie in the
binding of DHF ⁄ TMP. Both mutations have the
potential to directly affect binding, and may do so
in a way that prohibits the other mutation.
His45Arg
As expected from its location within the NADPH-
binding pocket, this mutation has a marked effect
on the binding of NADPH. The cause of the accom-
panying increase in TMP resistance is unclear, parti-
cularly as DHF binding is relatively unaffected. The
likely explanation is that the binding conformation
of NADPH is altered in such a way to favour DHF
binding over TMP.
Ile943Leu
These residues form part of the DHF ⁄ TMP-binding
pocket, and although they have no effect on the
polarity of the pocket, both cause steric changes cap-
able of favouring DHF over TMP due to the
observed difference in binding conformations of the
two ligands [7] (Fig. 3). This change has only a
mediocre effect on TMP resistance, combined with
the loss of DHF and NADPH binding means that
this mutation, like M20V, is only favoured at high
concentrations of TMP.
Lys109Arg
Unfortunately, the insolubility of this point mutant
prevents kinetic data from being collected, however,
previous work [8] has shown that the two DHFR sub-
units move relative to each other during the catalytic
cycle. Residue 109 is located on the ‘hinge’ between
the two subunits and it is likely that the effect of any
mutation in this region will be due to an effect on this
movement. The insolubility caused by this mutation is
a significant evolutionary cost, and may serve to
explain why it is only observed in later rounds. Other
mutations acquired in the directed evolution process
must be responsible for restoring the solubility of the
enzyme.
Concluding remarks
The initial aim of this study was to identify residues
that could be mutated to reduce the affinity of E. coli
DHFR for TMP. We did not investigate the mecha-
nisms by which mutations could arise in the clinical
environment, our aim was to better understanding of
how the active site could mutate in response to an anti-
biotic while still maintaining activity. Such information
would aid in the design of new drugs. Unfortunately,
the picture that emerges in the case of DHFR is that,
not only can mutations occur to overcome the effects
Fig. 3. Binding of DHF and TMP by DHFR. This illustrates the dif-
ferences in crystallographically observed binding of the substrate
and inhibitor. Native residues are shown in green, mutants in red.
NADPH is shown in orange, DHF in gold and TMP in pink.
M. Watson et al. Directed evolution in E. coli
FEBS Journal 274 (2007) 2661–2671 ª 2007 The Authors Journal compilation ª 2007 FEBS 2667
of TMP with little loss of activity, but the ability to
increase that activity is also present. Indeed, the
increase in DHFR activity is one mechanism used to
reduce the effect of TMP. However, it may be possible
to screen mutants as well as native enzyme forms
when searching for new drugs, allowing for the selec-
tion of drugs effective against forms resistant to cur-
rent antibiotics.
The similarities between some the mutations pro-
duced in this study and those found in clinical isolates
of TMP-resistant DHFR illustrate the power of direc-
ted evolution protocols to mirror the evolutionary pro-
cesses of nature, and add weight to its use as a tool
capable of predicting future developments in antibacte-
rial resistance.
A trend apparent in our results is that the increase
in TMP resistance observed in the mutants occurs
without any accompanying loss in activity. Although
the improvements in activity accompanying the devel-
opment of resistance run contrary to the normal bene-
fit ⁄ cost trade-off expected of resistance development, it
can be understood in terms of evolutionary pressure.
In the situation in which the reaction catalysed by an
enzyme is not a rate-limiting step in the growth and
reproduction of an organism, then there is no further
evolutionary pressure on that enzyme. In such a case,
evolution halts even if the enzyme is still far from opti-
mized. This results in an untapped pool of evolution-
ary potential, which remains available for future use
when the environment changes.
Introduction of an antibiotic, in this case TMP,
results in a change in evolutionary pressure as the target
of the antibiotic (DHFR in this study) becomes the cata-
lyst for a reaction that is now limiting the growth of the
organism. This prompts further evolution of the previ-
ously suboptimized enzyme, selecting not only for resist-
ance to the antibiotic, but also for improved substrate
binding and maximum activity. Enzymes (such as
DHFR) possessing such a range of unused evolutionary
potential will make poor choices for antibiotic targets,
as it is relatively easy for the target enzyme to develop
not only resistance to the antibiotic, but increased
enzyme efficiency as well. Although the mechanisms
involved in the spread of antibiotic resistance are not
part of this study, it is logical to conclude that mutations
that confer resistance without a drop in activity face
fewer barriers to their propagation and transfer than
genes that can only confer resistance with an associated
cost. More highly evolved enzymes that are at or near
their evolutionary limit would be better targets for anti-
biotics. Resistant mutants of such enzymes should have
lower activities and should disappear from the popula-
tion once the selection pressure is removed.
An interesting point to note with respect to DHFR is
that bacteria are capable of synthesizing folate and have
a great range of variation in DHFR genes. Mammals
are incapable of synthesizing folate and rely more hea-
vily on cycling of dietary folate. The increased import-
ance of DHFR and other folate cycling enzymes to
mammals may explain the fact that mammalian DHFRs
are far more tightly conserved than bacterial ones [19].
Compounds such as the chemotherapy drug methot-
rexate, possessing higher affinity for E. coli DHFR
may allow for the collection of more information
regarding active site mutations through further direc-
ted evolution experiments. Such work would require
changes to the expression system, as E. coli already
possesses an innate resistance to methotrexate by
means of an efflux system [20].
This study has shown the usefulness of directed evo-
lution in drug design, particularly in the selection of
drug targets. Along with a clear indication of the ease
with which antibiotic resistance can develop and the
means by which it can do so, directed evolution can
also provide a pool of resistant mutant proteins that
may be useful in the screening of new drugs.
Experimental procedures
Materials
Enzymes used this research were obtained from New Eng-
land Biolabs (Ipswich, MA), Roche (Basel, Switzerland) and
Stratagene (La Jolla, CA). All other compounds were
obtained from Sigma (St. Louis, MO).
Isolation of E. coli folA
The E. coli DHFR gene (folA) was PCR amplified from the
chromosomal DNA of E. coli strain DH5a. The primers used
for this were 5¢-CGCGCATGCCATATGATCAGTCTG
ATTGCG, 3¢-CCAGGCCTGCATGCTTACCGCCGCTC
CAGAATCTC. The gene was cloned into pCL476 using the
restriction enzymes NdeI and SphI. pCL476 [21] is a heat-
inducible vector containing an ampicillin (Amp) resistance
marker and a six-histidine tag at the N-terminal end of the
expressed gene. This vector was used for all rounds of direc-
ted evolution.
When protein was purified from the pCL476 vector,
although this protein was active, it failed to crystallize under
previously published conditions. The expression vector was
then changed to one without the six-histidine tag, pJWL1030
[22]. This protein was eventually crystallized under condi-
tions similar, though not identical to published conditions.
Genes were amplified using the primers 5¢-CGCGCATGC
CATATGATCAGTCTGATTGCG, 3¢-CCCAAGCTTCTG
Directed evolution in E. coli M. Watson et al.
2668 FEBS Journal 274 (2007) 2661–2671 ª 2007 The Authors Journal compilation ª 2007 FEBS
CAGTTACCGCCGCTCCAG, then cloned into pJWL1030
using the restriction enzymes NdeI and PstI. pJWL1030 is
constructed from pJJkm and pCY476, and contains a kana-
mycin (Kan) resistance marker. The inserted gene is
expressed using a constitutive LacZ operon.
Assays of enzyme expression levels and MIC tests were
performed using pCL476 as the vector, all other assays
used enzyme expressed using pJWL1030.
Expression and purification
All experiments were undertaken at 4 °C unless otherwise
stated. The pJWL1030:folA construct was transformed in
to competent E. coli DH5a cells, and grown at 37 °Ctoan
optical density of 0.6–0.7. Purification is based on that used
by Shaw et al. [23], and only a brief description will be
given here. Cells were harvested and lysed on a French
press in 0.1 mm Tris buffer (pH 7.5) containing 10 lm 2-
mercaptoethanol (buffer A). The soluble faction was loaded
onto a Q Sepharose HP Affinity Column (GE Healthcare,
Chalfont St Giles, UK), and eluted with a similar buffer
containing 0.5 m KCl (buffer B). Elution occurred at
$ 0.25 m KCl, confirmed by SDS ⁄ PAGE. Factions contain-
ing DHFR were loaded onto a Sephandex G75 size-exclu-
sion column (GE Healthcare) and eluted with buffer A.
The resulting protein was concentrated to between 20 and
50 mgÆmL
)1
and stored at 4 °C. Yields were typically 30–
40 mg per 1 L of culture. Yields of mutant enzymes were
lower than that of the native form, ranging between 80 and
90% of the amount of DHFR obtained per 1 L of culture.
Shuffling
The DNA shuffling method described by Stemmer [24] was
used to introduce random mutations in to the folA gene.
The folA gene was first amplified by PCR using the same
primers as above. Amplification was conducted using Taq
DNA polymerase to allow for the introduction of transcrip-
tion errors. The PCR product was purified then digested
using DNase I to produce fragments with an average length
of 100 bp. Fragments between 50 and 150 bp in length were
purified using gel electrophoresis. These fragments were
then reassembled by primerless PCR, then amplified using
the above primers for pCL476 and inserted into the expres-
sion vector using NdeI and SphI. The mutagenesis rate of
this protocol has been previously established at 0.7% [24].
Selection
The mutant library generated was transformed into compet-
ent DH5a cells and plated onto Mueller Hinton agar
(MHA) plates containing Amp (50 mgÆL
)1
) and TMP. Inhi-
bition of thymidine production is a major aspect of the
activity of TMP, and inclusion of thymidine in the media
allows bacterial growth regardless of the amount of TMP
present. This necessitated the use of the specialist media
MHA, as Luria–Bertani medium contains thymidine. Plates
were incubated at 37 °C for 24–48 h and $ 200 colonies
were selected for secondary screening, based on colony size,
with the largest colonies being selected. These colonies were
grown in minimal A medium (MMA) [25] containing Amp
and TMP (concentrations as below) overnight. The D
595
of
each was measured as an indicator of growth rate and the
20 colonies with the highest D
595
selected for DNA sequen-
cing. Following sequencing, the best (as determined by the
measured growth rate) 10–15 unique mutants were used to
generate the next round of mutants. The first round of evo-
lution was selected using media containing 2 mgÆL
)1
TMP,
the second with 10 mg ÆL
)1
TMP, the third with 50 mgÆL
)1
TMP and the fourth with media containing 100 mgÆL
)1
TMP. The TMP concentrations used in the third and
fourth rounds are comparable with MIC values of clinically
isolated TMP-resistant strains of E. coli [26].
A number of amino acids were selected for site-specific
mutagenesis based on trends seen in the characterization of
round three and four directed evolution mutants, and in
mutation frequency as seen in Table 1.
Point mutant generation
Single-site mutants were generated using point mutagenesis.
Primers 33 bp in length were designed to be homologous to
the section of the folA gene containing the base to be
mutated, excepting the centre three amino acids that code
for the new base. The folA gene inserted in the pJWL1030
vector was subjected to PCR using these primers and then
digested with DpnI, removing the original template. DpnIis
used for this purpose as it will only digest DNA that has
been methylated. The template DNA, having been isolated
in plasmid form from E. coli, is methylated, but the newly
synthesized (and shuffled) DNA is not.
Kinetic assays
Due to the low concentrations of DHF required to avoid
substrate inhibition (first noted by Stone et al. [16]) in these
assays, NADPH fluorescence (ex 340, em 465) was used to
increase sensitivity. This substrate inhibition is not expected
to be an issue under normal physiological conditions, as it
is only observed for concentrations of DHF in excess of
1 lm and normal intracellular concentrations of DHF are
<28 nm [27]. All fluorescence measurements were made on
a Varian Cary Eclipse Fluorescence Spectrometer. The reac-
tion was monitored by measuring the drop in NADPH
fluorescence as the reaction progressed. DHFR (3.7 nm)
was preincubated with DHF (0.2–0.8 lm) for 30 s in reac-
tion buffer (0.1 m KHPO
4
pH 7.0, 100 mm 2-mercaptoetha-
nol) based on that originally described by Baccanari et al.
M. Watson et al. Directed evolution in E. coli
FEBS Journal 274 (2007) 2661–2671 ª 2007 The Authors Journal compilation ª 2007 FEBS 2669
[14]. The preincubation was required to avoid the hysteretic
behaviour of E. coli DHFR [28]. The reaction was initiated
by the addition of NADPH (0.2–1.0 lm) and monitored to
completion. Initial rates were recorded and used to calcu-
late the Michaelis–Menton constants.
Binding assays
Binding affinity of TMP for the enzymes was measured by
monitoring the quenching of tryptophan absorbance of the
enzyme (ex 280 nm, em 345 nm) as increasing amounts of
TMP were titrated in. Measurements were made in reaction
buffer (0.1 m KHPO
4
pH 7.0, 100 mm 2-mercaptoethanol)
with DHFR (50–200 nm). TMP was titrated at concentra-
tions to ensure that no more than 5 lL was added at a time.
The reaction was allowed 2 min to equilibrate after each
addition. Fluorescence of TMP was measured by use of a
parallel reaction in which the DHFR was replaced by enough
Trp to give an equivalent fluorescence and used to correct the
final readings. Binding constants were calculated by fitting
data to equations 1 and 2 as according to Stone et al. [16].
F ¼½F
0
E
t
À F
1
ðELÞ=E
t
ð1Þ
K
d
¼ðE
t
À ELÞðL
t
À ELÞ=ðELÞð2Þ
where F, F
0
, and F
¥
are the observed florescence, the flores-
cence of free enzyme and the florescence of the enzyme
ligand complex, respectively; L
t
, EL, and E
t
are the concen-
trations of total ligand, the enzyme–ligand complex, and
the total enzyme, respectively. kaleidagraph was used to
fit the data using nonlinear regression, in all cases giving a
good fit with R-values in excess of 95%.
Stability assays
Heat stability of the enzyme was determined by incubating
aliquots of the enzyme at (45–65 °C) for 30 min, then assay-
ing for activity as described above at concentrations of
0.8 nm DHF and 0.8 nm NADPH. Residual activity was
measured by calculating the proportion of initial velocity
remaining after heating as a proportion of the initial velo-
city of the nonincubated enzyme.
MIC assays
To determine the MIC for TMP for each mutant evolved,
transformants were grown overnight on MHA plates con-
taining amounts of TMP varying from 0 to 200 mgÆmL
)1
in
steps of 50 mgÆmL
)1
.
Acknowledgements
The authors thank Cameron McRae of the Bimolecu-
lar Resource Facility for DNA sequencing.
References
1 Hartman PG (1993) Molecular aspects and mechanism
of action of dihydrofolate reductase inhibitors. J Chem-
other 5, 369–376.
2 Maskell JP, Sefton AM & Hall LM (2001) Multiple
mutations modulate the function of dihydrofolate reduc-
tase in trimethoprim-resistant Streptococcus pneumoniae.
Antimicrob Agents Chemother 45, 1104–1108.
3 Strader MB, Smiley RD, Stinnett LG, VerBerkmoes
NC & Howell EE (2001) Role of S65, Q67, I68, and
Y69 residues in homotetrameric R67 dihydrofolate
reductase. Biochemistry 40, 11344–11352.
4 Anderson AC (2005) Targeting DHFR in parasitic pro-
tozoa. Drug Discov Today 10, 121–128.
5 Bokma E, Koronakis E, Lobedanz S, Hughes C &
Koronakis V (2006) Directed evolution of a bacterial
efflux pump: adaptation of the E. coli TolC exit duct to
the Pseudomonas MexAB translocase. FEBS Lett 580,
5339–5343.
6 Venkitakrishnan RP, Zaborowski E, McElheny D,
Benkovic SJ, Dyson HJ & Wright PE (2004) Conforma-
tional changes in the active site loops of dihydrofolate
reductase during the catalytic cycle. Biochemistry 43,
16046–16055.
7 Matthews DA, Bolin JT, Burridge JM, Filman DJ, Volz
KW, Kaufman BT, Beddell CR, Champness JN,
Stammers DK & Kraut J (1985) Refined crystal struc-
tures of Escherichia coli and chicken liver dihydrofolate
reductase containing bound trimethoprim. J Biol Chem
260, 381–391.
8 Sawaya MR & Kraut J (1997) Loop and subdomain
movements in the mechanism of Escherichia coli dihy-
drofolate reductase: crystallographic evidence. Biochem-
istry 36, 586–603.
9 Fierke CA, Johnson KA & Benkovic SJ (1987) Con-
struction and evaluation of the kinetic scheme asso-
ciated with dihydrofolate reductase from Escherichia
coli. Biochemistry 26, 4085–4092.
10 Cossins EA & Chen L (1997) Folates and one-carbon
metabolism in plants and fungi. Phytochemistry 45,
437–452.
11 Kompis IM, Islam K & Then RL (2005) DNA and
RNA synthesis: antifolates. Chem Rev 105, 593–620.
12 Then RL (2004) Antimicrobial dihydrofolate reductase
inhibitors – achievements and future options: review.
J Chemother 16, 3–12.
13 Banerjee D, Mayer-Kuckuk P, Capiaux G, Budak-
Alpdogan T, Gorlick R & Bertino JR (2002) Novel
aspects of resistance to drugs targeted to dihydrofolate
reductase and thymidylate synthase. Biochim Biophys
Acta 1587, 164–173.
14 Baccanari D, Phillips A, Smith S, Sinski D & Burchall J
(1975) Purification and properties of Escherichia coli
dihydrofolate reductase. Biochemistry 14, 5267–5273.
Directed evolution in E. coli M. Watson et al.
2670 FEBS Journal 274 (2007) 2661–2671 ª 2007 The Authors Journal compilation ª 2007 FEBS
15 Dion-Schultz A & Howell EE (1997) Effects of inser-
tions and deletions in a B-bulge region of Escherichia
coli dihydrofolate reductase. Protein Engineer 10,
263–272.
16 Stone SR & Morrison JF (1982) Kinetic mechanism of
the reaction catalyzed by dyhyrofolate redustase from
Escherichia coli. Biochemistry 21, 3757–3765.
17 Adrian PV & Klugman KP (1997) Mutations in the
dihydrofolate reductase gene of trimethoprim-resistant
isolates of Streptococcus pneumoniae. Antimicrob Agents
Chemother 41, 2406–2413.
18 Coque TM, Singh KV, Weinstock GM & Murray BE
(1999) Characterization of dihydrofolate reductase genes
from trimethoprim-susceptible and trimethoprim-resist-
ant strains of Enterococcus faecalis. Antimicrob Agents
Chemother 43, 141–147.
19 Elvin CM, Liyou NE, Pearson R, Kemp DH & Dixon
NE (2003) Molecular cloning and expression of the di-
hydrofolate reductase (DHFR) gene from adult buffalo
fly (Haematobia irritans exigua ): effects of antifolates.
Insect Mol Biol 12, 173–183.
20 Kopytek SJ, Dyer JCD, Knapp GS & Hu JC (2000)
Resistance to methotrexate due to AcrAB-dependant
export from Escherichia coli. Anitmicrob Agents Chemo-
ther 44, 3210–3212.
21 Love CA, Lilley PE & Dixon NE (1996) Stable high-
copy-number bacteriophage c promoter vectors for
overproduction of proteins in Escherichia coli. Gene 176,
49–53.
22 Liu J-W, Boucher Y, Stokes HW & Ollis DL (2006)
Improving protein solubility: the use of the Escherichia
coli dihydrofolate reductase gene as a fusion reporter.
Protein Express Purif 47, 258–263.
23 Shaw D, Odom JD & Dunlap RB (1999) High expres-
sion and steady-state kinetic characterization of methio-
nine site-directed mutants of Escherichia coli methionyl-
and selenomethionyl-dihydrofolate reductase. Biochim
Biophys Acta 1429, 401–410.
24 Stemmer WPC (1994) DNA shuffling by random frag-
mentation and reassembly: in vitro recombination for
molecular evolution. Proc Natl Acad Sci USA 91,
10747–10751.
25 Miller JH (1972) Experiments in Molecular Genetics.
Cold Spring Harbour Laboratory Press, Cold Spring
Habour, NY.
26 Then RL (1993) History and future of antimicrobial
diaminopyrimidines. J Chemother 5, 361–368.
27 Nijhout HF, Reed MC, Budu P & Ulrich CM (2004) A
mathematical model of the folate cycle: new insights
into folate homeostasis. J Biol Chem 279, 55008–55016.
28 Appleman JR, Beard WA, Delcamp TJ, Prendergast
JN, Freisheim JH & Blakley RL (1989) Atypical tran-
sient state kinetics of recombinant human dihydrofolate
reductase produced by hysteretic behavior. Comparison
with dihydrofolate reductases from other sources. J Biol
Chem 264, 2625–2633.
M. Watson et al. Directed evolution in E. coli
FEBS Journal 274 (2007) 2661–2671 ª 2007 The Authors Journal compilation ª 2007 FEBS 2671