Tài liệu Báo cáo khoa học: Salt-induced formation of the A-state of ferricytochrome c – effect of the anion charge on protein structure docx
Bạn đang xem bản rút gọn của tài liệu. Xem và tải ngay bản đầy đủ của tài liệu tại đây (867.9 KB, 11 trang )
Salt-induced formation of the A-state of
ferricytochrome c – effect of the anion charge
on protein structure
Federica Sinibaldi, Maria C. Piro, Massimo Coletta and Roberto Santucci
Dipartimento di Medicina Sperimentale e Scienze Biochimiche, Universita
`
di Roma ‘Tor Vergata’, Italy
Formation of the unique, native structure of a protein
occurs through well-defined folding pathways involving
a limited number of intermediate species. In recent
years, a large body of kinetic and equilibrium studies
has provided extensive information on the folding
pathway of proteins and led to the characterization of
intermediate states, thus contributing to our under-
standing of the protein-folding mechanism [1–9].
The non-native compact state of equine cyto-
chrome c stabilized by salts in an acidic environment
(pH 2.0–2.2), called the A-state, is thought to be a
suitable model for the molten globule of cytochrome c;
it possesses a native-like a-helix conformation but a
fluctuating tertiary structure [10–14]. With respect to
the native protein, in the A-state some interior hydro-
phobic residues become exposed to the solvent [15],
the W59-one-heme-propionate hydrogen bond is
impaired (although the tryptophan remains within a
hydrophobic environment) [14], and the heme–poly-
peptide chain interaction is reduced. Also, the hydro-
phobic core (which is composed of the two major
helices and the heme group) is preserved in the A-state,
Keywords
A-state; cytochrome c; fast kinetics; folding;
site-directed mutagenesis
Correspondence
R. Santucci, Dipartimento di Medicina
Sperimentale e Scienze Biochimiche,
Universita
`
di Roma ‘Tor Vergata’,
V. Montpellier 1, 00133 Roma, Italy
Fax: +39 06 72596353
Tel: +39 06 72596364
E-mail:
(Received 1 August 2006, revised 28 sep-
tember 2006, accepted 5 October 2006)
doi:10.1111/j.1742-4658.2006.05527.x
Structural information on partially folded forms is important for a deeper
understanding of the folding mechanism(s) and the factors affecting protein
stabilization. The non-native compact state of equine cytochrome c stabil-
ized by salts in an acidic environment (pH 2.0–2.2), called the A-state, is
considered a suitable model for the molten globule of cytochrome c,asit
possesses a native-like a-helix conformation but a fluctuating tertiary struc-
ture. In this article, we extend our knowledge on anion-induced protein sta-
bilization by determining the effect of anions carrying a double negative
charge; unlike monovalent anions (which are thought to exert an ‘ionic
atmosphere’ effect on the macromolecule), divalent anions are thought to
bind to the protein at specific surface sites. Our data indicate that divalent
anions, in comparison to monovalent ions, have a greater tendency to sta-
bilize the native-like M–Fe(III)–H coordinated state of the protein. The
possibility that divalent anions may bind to the protein at the same sites
previously identified for polyvalent anions was evaluated. To investigate
this issue, the behavior of the K88E, K88E ⁄ T89K and K13N mutants was
investigated. The data obtained indicate that the mutated residues, which
contribute to form the binding sites of polyanions, are important for stabil-
ization of the native conformation; the mutants investigated, in fact, all
show an increased amount of the misligated H–Fe(III)–H state and, with
respect to wild-type cytochrome c, appear to be less sensitive to the pres-
ence of the anion. These residues also modulate the conformation of unfol-
ded cytochrome c, influencing its spin state and the coordination to the
prosthetic group.
Abbreviation
CT, charge transfer.
FEBS Journal 273 (2006) 5347–5357 ª 2006 The Authors Journal compilation ª 2006 FEBS 5347
stabilized by nonbonded interactions [12,16], whereas
the loop regions appear to be fluctuating and partly
disordered [12]. The A-state is promptly achieved at
pH around 2.2 upon addition of a salt to an aqueous
HCl solution containing denatured cytochrome c; this
has been ascribed to a screening action of the anions,
which stabilize the compact form by binding to the
positively charged groups on the protein surface [11].
Recently, we investigated the role played by mono-
valent anions in promoting the transition from the
acid-denatured protein to the A-state [17,18]. Our
results showed that the salt-induced A-state of ferri-
cytochrome c is characterized by a variety of high-
spin and low-spin states (where ‘high’ and ‘low’ stand
for the S ¼ 5 ⁄ 2 and S ¼ 1 ⁄ 2 spin states of the heme
iron, respectively) in equilibrium; in particular (at
least), two distinct low-spin species, differing in their
axial ligation to the metal, coexist in solution: a form
with the native M–Fe(III)–H coordination, and a bis-
histidine coordinated species. The equilibrium between
these two low-spin forms, here indicated as M-Fe
(III)-H
!
H-Fe(III)-H is strongly influenced by the
type of anion in solution [17,18].
Because structural information on partially folded
forms is important for a deeper understanding of the
folding mechanism(s) and the factors affecting protein
stabilization, in this article we extend our knowledge
on anion–protein interactions by determining the effect
on the protein produced by anions carrying a double
negative charge. This is an interesting point to investi-
gate, because, unlike monovalent anions (which are
thought to exert an ‘ionic atmosphere’ effect on the
macromolecule), divalent anions (as well as polyvalent
groups, such as polyphosphates [19,20]) are supposed
to bind to the protein at specific surface sites [21,22].
Results
Horse ferricytochrome c
CD measurements
Far-UV CD (200–250 nm) is a probe for the formation
of the A-state from acid-denatured cytochrome c,as
the A-state possesses a native-like a-helix structure
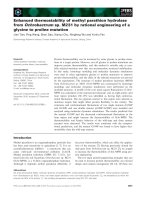
[11,17]. Figure 1 shows the gradual recovery of the
ordered secondary structure in acid-denatured ferricyt-
ochrome c upon addition of increasing amounts of
sulfate and selenate; the divalent anions stabilize the
A-state at significantly lower concentrations than those
needed for stabilization by monovalent ions [17]. As
shown in Fig. 2, the A-state tertiary conformation is
less packed than that of the native form; the protein
displays a weaker near-UV CD spectrum (Fig. 2A),
consistent with a perturbed W59 microenvironment,
and a weaker Soret CD spectrum (Fig. 2B). In this last
case, the decreased intensity of the 416 nm Cotton
effect is indicative of a perturbed heme pocket region,
as the 416 nm dichroic band is considered to be diag-
nostic for the Met80–Fe(III) coordination in native
cytochrome c [23,24]). As the M–Fe(III)–H coordina-
ted species alone contributes to the dichroic signal, a
significant population of macromolecules is expected
to lack M80 coordination to Fe (III) in the A-state
(it must be noted, however, that the signal is stronger
than that recorded in the presence of monovalent ani-
ons [17,18]). The intensity of the 416 nm dichroic band
is $ 35% that of the native state, consistent with het-
erogeneity of the A-state. On the basis of earlier data
(relative to monovalent anions) [18], a mixture between
Met80–Fe(III)–His18 coordinated species and X-Fe-
His18 miscoordinated species (where X represents the
endogeneous ligand coordinated to the metal in place
of Met80) is expected in solution. Under the condi-
tions investigated, a histidine (His26 or His33) is
expected to be the best candidate for ligand X (the
other likely candidates, i.e. the lysines, are fully proto-
nated at pH 2.2) [18].
The heterogeneous character of the A-state promp-
ted us to investigate the effect of sulfate and selenate
on the heme pocket conformation. As shown in Fig. 3,
the 416 nm dichroic band gradually increases (towards
negative ellipticity values) with anion concentration,
up to 4 mm anion; it then remains unchanged (up to
40 mm anion). This behavior markedly differs from
that displayed by the protein in the presence of
Fig. 1. Sulfate-induced (d) and selenate-induced (s) conformational
transition of acid-denatured cytochrome c to the A-state, as meas-
ured by the ellipticity at 222 nm. Experimental conditions: aqueous
HCl, pH 2.2; temperature 25 °C. The transition in perchlorate (.)is
shown for comparison.
Anion-modulated structure of cyt c A-state F. Sinibaldi et al.
5348 FEBS Journal 273 (2006) 5347–5357 ª 2006 The Authors Journal compilation ª 2006 FEBS
monovalent anions (the effect of perchlorate is illustra-
ted in Fig. 3 for comparative purposes). The changes
in the Cotton effect strength observed at high mono-
valent anion concentrations have been attributed to a
shift of the M-Fe(III)-H
!
H-Fe(III)-H equilibrium
towards formation of the bis-H species [18]. Thus,
the data in Fig. 2 indicate that divalent anions have
a stronger tendency to stabilize the (native-like)
M–Fe(III)–H coordinated form.
Unfolded macromolecules and peptides attain a
degree of structure at temperatures lower than room
temperature. We have recently shown that the A-state
induced by monovalent anions displays a temperature-
dependent 416 nm Cotton effect (temperature range:
25 °Cto2°C) [17]. In the present study, the investiga-
tion, extended to divalent anions, confirms that the
native M–Fe(III)–H bond (indicative of a more struc-
tured conformation) is stabilized by low temperature
(data not shown), indicating that protein flexibility hin-
ders methionine coordination to the heme iron [25].
Electronic absorption
The 695 nm absorption band is considered to be diag-
nostic for the M80–Fe(III) axial bond in native cyto-
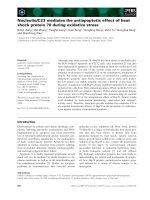
chrome c [26]. Figure 4 shows the effect of sulfate and
selenate on acid-denatured cytochrome c, investigated
Fig. 3. Effect of sulfate (s) and selenate (. ) concentration on the
heme pocket environment [and on the strength of the Met80–
Fe(III) axial bond] of the salt-induced A-state of cytochrome c,as
observed from changes induced in the 416 nm Cotton effect. The
effect induced by the monovalent anion perchlorate (d) is reported
for comparison. Other experimental conditions were as described
in the legend to Fig. 1.
A
Fig. 4. Absorbance at 695 nm of acid-denatured cytochrome c in
the presence of increasing sulfate (s) and selenate (d) concentra-
tions. The optical absorbance of native cytochrome c (—) at pH 7.0
is shown for comparison. Protein concentration: 0.25 m
M. Other
experimental conditions were as described in the legend to Fig. 1.
A
B
Fig. 2. Near-UV (A) and Soret (B) CD spectra of acid-denatured
cytochrome c in the presence of 0.02
M sulfate (—) and 0.02 M sel-
enate (— ÆÆ— ÆÆ). The spectra of the native (-Æ-Æ-) and of the dena-
tured (ÆÆÆÆ) protein are shown for comparison. Protein concentration:
10 l
M. Other experimental conditions were as described in the
legend to Fig. 1.
F. Sinibaldi et al. Anion-modulated structure of cyt c A-state
FEBS Journal 273 (2006) 5347–5357 ª 2006 The Authors Journal compilation ª 2006 FEBS 5349
by following the changes in the 695 nm absorbance
band. It appears clear that both anions favor protein
collapse into a compact form, and induce formation of
a consistent population of macromolecules ($ 35% in
sulfate, $ 28% in selenate) with native M–Fe(III)–H
coordination. These data are in excellent agreement
with CD measurements and provide independent evi-
dence for heterogeneity of the A-state.
A-state stability
Figure 5 shows the thermal denaturation profiles of
the A-state of cytochrome c, as obtained from ellip-
ticity values at 222 nm. As previously observed for
mononvalent anions [18], the shape of the unfolding
profiles features a multiple state transition, as (at least)
three distinct thermodynamic states are detected. The
profiles clearly show that protein stability strongly
depends on anion concentration; this highlights the
primary role played by the anion–protein interactions
in A-state stabilization.
Competition among anions
To better define the effect produced by monovalent
anions on the sulfate-induced A-state of cytochrome c,
we monitored the changes in the 416 nm Cotton effect
induced by increasing amounts of perchlorate and
chloride. As shown in Fig. 6, addition of monovalent
anions alters the 416 nm dichroic band; this suggests
competition between monovalent and divalent anions
for binding to the protein. In particular, both perchlor-
ate and Cl
–
shift the M-Fe(III)-H
!
H-Fe(III)-H
equilibrium towards the bis-H species, and destabilize
the M–Fe(III)–H coordinated form. The reduced effect
of Cl
–
reflects the different affinities of the two anions
for the protein [11,17].
We also monitored the effect of sulfate on the
perchlorate-induced A-state. As shown in Fig. 6, addi-
tion of sulfate strengthens the 416 nm dichroic band,
which confirms that divalent anions have a greater
tendency to stabilize the M80–Fe(III)–H18 coordinated
form. On the whole, these data support competitive
anion binding to the protein, and the idea that mono-
valent and divalent anions tend to stabilize differently
structured A-states.
Horse ferricytochrome c variants
Anions carrying multiple negative charges bind to spe-
cific sites of horse cytochrome c [19,27]. To determine
whether divalent anions bind to the same sites, we
introduced some mutations within the site-containing
regions of the macromolecule, with the aim of defining
the role played by single residues in modulating pro-
tein affinity for divalent anions. On the basis of earlier
work [19,27], the sites under consideration were:
(a) the site encompassing residues K87, K88, and R91,
located in the C-terminal a-helix segment, indicated
here as site 1; and (b) the site encompassing residues
K86, K87, and K13, located at the interface between
the N-terminal and the C-terminal a-helices, indicated
Fig. 5. Thermal stability of the A-state of cytochrome c as a func-
tion of sulfate concentration. Sulfate concentration: s,10m
M; d,
40 m
M. The experimental points refer to ellipticity values at
222 nm. Other experimental conditions were as described in the
legend to Fig. 1.
Fig. 6. Effect of perchlorate (d) and chloride (s) concentration on
the heme pocket environment of the sulfate-induced A-state of
cytochrome c, as observed from changes induced in the 416 nm
Cotton effect (sulfate concentration: 50 m
M). The effect of sulfate
(.) concentration on the perchlorate-induced A-state is also illustra-
ted (perchlorate concentration: 50 m
M). Other experimental condi-
tions were as described in the legend to Fig. 1.
Anion-modulated structure of cyt c A-state F. Sinibaldi et al.
5350 FEBS Journal 273 (2006) 5347–5357 ª 2006 The Authors Journal compilation ª 2006 FEBS
here as site 2. The residues under investigation were
substituted with residues located at the same position
in yeast iso-1-cytochrome c; as illustrated in Fig. 7,
horse and yeast cytochrome c show very different
affinities (considered here as a nonspecific indicator of
the binding effect, not as a direct measure of anion
binding to the protein) for anions.
CD and absorption measurements
In site 1, the K88E mutation introduces an acidic resi-
due (E88, present in yeast [28]) in place of a lysine,
whereas in site 2, the K13N mutation introduces an
asparagine in place of a lysine. This provides the
opportunity to evaluate the contribution of K88 and
K13 to protein stabilization in the reaction with sul-
fate. The far-UV and Soret CD spectra of the two
mutants (not shown) reveal that the two variants and
the wild-type protein are equally influenced by sulfate.
Similar results were obtained when we investigated the
spectroscopic properties of the K88E ⁄ T89K double
mutant, which, with respect to the K88E mutant, pos-
sesses a sequence closer to the corresponding sequence
in yeast iso-1-cytochrome c. A 40 mm sulfate concen-
tration induced, in all the variants investigated, native-
like a-helix content and formation of the 416 nm
Cotton effect with a strength comparable (although
not identical) to that of the wild-type protein. This
excludes the possibility that K88, T89 and K13 modu-
late horse cytochrome c affinity for anions. Also, the
mutant’s stability is not dissimilar to that of the wild-
type protein, as indicated by thermal denaturation
studies (data not shown).
Fast kinetic measurements
The 350–700 nm absorption spectrum of acid-dena-
tured cytochrome c (spectrum a of Fig. 8A) displays
an absorption maximum around 395 nm in the Soret
region, and a maximum at 497 nm, a shoulder at
528 nm and a charge transfer (CT) at 618 nm in the
visible region. The spectral changes detected at pH 2.2
Fig. 7. Sulfate-induced conformational transition of acid-denatured
horse ferricytochrome c (d) and yeast iso-1-ferricytochrome c (s)
to the A-state, as measured by the ellipticity at 222 nm. Experimen-
tal conditions: aqueous HCl, pH 2.2; temperature 25 °C.
A
B
Fig. 8. (A) Absorption spectra of ferricytochrome c before (spec-
trum a) and after 40 ms (spectrum b) and 5 s (spectrum c) of mix-
ing with 40 m
M sulfate. Absorption spectra in the visible range are
a 10-fold magnification of original spectra. (B) Kinetic progress
curves of wild-type cytochrome c after mixing with 40 m
M sulfate
at 395 nm and at 695 nm, as indicated. The progress curve at
695 nm has been magnified in order to compare its signal time
evolution with that at 395 nm. The solid lines are the least-squares
nonlinear fitting of the kinetic progress curve according to Eqn (1),
with n ¼ 2 and with the following rate constants: k
1
¼ 350 ±
40 s
)1
and k
2
¼ 8.4 ± 0.9 s
)1
at 395 nm, and k ¼ 7.7 ± 0.7 s
)1
at
695 nm.
F. Sinibaldi et al. Anion-modulated structure of cyt c A-state
FEBS Journal 273 (2006) 5347–5357 ª 2006 The Authors Journal compilation ª 2006 FEBS 5351
upon mixing acid-denatured cytochrome c with sulfate
(final anion concentration 40 mm) are shown in
Fig. 8B. At 395 nm, the kinetic process appears to be
biphasic, characterized by a fast phase (k
obs
¼
50 ± 40 s
)1
) and a slow phase (k
obs
¼ 8.4 ± 0.9 s
)1
).
The process is characterized by a red-shift of the Soret
band (initially centered at 395 nm) to 402 nm. In the
visible region, complex spectral changes are detected;
in particular, the fast phase is characterized by a slight
increase of the absorbance band centered at 528 nm
and by a blue-shift of the CT band from 618 to
616 nm (spectrum b of Fig. 8A). The slow phase is
instead characterized by a marked enhancement of the
absorbance band centered at 528 nm (at the expense of
the 497 nm peak), whereas the CT band decreases in
intensity and red-shifts from 616 nm to 623 nm. This
is also accompanied by an increase of the 695 nm band
(spectrum c of Fig. 8A), with a rate close to that
observed for the slow phase at 395 nm (Fig. 8B). Even
though variations of the CT 623 nm band may con-
tribute to the absorption change at 695 nm (thus
affecting the amplitude change), the major contribu-
tion stems from the 695 nm band; therefore, the
observed rate can be attributed to formation of the
Fe(III)–M80 axial bond, providing strong indication
that the slow phase is coupled to formation of the
native axial coordination.
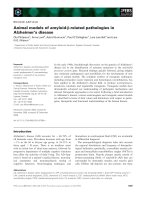
The absorption spectra of the K13N and K88E ⁄
T89K mutants, shown in Fig. 9A, differ significantly
from that of the acid-denatured cytochrome c. The
Soret absorbance band is red-shifted (more pro-
nounced in the case of the K13N mutant), and the
absorbances at 497 and 528 nm, in the visible region,
are inverted, whereas the CT band is weakened and red-
shifted. This indicates that the mutations introduced
into the protein bring about changes at the level of the
heme coordination, and suggests that even the path-
way from acid-denatured cytochrome c to the A-state
may be altered. This hypothesis is supported by data
obtained from comparison of the kinetic behavior of
the mutants with that of the acid-denatured protein in
the reaction with sulfate (Fig. 9B). As mentioned
above, at 395 nm the (sulfate-induced) refolding kinet-
ics of acid-denatured cytochrome c is biphasic
(Fig. 8B); also, the K88E ⁄ T89K double mutant shows
biphasic behavior, but in this case the fast phase is
faster and the absorbance change weaker (Fig. 9B).
The biphasicity disappears in the case of the K13N
mutant, which shows very small absorbance changes.
The optical spectra show that the two mutants differ
structurally from the wild-type protein not only in the
acid-denatured form, but even as the A-state (i.e. after
they have reacted with sulfate); this is particularly
evident for the K13N mutant (Fig. 9C). The reduced
absorbance change observed may indicate that the
variants undergo very fast optical (and thus structural)
changes within the dead time of the stopped-flow
apparatus. In the case of the K13N mutant, this hypo-
thesis finds support from the fact that the absorption
spectrum obtained 3 ms after mixing is already differ-
ent from that recorded before mixing (Fig. 9D). These
kinetic differences do not seem to influence the overall
sulfate–protein interaction; as indicated by far-UV and
Soret CD spectra (not shown), wild-type cytochrome c
and the mutants all are equally affected by the sulfate.
This rules out the hypothesis that K88, T89 and ⁄ or
K13 may modulate the protein–anion interaction, even
though kinetic data clearly indicate that the introduced
mutations influence the anion-linked structural changes
occurring in the protein. Thus, if the mutated residues
seem to exert no relevant effect on protein stability,
they play a role in shaping the pathway of the anion-
linked conformational changes.
Discussion
Cytochrome c is probably the first protein in which a
globular state induced by salt at low pH (the so-called
A-state) was named a ‘molten globule’. Goto et al.
demonstrated that the conformational transition from
acid-unfolded protein to this globular state is mediated
by anion binding to the protein, in which the anion
charge plays a primary role; the higher the charge, the
lower is the anion concentration required to stabilize
the A-state [11]. Subsequent studies have shown that
the tertiary conformation of the A-state is modulated
by the type of monovalent anion added in solution
[17]; furthermore, the protein is characterized by mul-
tiple equilibrium states between high spin and low
spin, and by (at least) two distinct low-spin states [18].
In particular, the equilibrium governing the low-
spin population, M-Fe(III)-H
!
H-Fe(III)-H, strictly
depends on anion size and concentration. The presence
of bis-H low-spin species at pH 2.2 may appear to be
unusual, because under these conditions histidines
are generally protonated (and thus unable to bind
the heme iron as strong ligands). However, spectro-
scopic data probing the existence of the bis-H low-spin
states of cytochrome c have recently been published
[17,18].
The A-state of cytochrome c consists of a native-like
folded subdomain (the hydrophobic core, formed by
the N-terminal and C-terminal helices and the heme
group [12,16,18]) and fluctuating, partially disordered
loop regions [12]. Its stabilization by monovalent ani-
ons has been ascribed to preferential anion binding to
Anion-modulated structure of cyt c A-state F. Sinibaldi et al.
5352 FEBS Journal 273 (2006) 5347–5357 ª 2006 The Authors Journal compilation ª 2006 FEBS
the positively charged clusters located on the protein
surface [11]. The distribution of lysines around the
heme crevice at the ‘front’ of the molecule is highly
conserved in eukaryotic c class cytochromes [27]; ani-
ons exert a strong influence on the lysine residues of
cytochrome c, and significantly affect the structure and
the functional properties of the protein, as the con-
served lysine-rich domain around the solvent-exposed
heme edge is involved in the interaction with redox
partners.
The present data show that divalent anions favor
recovery of native-like a-helix structure more effect-
ively than monovalent ions [11] and stabilize a signifi-
cant population of highly structured macromolecules
characterized by M80–Fe(III) coordination and ter-
tiary architecture very close to the native state [29].
A B
C D
Absorbance at 395 nm
Fig. 9. (A) Static absorption spectra of acid-denatured ferricytochrome c (spectrum a), of the K88 ⁄ T89KE double mutant (spectrum b), and of
the K13N mutant (spectrum c). Absorption spectra in the visible range are a 10-fold magnification of original spectra. (B) Kinetic progress
curves at 395 nm after mixing 40 m
M sulfate with 8 lM cytochrome c (o), K88E ⁄ T89KE mutant (x), and K13N mutant (*), at 20 °C. Continu-
ous lines are the nonlinear least-squares fitting of data according to Eqn (1), with n ¼ 2 for wild-type cytochrome c and the K88E mutant,
and n ¼ 1 for the K13N mutant. The respective rate constants are: k
1
¼ 350 ± 40 s
)1
and k
2
¼ 8.4 ± 0.9 s
)1
for wild-type cytochrome c;
k
1
¼ 470 ± 60 s
)1
and k
2
¼ 7.4 ± 0.8 s
)1
for the K88E ⁄ T89KE mutant; and k
1
¼ 19.4 ± 2.3 s
)1
for the K13N mutant. (C) Absorption spectra
of wild-type cytochrome c (spectrum a), of the K88E ⁄ T89KE mutant (spectrum b), and of the K13N mutant (spectrum c) after 5 s of mixing
with 40 m
M sulfate. Absorption spectra in the visible range are a 10-fold magnification of original spectra. (D) Absorption spectra of the acid-
denatured K13N mutant (spectrum a), of the K13N mutant after 3 ms of mixing with 40 m
M sulfate (spectrum b), and after 5 s of mixing
with 40 m
M sulfate (spectrum c). Absorption spectra in the visible range are a 10-fold magnification of original spectra. Spectrum b, which is
between spectrum a and spectrum c, has not been marked, for the sake of image clarity.
F. Sinibaldi et al. Anion-modulated structure of cyt c A-state
FEBS Journal 273 (2006) 5347–5357 ª 2006 The Authors Journal compilation ª 2006 FEBS 5353
This may reflect a different mechanism of binding to
the protein: whereas monovalent anions exert an over-
all ionic strength effect on the macromolecule by non-
specific binding to surface lysine residues, anions
carrying a double negative charge may bind to specific
sites of the protein.
NMR paramagnetic difference spectroscopy studies
have identified three binding sites for polyvalent anions
in horse cytochrome c. In particular, the locations of
these sites are: (a) in the M80-containing loop (this
site, which includes K72, K79, and K86, is here indica-
ted as site 0); (b) close to the C-terminal a-helix seg-
ment (site 1; see previous section); and (c) at the
interface between the C-terminal and N-terminal heli-
ces (site 2; see previous section) [18,27]. In this study,
the residues supposed to be involved in the interaction
with anions were replaced by others occupying the
same positions in yeast cytochrome c; as mentioned
above, horse and yeast cytochrome c display very dif-
ferent affinities for anions, despite the close similarity
in tertiary architecture [30–33]. For our purposes, this
should contribute to the identification of those residues
that control and modulate the reaction of the protein
with multivalent anions.
The M80-containing loop (a segment formed by resi-
dues 70–80) is a highly conserved region of class c cyto-
chromes and contains the same amino acid sequence in
both horse and yeast iso-1-cytochrome c [28]. There-
fore, this region provides no discriminatory informa-
tion on the role played by residues of site 0 in the
reaction with anions. By contrast, the side chain seg-
ment comprising residues 86–91 (i.e. that containing
site 1), which may potentially provide novel and inter-
esting information, is formed by the residues shown in
Table 1 (located close or within the C-terminal helix).
In the segment, position 88 is occupied by an acidic
residue (E88) in yeast cytochrome c and by a basic
residue (K88) in horse cytochrome c. A recent report
identified E62, K88 and R91 as the residues involved
in the binding of horse cytochrome c to ATP [20].
Therefore, it is possible that residues K88 and R91
modulate protein binding to divalent anions. R91 is an
invariant residue in c class cytochromes (thus, it is pre-
sent in both proteins); therefore, we introduced the
K88E mutation into horse cytochrome c. Support for
the hypothesis that the residue located at position 88
influences the protein affinity for divalent anions
comes from the fact that it is the first residue of the
C-terminal a-helix segment, in both horse and yeast
cytochrome c; as illustrated in Fig. 7, recovery of the
a-helix structure is induced in equine acid-denatured
cytochrome c, but not in yeast cytochrome c, upon
addition of sulfate in solution.
Like K88E, the K88E⁄ T89K mutation alters the
acid-denatured form, which, with respect to wild-type
cytochrome c, displays lower absorbance and a red-
shift of the CT band associated with an inverse rela-
tionship between the absorption bands centered at 497
and 528 nm (Fig. 9A). This suggests that the acid-
denatured double mutant possesses less high-spin form
than the wild-type protein (confirmed by the intensity
of the 620 nm band, also shown in Fig. 9A). However,
these differences (also observed for the K13N mutant),
do not affect the sulfate–protein interaction signifi-
cantly. Some effect is instead observed on the dynam-
ics of the anion-linked conformational changes; by
analyzing the kinetic scheme previously proposed for
the reaction between cytochrome c and monovalent
anions [18]:
HS U-state+sulfate
ðveryfastÞ
! HSA-state
! LSðI
HH
Þ A-state
ðfastÞ
! LSðI
HM
Þ A-state
ðslowÞ
ðScheme 1Þ
(where HS and LS stand for high- and low-spin, and
I
HH
and I
HM
indicate the bis-histidine and the His-Met
coordinated intermediates) we observe that the sulfate
induces a similar kinetic pathway to the refolding reac-
tion of acid-denatured cytochrome c (Fig. 8B), even
though the rates of the individual steps are signifi-
cantly faster and the final equilibrium is shifted in
favor of the LS (I
HM
) A-state (that characterized by
the native Met80–heme bonding).
In the case of the K88E ⁄ T89K mutant, the presence
of a relevant amount of LS species already in the acid-
denatured form (Fig. 9A) suggests that the double
mutation stabilizes the LS (I
HH
) A-state even in the
absence of sulfate. Therefore, the kinetic progress
curve of Fig. 9B is expected to refer: (a) for the fast
phase, to the sulfate-induced destabilization of the HS
acid-denatured form, with further formation of the LS
(I
HH
) A-state; (b) for the slow phase, to formation of
the LS native-like (I
HM
) A-state. Unlike wild-type
cytochrome c, once the equilibrium is reached, the
K88E ⁄ T89K mutant displays a higher amount of
the LS (I
HH
) A-state, as indicated by the shape of the
absorbance spectrum recorded after 5 s (Fig. 9C), and
by the small optical change at 395 nm (Fig. 9B). This
is further confirmed by the intensity of the 695 nm
Table 1. Amino acid sequence of the horse cyt c segment
containing site 1 for polyanions.
86 87 88 89 90 91
Horse K K K T E R
Yeast K K E K D R
Anion-modulated structure of cyt c A-state F. Sinibaldi et al.
5354 FEBS Journal 273 (2006) 5347–5357 ª 2006 The Authors Journal compilation ª 2006 FEBS
absorption band detected (which is considered to be
diagnostic for M–Fe(III)–H coordination [26]; spectra
not shown).
Concerning the K13N mutant, the data indicate that
the bis-H LS (I
HH
) A-state stabilization is here more
pronounced, this state representing the large majority
of macromolecules, both in the absence and in the
presence of sulfate (even though the anion shifts the
equilibria of Scheme 1 rightwards).
As a whole, it appears that the K88E, K88E ⁄ T89K
and K13N mutations lead to stabilization, in the
absence of sulfate, of the misligated bis-H LS (I
HH
)
A-state (although to a different extent for the last
mutant). The addition of sulfate does not induce stabil-
ization of the native-like LS (I
HM
) A-state, as for wild-
type cytochrome c (Fig. 9B); however, the energetic
alteration of the equilibria of Scheme 1 appears not to
affect the characteristics of the binding site for anions.
Polyanions (such as phosphates and sulfates) are
known to be powerful stabilizers of structured forms
of proteins and are often employed in studies aimed at
clarifying aspects of the folding process of proteins
[34], including cytochrome c [18]. Concerning this last
protein, fast kinetic studies established that a compact
(I
HH
)-state accumulates during the refolding process,
as an off-pathway intermediate [9]. It was thus pro-
posed that progressive accumulation of the misligated
state, produced in the nascent phase, prevents rapid
protein folding into the native conformation. In other
words, cytochrome c can be trapped in a misligated
form when refolding from the unfolded state. The
tertiary conformation of the (I
HH
)-state significantly
differs from the native conformation, as bis-H
coordination to the heme iron implies that the loop
containing H26 and H33 flips to the opposite side of
the heme with respect to the location occupied in the
native protein, and induces wrong segments of the
polypeptide chain to come into contact. The data pre-
sented in this article provide a substantial contribution
to the clarification of some aspects of the refolding
process of cytochrome c, in particular the following.
(a) Unlike monovalent ions, divalent anions act as
strong stabilizers of the native-like (I
HM
)-state of the
protein; this not only suggests a different binding
mechanism, but also indicates that the divalent anion–
protein interaction favors in the macromolecule forma-
tion of noncovalent crosslinks and interlocked packing,
which are important for stabilization of the native
state. Thus, the binding of sulfate to the acid-dena-
tured protein promotes the route towards the native
conformation. (b) The mutated residues K13, K88,
and T89, all located in segments of the polypeptide
containing binding sites for polyanions, appear to play
a role in favoring protein folding into the native con-
formation; the mutants investigated, in fact, all show
an enhanced population of the (I
HH
)-state and, with
respect to wild-type cytochrome c, appear to be less
sensitive to sulfate. Furthermore, these residues modu-
late the conformation of unfolded cytochrome c , influ-
encing its spin state and the coordination to the
prosthetic group.
Experimental procedures
Horse heart cytochrome c (type VI) was purchased from
Sigma (St Louis, MO, USA) and used without further puri-
fication. High-purity guanidine-HCl was obtained from
ICN (Costa Mesa, CA, USA). All the reagents used were
of analytical grade.
Construction of horse cytochrome c expression
system
A version of the horse cytochrome c synthetic gene was
designed on the basis of the sequence of a previously repor-
ted cytochrome c synthetic gene [35], and its synthesis was
accomplished by Primm srl (Milano, Italy). The synthetic
gene was flanked by the NcoI and BamHI restriction sites,
at the 5¢- and 3¢-ends, respectively. The pBTRI plasmid was
converted to the horse cytochrome c expression plasmid by
removing the yeast iso-1-cytochrome c gene and replacing it
with the new synthetic horse cytochrome c gene, by using
the unique NcoI and BamHI sites. The sequence of the
expression construct (pHCyc) was confirmed by DNA
sequencing (M-Medical, Milano, Italy). Mutagenesis reac-
tions were performed on the pHCyc plasmid in order to
introduce the single K88E, T89K or K13N substitution into
the horse cytochrome c gene. Production of the double
mutant K88E ⁄ T89K was achieved from the single mutant
pHCyc-K88E plasmid, which was used as template in a sec-
ond round of mutagenesis.
Cell growth and purification of recombinant
horse cytochrome c
The expression plasmid of horse cytochrome c was intro-
duced into Escherichia coli JM 109 strain; bacterial expres-
sion and purification of the recombinant protein were then
conducted as previously described [25]. Briefly, E. coli strain
JM 109 containing the pBTRI (or the mutated) plasmid
was grown at 37 °C, in 2 L of SB medium containing
100 lgÆmL
)1
ampicillin to an absorbance of 0.3 at 600 nm.
Induction was accomplished by adding isopropyl-b-d-thio-
galactopyranoside to a final concentration of 0.75 mm.
Cells were then incubated at 37 °C overnight, harvested by
centrifugation at 6084 g (G53 rotor) in a centrifuge, model
RC-5B, Sorvall (New Castle, DE, USA), for 10 min, and
F. Sinibaldi et al. Anion-modulated structure of cyt c A-state
FEBS Journal 273 (2006) 5347–5357 ª 2006 The Authors Journal compilation ª 2006 FEBS 5355
frozen at ) 80 °C. After thawing, the reddish pellets were
resuspended in 50 mm Tris ⁄ HCl buffer, pH 8.0 [3–4 mLÆ
(g wet cells)
)1
]. Lysozyme (1 mgÆmL
)1
) and DNase
(5 lgÆmL
)1
) were then added to the homogenized cells. The
suspension was left in ice for 1 h and then sonicated for
1 min, at medium intensity. After centrifugation, the super-
natant was dialyzed overnight against 10 mm phosphate
buffer (pH 6.2), and loaded onto a CM 52 column (40 mL
bed volume) equilibrated with the same buffer. Purification
was performed by eluting the protein with one volume of
45 mm phosphate (pH 6.8) ⁄ 250 mm NaCl. After purifica-
tion, the recombinant protein ($ 500 lm) had a purity
> 98% (determined by SDS ⁄ PAGE analysis and RP-
HPLC; not shown), and was stored at ) 80 °C in 200 lL
aliquots.
CD measurements
Measurements were carried out using a Jasco J-710 spectro-
polarimeter (Tokyo, Japan) equipped with a PC as a data
processor. The molar ellipticity, [h] (degÆcm
2
Ædmol
)1
), is
expressed on a molar heme basis in the near-UV (270–
300 nm) and Soret (380–450 nm) regions, and as mean resi-
due ellipticity in the far-UV region (200–250 nm, mean resi-
due M
r
¼ 119).
Electronic absorption measurements
Electronic absorption measurements were carried out at
25 °C using a Jasco V-530 spectrophotometer. An extinc-
tion coefficient e
408
¼ 106 mm
)1
Æcm
)1
was used to deter-
mine sample concentration.
Fast kinetics measurements
Kinetic measurements of the effect of sulfate on acid-
denatured cytochrome c and variants at pH 2.2 were carried
out employing a rapid-mixing stopped-flow apparatus
SX.18MV (Applied Photophysics Co., Salisbury, UK) with
1 ms dead time, equipped with a diode array for transient
spectra collection over the 350–700 nm absorption range.
Acid-denatured Fe(III)–cytochrome c (or the investigated
variants) was mixed with the salt solution at pH 2.2, and
progress curves were followed at different wavelengths.
Spectra were then reconstructed by the signal amplitudes at
different wavelengths and time intervals.
Kinetic progress curves were fitted according to the fol-
lowing equation:
A
obs
¼ A
1
Æ
X
i¼n
i¼1
DA
i
Á exp
ðÀk
i
ÁtÞ
ð1Þ
where A
obs
is the absorbance at a given wavelength and at
a given time interval, A
¥
is the absorbance at longer time
intervals (when the reaction is completed), DA
i
is the absor-
bance change for phase I, k
i
is the rate constant for phase
I, and t is time. The ‘±’ sign means that, at different wave-
lengths, the absorbance may either decrease or increase.
Acknowledgements
This research was funded in part by grants from the
Italian MIUR (PRIN 2004 055484).
References
1 Sosnick TR, Mayne L, Hiller R & Englander SW (1994)
The barriers in protein folding. Nat Struct Biol 1, 149–
156.
2 Sali A, Shakhnovich EI & Karplus M (1994) How does
a protein fold? Nature 369, 248–251.
3 Baldwin RL (1995) The nature of protein folding path-
ways: the classical versus the new view. J Biomolec
NMR 5, 103–109.
4 Bai Y, Sosnick TR, Mayne L & Englander SW (1995)
Protein folding intermediates: native-state hydrogen
exchange. Science 269, 192–197.
5 Ewbank JJ, Creighton TE, Hayer-Hartle MK & Hartle
FU (1995) What is the molten globule? Nature Struct
Biol 2, 10.
6 Privalov PL (1996) Intermediate states in protein fold-
ing. J Mol Biol 258, 707–725.
7 Dill KA & Chan HS (1997) From Levinthal to path-
ways to funnels. Nat Struct Biol 4, 10–19.
8 Baldwin RL (1997) Competing unfolding pathways. Nat
Struct Biol 4, 965–966.
9 Yeh S-R & Rousseau DL (1998) Folding intermediates
in cytochrome c. Nat Struct Biol 5, 222–228.
10 Jeng MF, Englander SW, Elove GA, Wand AJ & Roder
H (1990) Structural description of acid denatured cyto-
chrome c by hydrogen exchange and 2D NMR. Bio-
chemistry 29, 10433–10437.
11 Goto Y, Takahashi N & Fink AL (1990) Mechanism of
acid-induced folding of proteins. Biochemistry 29, 3480–
3488.
12 Goto Y & Nishikiori S (1991) Role of electrostatic
repulsions in the acidic molten globule of cytochrome c.
J Mol Biol 222, 679–686.
13 Jordan T, Eads JC & Spiro TG (1995) Secondary and
tertiary structure of the A state of cytochrome c from
resonance Raman spectroscopy. Protein Sci 4, 716–728.
14 Pletneva EV, Gray HB & Winkler JR (2005) Nature of
the cytochrome c molten globule. J Am Chem Soc 127,
15370–15371.
15 Kuroda Y, Kidokoro S & Wada A (1992) Thermody-
namic characterization of cyt c at low pH. J Mol Biol
223, 1139–1153.
16 Marmorino JL, Lehti M & Pielak GJ (1998) Native
tertiary structure in an A state. J Mol Biol 275,
379–388.
Anion-modulated structure of cyt c A-state F. Sinibaldi et al.
5356 FEBS Journal 273 (2006) 5347–5357 ª 2006 The Authors Journal compilation ª 2006 FEBS
17 Santucci R, Bongiovanni C, Mei G, Ferri T, Polizio F
& Desideri A (2000) Anion size modulates the structure
of the A state of cytochrome c. Biochemistry 39, 12632–
12638.
18 Sinibaldi F, Howes BD, Smulevich G, Ciaccio C,
Coletta M & Santucci R (2003) Anion concentration
modulates conformation and stability of the molten
globule of cytochrome c. J Biol Inorg Chem 8, 663–
670.
19 Concar DW, Whitford D & Williams JP (1991) The
location of the polyphosphate-binding sites on cyto-
chrome c measured by NMR paramagnetic difference
spectroscopy. Eur J Biochem 199, 569–574.
20 Sinibaldi F, Mei G, Polticelli M, Piro MC, Howes BD,
Smulevich G, Santucci R, Ascoli F & Fiorucci L (2005)
ATP specifically drives refolding of nonnative confor-
mations of cytochrome c. Protein Sci 14, 1049–1058.
21 Battistuzzi G, Borsari M & Sola M (1997) Anion bind-
ing to cytochrome c2: implications on protein–ion inter-
actions in class I cytochromes c. Arch Biochem Biophys
339, 283–290.
22 Battistuzzi G, Borsari M, Ranieri A & Sola M (2001)
Effects of specific anion–protein binding on the alka-
line transition of cyt c. Arch Biochem Biophys 386,
117–122.
23 Sinibaldi F, Piro MC, Howes BD, Smulevich G, Ascoli
F & Santucci R (2003) Rupture of the H-bond linking
two omega-loops induces the molten globule state at
neutral pH in cytochrome c. Biochemistry 42, 7604–
7610.
24 Pielak GJ, Oikawa K, Mauk AG, Smith M & Kay CM
(1986) Elimination of the negative Soret Cotton effect
of eukaryotic cytochromes c by replacement of an invar-
iant phenylalanine residue by site-directed mutagenesis.
J Am Chem Soc 108, 2724–2727.
25 Santucci R & Ascoli F (1996) The Soret CD spectrum
as a probe for the heme Fe(III)-Met(80) axial bond
in horse cytochrome c. J Inorg Biochem 68, 211–
214.
26 Stellwagen E & Cass R (1974) Alkaline isomerization
of ferricytochrome c from Euglena gracilis. Biochem
Biophys Res Commun 60, 371–375.
27 Pielak GJ, Auld DS, Betz SF, Hilgen-Willis SE & Gar-
cia LL (1996) Nuclear magnetic resonance studies of
class I cytochromes c.InCytochrome C. A Multidisci-
plinary Approach (Scott RA & Mauk AG, eds), pp.
203–284. University Science Books, Sausalito, CA.
28 Moore GR & Pettigrew GW (1990) Cytochromes c.
Evolutionary, Structural and Physicochemical Aspects.
Springer-Verlag, Berlin.
29 Maity H, Maity M, Krishna MMG, Mayne L & Englan-
der SW (2005) Protein folding: the stepwise assembly of
foldon units. Proc Natl Acad Sci USA 102, 4741–4746.
30 Bushnell GW, Louie GV & Brayer GD (1990) High-
resolution three-dimensional structure of horse heart
cytochrome c.
J Mol Biol 214, 585–595.
31 Louie GV & Brayer GD (1990) High resolution refine-
ment of yeast iso-1-cytochrome c and comparison with
other eukaryotic cytochromes c. J Mol Biol 214, 527–
555.
32 Banci L, Bertini I, Gray HB, Luchinat C, Reddig T,
Rosato A & Turano P (1997) Solution structure of oxi-
dized horse heart cytochrome c. Biochemistry 36, 9867–
9877.
33 Banci L, Bertini I, Bren KL, Gray HB, Sompornpisut P
& Turano P (1997) Solution structure of oxidized Sac-
charomyces cerevisiae iso-1-cytochrome c. Biochemistry
36, 8992–9001.
34 Otzen DE & Oliveberg M (1999) Salt-induced detour
through compact regions of the protein folding land-
scape. Proc Natl Acad Sci USA 96, 11746–11751.
35 Patel CN, Lind MC & Pielak G (2001) Characterization
of horse cytochrome c expressed in E. coli. Protein Expr
Purif 22, 220–224.
F. Sinibaldi et al. Anion-modulated structure of cyt c A-state
FEBS Journal 273 (2006) 5347–5357 ª 2006 The Authors Journal compilation ª 2006 FEBS 5357