Tài liệu Báo cáo khoa học: Hypoxia reduces the expression of heme oxygenase-2 in various types of human cell lines A possible strategy for the maintenance of intracellular heme level pdf
Bạn đang xem bản rút gọn của tài liệu. Xem và tải ngay bản đầy đủ của tài liệu tại đây (407.94 KB, 12 trang )
Hypoxia reduces the expression of heme oxygenase-2 in
various types of human cell lines
A possible strategy for the maintenance of intracellular heme level
Yongzhao Zhang
1
, Kazumichi Furuyama
1
, Kiriko Kaneko
1
, Yuanying Ding
1
, Kazuhiro Ogawa
2,
*,
Miki Yoshizawa
1
, Masaki Kawamura
1
, Kazuhisa Takeda
1
, Tadashi Yoshida
3
and Shigeki Shibahara
1
1 Department of Molecular Biology and Applied Physiology, Tohoku University School of Medicine, Sendai, Japan
2 Department of Molecular Pharmacology, Tohoku University School of Medicine, Sendai, Japan
3 Department of Biochemistry, Yamagata University School of Medicine, Yamagata, Japan
Heme oxygenase (HO) is the rate-limiting enzyme in
heme catabolism and cleaves heme to release iron, car-
bon monoxide and biliverdin at the expense of molecu-
lar oxygen and NADPH [1,2]. HO consists of two
structurally related isozymes, HO-1 and HO-2 [3–5].
Characteristically, human HO-1 contains no cysteine
residue [6], whereas HO-2 contains at least two copies of
a potential heme-binding site, consisting of the cysteine
and proline (CP motif) [7,8]. Importantly, these CP
motifs are not involved in heme breakdown reactions
[8], suggesting that HO-2 may sequester heme to main-
tain the intracellular heme level. In addition, expression
of HO-1 mRNA is induced by various stimuli, such as
hemin and nitric oxide donors, in which expression of
Keywords
erythroid cells; heme oxygenase-1; heme
oxygenase-2; hemoglobin; hypoxia
Correspondence
S. Shibahara, Department of Molecular
Biology and Applied Physiology, Tohoku
University School of Medicine, 2-1 Seiryo-
machi, Aoba-ku, Sendai, Miyagi 980-8575,
Japan
Fax: +81 22 717 8118
Tel: +81 22 717 8117
E-mail:
*Present address
Department of Molecular Pharmacology,
Kanazawa University Graduate School of
Medical Science, Kanazawa, Japan
(Received 26 January 2006, revised 5 May
2006, accepted 15 May 2006)
doi:10.1111/j.1742-4658.2006.05319.x
Heme oxygenase consists of two structurally related isozymes, heme oxyge-
nase-1 and and heme oxygenase-2, each of which cleaves heme to form bili-
verdin, iron and carbon monoxide. Expression of heme oxygenase-1 is
increased or decreased depending on cellular microenvironments, whereas lit-
tle is known about the regulation of heme oxygenase-2 expression. Here we
show that hypoxia (1% oxygen) reduces the expression levels of heme oxyge-
nase-2 mRNA and protein after 48 h of incubation in human cell lines, inclu-
ding Jurkat T-lymphocytes, YN-1 and K562 erythroleukemia, HeLa cervical
cancer, and HepG2 hepatoma, as judged by northern blot and western blot
analyses. In contrast, the expression level of heme oxygenase-1 mRNA varies
under hypoxia, depending on the cell line; it was increased in YN-1 cells,
decreased in HeLa and HepG2 cells, and remained undetectable in Jurkat
and K562 cells. Moreover, heme oxygenase-1 protein was decreased in YN-1
cells under the conditions used, despite the induction of heme oxygenase-1
mRNA under hypoxia. The heme oxygenase activity was significantly
decreased in YN-1, K562 and HepG2 cells after 48 h of hypoxia. To explore
the mechanism for the hypoxia-mediated reduction of heme oxygenase-2
expression, we showed that hypoxia shortened the half-life of heme oxyge-
nase-2 mRNA (from 12 h to 6 h) in YN-1 cells, without affecting the half-life
of heme oxygenase-1 mRNA (9.5 h). Importantly, the heme contents were
increased in YN-1, HepG2 and HeLa cells after 48 h of incubation under
hypoxia. Thus, the reduced expression of heme oxygenase-2 may represent
an important adaptation to hypoxia in certain cell types, which may contrib-
ute to the maintenance of the intracellular heme level.
Abbreviations
HO, heme oxygenase; HRE, hypoxia response element; MARE, Maf recognition element.
3136 FEBS Journal 273 (2006) 3136–3147 ª 2006 The Authors Journal compilation ª 2006 FEBS
HO-2 mRNA is largely unchanged [9–12]. Notably,
hypoxia decreases the expression of HO-1 in several
types of human cell [13,14], but conversely induces it in
cultured human dermal fibroblasts [15] and a retinal pig-
ment epithelial cell line [16]. Thus, expression of HO-1
mRNA is differentially regulated in human cells by hyp-
oxia, depending on cell type. On the other hand, recent
reports have shown that expression of HO-2 is decreased
in the placental tissues of abnormal pregnancies [17,18]
and in cultured human trophoblast cells [19]. However,
little is known about the regulation of HO-2 expression.
Using HO-2-deficient mice [20], we have shown that
the mice lacking HO-2 exhibit hypoxemia with normal
arterial CO
2
tension (P
a
co
2
) and attenuated hypoxic
ventilatory responses with normal hypercapnic ventila-
tory responses [21], which led us to propose a novel
function of HO-2 as an oxygen sensor. Subsequently,
it has been shown that HO-2 interacts with the a-sub-
unit of a large-conductance, calcium-sensitive potas-
sium channel (the BK channel) and may function as
an oxygen sensor for the BK channel [22]. Taken
together, these results suggest that hypoxia may inhibit
the BK channel activity in the carotid body through
HO-2, which ultimately enhances ventilation.
Clinically, hypoxia represents a decrease in O
2
pres-
sure in inspired gas and causes hypoxemia, which is a
hemodynamic stress and could lead to pulmonary
hypertension [23,24]. Hypoxemia is a common mani-
festation of various diseases, such as chronic obstruct-
ive pulmonary disease [25], and is also seen in the
HO-2-deficient mice [21]. Moreover, we have shown
that the expression levels of HO-2 protein were
decreased by about 40% in the mouse liver after
7 days of normobaric hypoxia (10% oxygen) and
returned to the basal level after 14 days of hypoxia
[26]. It is therefore of significance to study the regula-
tion of HO-2 expression in human cells under hypoxia.
In the present study, we have analyzed the effect of
hypoxia on the expression levels of HO-1 and HO-2 in
various types of human cell line, including erythrole-
ukemia and hepatoma cells. We have shown that hyp-
oxia reduces the expression of HO-2 in five out of six
cell lines examined. We suggest that the reduced
expression of HO-2 represents an important response
during acclimatization to hypoxia.
Results
Effects of hypoxia on HO-1 and HO-2 expression
in human cell lines
We initially analyzed the effects of hypoxia on the
expression of HO-1 and HO-2 in human cell lines of
bone marrow origin, including KG1 myeloid cells, Jur-
kat T-lymphocytes, and K562 and YN-1 erythroid
cells. YN-1 cells were established from the peripheral
blood of a patient with chronic myelogenous leukemia
in blastic crisis [27]. Each cell line was incubated for
48 h under normoxia or hypoxia (5% or 1% oxygen).
HO-1 mRNA expression was substantially increased
under 1% oxygen in KG1 and YN-1 cells, whereas
HO-1 mRNA was undetectable in Jurkat and K562
cells (Fig. 1A). In contrast, expression of HO-2 mRNA
was detected in these four cell lines and decreased by
hypoxia (1% oxygen) in Jurkat, K562 and YN-1 cells,
but remained unchanged in KG1 cells. Under hypoxia,
expression levels of b-actin mRNA were unchanged.
We next measured the levels of HO-1 and HO-2 pro-
teins by western blot analysis (Fig. 1B). The expression
levels of HO-1 protein remained unchanged in KG1
cells and decreased by about 20% in YN-1 cells after
A
B
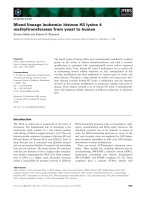
Fig. 1. Effects of hypoxia on expression of heme oxygenase (HO)-1
and HO-2 in human cell lines of bone marrow origin. (A) Northern
blot analysis of HO-1 and HO-2 mRNA. KG1 myeloid cells, Jurkat
T-lymphocytes and K562 and YN-1 erythroleukemia cells were cul-
tured under normoxia (N) or hypoxia (H) (5% or 1% oxygen) for
48 h, and harvested. Total RNA was extracted from each cell line,
and then subjected to northern blot analysis. Each lane contains
15 lg of total RNA. The bottom panel shows the expression of
b-actin mRNA as an internal control. (B) Western blot analysis. The
indicated cells were harvested after cultivation under normoxia (N)
or hypoxia (1% oxygen) for 48 h. The cell extracts were prepared
for western blot analysis of HO-1 and HO-2. The lane labeled 0 h
contained cell extracts prepared from untreated cells harvested just
before starting the experiment. Each lane contains 20 lg of protein.
To normalize the expression levels, the same filter was reused for
a-tubulin monoclonal antibody. Note that HO-1 mRNA and protein
were undetectable in Jurkat and K562 cells under the conditions
used.
Y. Zhang et al. Reduced expression of heme oxygenase-2
FEBS Journal 273 (2006) 3136–3147 ª 2006 The Authors Journal compilation ª 2006 FEBS 3137
48 h of hypoxia (1% oxygen), despite the increased
expression of HO-1 mRNA in these two cell lines.
Consistent with the HO-1 mRNA level, HO-1 protein
was undetectable in Jurkat and K562 cells. The HO-2
protein levels were noticeably decreased under hypoxia
in Jurkat, K562 and YN-1 cells, in which a-tubulin
protein levels were not changed. The expression levels
of HO-2 protein were decreased by about 26% under
hypoxia in both K562 and YN-1 cells. Thus, hypoxia
consistently decreased the expression levels of HO-2
mRNA and protein in Jurkat T-lymphocytes and
YN-1 and K562 erythroid cell lines.
To further analyze the effects of hypoxia on the
expression of HO-1 and HO-2, we performed similar
analyses in two human cancer cell lines, HeLa cervical
cancer and HepG2 hepatoma cells. Hypoxia (1% oxy-
gen) decreased the expression levels of HO-1 and
HO-2 mRNA after 48 h of incubation in the two cell
lines (Fig. 2A). Likewise, hypoxia decreased the levels
of HO-1 and HO-2 proteins by more than 60% and
30%, respectively, in HeLa cells, and by 90% and
20%, respectively, in HepG2 cells (Fig. 2B). Taken
together, these results indicate that hypoxia reduces
the expression levels of HO-2 mRNA and protein in
five out of six cell lines, with the exception of KG1
myeloid cells.
Hypoxia decreases the expression levels of HO-2
protein in YN-1 and K562 cells
To confirm the hypoxia-mediated reduction of HO-2
expression, we performed a time-course study in YN-1
and K562 erythroleukemia cell lines. In YN-1 cells, the
expression levels of HO-1 and HO-2 proteins were sig-
nificantly reduced after 48 h of hypoxia (1% oxygen)
(Fig. 3A,B). In K562 cells, hypoxia reduced HO-2 pro-
tein after 48 h (Fig. 3C,D), although the expression of
HO-1 protein remained undetectable.
Hypoxia decreases HO activity in YN-1, K562 and
HepG2 cells
We next measured HO activity in YN-1, K562, HeLa
and HepG2 cells exposed to hypoxia for 48 h, when
the expression levels of HO-2 protein were significantly
decreased (Figs 2 and 3). HO activity was determined
in the microsomal fraction, prepared from normoxia
or hypoxia-exposed cells, as described in Experimental
procedures. It should be noted that sufficient amounts
of purified biliverdin reductase and cytochrome P450
reductase were added to the reaction mixture to meas-
ure the full HO activity. HO activity was decreased in
YN-1, K562 and HepG2 cells by hypoxia (Fig. 4). In
contrast, HO activity was undetectable in HeLa cells
treated under normoxia or hypoxia, which is consistent
with our previous report that HO activity was unde-
tectable in HeLa cells [9]. Thus, HO activity is not pro-
portional to the expression levels of HO-1 and HO-2
proteins, detected by western blot analysis.
Opposite effects of hypoxia on expression of
HO-1 and HO-2 mRNA in YN-1 cells
To explore the mechanism of the hypoxia-mediated
reduction of HO-1 and HO-2 protein levels, we ana-
lyzed the effects of hypoxia on the expression of HO-1
and HO-2 mRNA in YN-1 erythroleukemia cells,
which express detectable levels of both HO-1 and
HO-2 mRNA (Fig. 1A). The expression levels of HO-1
mRNA were induced after 48 h of hypoxia (1% oxy-
gen) (Fig. 5A,B), whereas HO-2 mRNA levels were
significantly decreased (Fig. 5A,C). In contrast, under
mild hypoxia (5% oxygen), the changes in HO-1 and
HO-2 mRNA levels were not statistically significant.
Thus, hypoxia (1% oxygen) decreased the expression
levels of HO-1 protein in YN-1 cells (Fig. 3A), despite
the increased expression of HO-1 mRNA (Fig. 5A).
On the other hand, the expression levels of HO-2
mRNA and protein were both reduced under hypoxia
(1% oxygen) (Figs 3A and 5A).
A
B
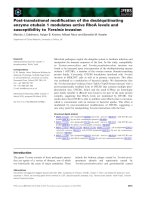
Fig. 2. Decreased expression of heme oxygenase (HO)-1 and HO-2
under hypoxia in human cancer cells. (A) Northern blot analysis of
HO-1 and HO-2 mRNA. HeLa cervical cancer and HepG2 hepatoma
cells were cultured under normoxia (N) or hypoxia (H: 1% oxygen)
for 48 h, and harvested. Each lane contains 15 lg of total RNA.
The bottom panel shows the expression of 28S rRNA as an internal
control. (B) Western blot analysis. HeLa and HepG2 cells were har-
vested after cultivation under normoxia (N) or hypoxia (1% oxygen)
for 48 h. The cell extracts were prepared for western blot analysis
of HO-1 and HO-2. Each lane contains 20 lg of protein. To normal-
ize the expression levels, the same filter was reused for a-tubulin
monoclonal antibody.
Reduced expression of heme oxygenase-2 Y. Zhang et al.
3138 FEBS Journal 273 (2006) 3136–3147 ª 2006 The Authors Journal compilation ª 2006 FEBS
Stability of HO-1 and HO-2 mRNA under hypoxia
We then analyzed the stability of HO-1 and HO-2
mRNA in YN-1 cells under hypoxia (1% oxygen). In
this series of experiments, YN-1 cells were precultured
for 12 h under normoxia or hypoxia before addition of
actinomycin D. The half-life of HO-1 mRNA in YN-1
cells was about 9.5 h under normoxia, and remained
unchanged under hypoxia (Fig. 6A,B). In contrast, the
half-life of HO-2 mRNA was about 12 h under norm-
oxia (Fig. 6A,C), and was shortened to 6 h under hyp-
oxia. The decreased levels of HO-2 mRNA may be in
part due to the enhanced degradation of the HO-2
mRNA.
Functional analysis of the HO-1 and HO-2 gene
promoters under hypoxia
To address the question of whether hypoxia influences
the promoter activity of the human HO-1 or HO-2
gene, we performed transient expression assays. Prior
to the functional analysis of the HO-2 gene promoter,
we determined its transcription initiation site by
5¢-RACE, and this indicated that transcription is
initiated from multiple sites (Fig. 7A). The most
5¢-upstream initiation site was identified as the G resi-
due at position + 1, which is located 139 bp upstream
of the start ATG codon in exon 2. The presence of the
exon 1 sequence was also confirmed by RT-PCR ana-
lysis of YN-1 RNA. The 5¢-flanking sequence lacks a
consensus TATA box but contains several sequence
motifs for binding of transcription factors, such as
Sp1. Incidentally, the HO-2 gene and the gene enco-
ding HSCARG of unknown function (GenBank acces-
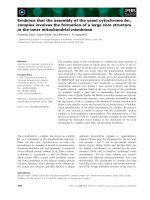
Fig. 3. Time-dependent effects of hypoxia on heme oxygenase (HO)-2 protein levels in two erythroid cell lines. YN-1 (A, B) and K562 cells
(C, D) were cultured under normoxia (N) or hypoxia (1% oxygen) for the indicated numbers of hours, and the cell extracts were subjected to
western blot analysis (A, C). Other conditions are described in Fig. 1B. The intensities of the signals in (A) and (C) were quantified, and the
intensity representing HO-1 or HO-2 protein was normalized with respect to the intensity for the a-tubulin signal. Shown are the relative
expression levels of HO-1 and HO-2 proteins in YN-1 cells (B) and those of HO-2 protein in K562 cells (D). The intensity representing HO-1
or HO-2 protein at the 0 time (0 h) is considered to be 100%. The ratio of each normalized value to the 0 time value (indicated by 0) is
shown as the relative expression level of HO-1 or HO-2 protein. Asterisks represent statistically significant differences compared to 0 h:
*P<0.05; **P<0.01.
aL
eH
2Gpe
H2
6
5
K
1-
NY
0
3.
0
6.0
9.0
2.1
HO activity
(nmol bilirubin/mg protein/h)
DN
D
ND
N
N
%1H
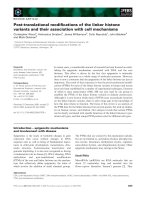
Fig. 4. Hypoxia decreases the heme oxygenase (HO) activity in
YN-1, K562 and HepG2 cells.YN-1, K562, HepG2 and HeLa cells
were cultured for 48 h under normoxia or hypoxia, and then harves-
ted. The microsome fraction was prepared and used for the assay
of HO activity. The data are means ± SEM of three independent
experiments. Note that the HO activity was undetectable in YN-1
cells exposed to hypoxia and in HeLa cells exposed to normoxia or
hypoxia (shown as ND).
Y. Zhang et al. Reduced expression of heme oxygenase-2
FEBS Journal 273 (2006) 3136–3147 ª 2006 The Authors Journal compilation ª 2006 FEBS 3139
sion number AAG09721) are located adjacently in a
head-to-head orientation, and their transcription start
sites are 1.5 kb apart. We therefore analyzed the
promoter function of the 1.5 kb 5¢-flanking region of
the HO-2 gene in the present study.
YN-1 cells were transfected with each construct of the
HO-1 and HO-2 gene promoters (Fig. 7B). The reporter
plasmids used for the HO-1 gene included phHOLUC45
with a Maf recognition element (MARE) and phHO-
LUC40 without MARE [16], and those for the HO-2
gene, phHO2(-1492), phHO2(-663), and phHO2(-25).
The HO-1 gene promoter contains a putative hypoxia-
responsive element (HRE) sequence CACGTGA (posi-
tions ) 44 to ) 39) that overlaps the functional E-box
[14,16,28]. Hypoxia did not change the expression of
phHOLUC45, phHOLUC40 or phHOLUC(-58) in
YN-1 cells (Fig. 7B), despite the fact that a putative
HRE sequence is present in phHOLUC45 and phHO-
LUC40. Likewise, hypoxia did not influence the expres-
sion of HO-2 promoter constructs in YN-1 cells
(Fig. 7B). In contrast, hypoxia consistently increased
the promoter activity of a construct, HRESV40, which
contains four copies of HRE, but showed only marginal
effects on the promoter activity of NHRESV40, a negat-
ive control for hypoxic induction.
Hypoxia increases cellular heme contents in
human cell lines
To explore the implication for the reduced expression
levels of HO-1 and HO-2 proteins under hypoxia, we
studied whether hypoxia influences the cellular heme
contents in YN-1, HepG2 and HeLa cells (Fig. 8).
Heme contents were measured in each cell line after
incubation under normoxia or hypoxia for 48 h. Heme
contents were increased in the three cell lines after
48 h of culture under hypoxia (Fig. 8). The degree of
increase was small but statistically significant.
Discussion
We have hypothesized that a certain degree of reduc-
tion in heme degradation is probably important in the
preservation of intracellular heme, an essential compo-
nent of various hemoproteins [5]. The present study
has shown that hypoxia consistently reduces the
expression levels of HO-2 mRNA and protein in five
out of six human cell lines: Jurkat, YN-1, K562, HeLa
and HepG2. In this context, Newby et al. [29] des-
cribed decreased levels of HO-2 protein in placentas
of women who reside at high altitude and are thus
A
BC
Fig. 5. Differential effects of hypoxia on heme oxygenase (HO)-1 and HO-2 mRNA expression in YN-1 cells. (A) Northern blot analysis. YN-1
cells were harvested after cultivation under normoxia (N) or hypoxia (5% or 1% oxygen) for the indicated numbers of hours. Each lane con-
tains 15 lg of total RNA. The lane labeled 0 h contained RNA prepared from untreated cells harvested just before starting the experiment.
At the bottom of each panel, 28S rRNA of each sample was visualized by ethidium bromide staining. The data are from one of three inde-
pendent experiments with similar results. (B, C) Relative expression levels of HO-1 and HO-2 mRNA. The intensities of the signals in (A)
were quantified, and the intensity representing HO-1 or HO-2 mRNA was normalized with respect to the intensity for the 28S RNA signal.
The intensity representing HO-1 or HO-2 mRNA at the 0 time (0 h) is considered to be 100%. The ratio of each normalized value to the
0 time value (indicated by 0 h) is shown as the relative expression level of HO-1 or HO-2 mRNA. Asterisks represent statistically significant
differences compared to 0 h: *P<0.05; **P<0.01.
Reduced expression of heme oxygenase-2 Y. Zhang et al.
3140 FEBS Journal 273 (2006) 3136–3147 ª 2006 The Authors Journal compilation ª 2006 FEBS
exposed to chronic hypoxia. Moreover, we have shown
that the expression levels of HO-2 protein were transi-
ently decreased in the mouse liver after 7 days of
normobaric hypoxia [26]. These results suggest that the
reduced expression of HO-2 protein may be an import-
ant hypoxic response in certain cell types.
Hypoxia exerted differential effects on the expression
of HO-1, depending on the cell line (Figs 1 and 2). It
should be noted that HO-1 protein levels remained
unchanged in KG1 myeloid cells and were significantly
reduced in YN-1 erythroleukemia cells after 48 h of
hypoxia (1% oxygen), despite the increased level of
HO-1 mRNA. These results suggest that certain mech-
anisms, such as the active degradation of HO-1 pro-
tein, might ensure constant or reduced expression
levels of HO-1 protein in these cell lines under hypo-
xia. In contrast, the expression levels of HO-1 mRNA
and protein were consistently decreased in HeLa and
HepG2 cells. Interestingly, hypoxia tends to increase
the cellular heme contents in YN-1, HepG2 and HeLa
cells, which might be a consequence of reduced heme
degradation and ⁄ or enhanced heme synthesis [30,31].
In the present study, we focused on YN-1 erythrole-
ukemia cells to investigate the hypoxia-mediated reduc-
tion of HO-2 expression. It is tempting to speculate that
the decreased heme degradation may contribute in part
to the maintenance of the heme supply for hemoglobin
production in erythroid cells. In fact, it has been repor-
ted that chemically induced erythroid differentiation is
associated with a reduction of HO-1 expression in MEL
mouse erythroleukemia cells [32]. Moreover, heme indu-
ces the expression of the a-globin gene in K562 human
erythroleukemia cells [33] and the number of hemoglo-
bin-producing cells in YN-1 cells [27,34]. Conversely,
the deficiency of heme in erythroid cells causes differen-
tiation arrest in mice [35]. These results indicate that
heme is essential for differentiation of erythroid cells. In
this context, our preliminary data suggest that treatment
for 48 h under hypoxia may increase the proportion
of hemoglobin-positive YN-1 cells (from 4.4 ± 0.3%
under normoxia to 9.6 ± 1.0% under hypoxia) and
K562 cells (from 4.9 ± 0.7% to 6.9 ± 0.5%); this was
measured by staining cells with o-dianisidine. This
method was based on the peroxidase activity of hemo-
A
BC
Fig. 6. Effects of hypoxia on the stability of heme oxygenase (HO)-1 and HO-2 mRNAs. (A) Northern blot analysis. YN-1 cells were cultured
for 12 h under normoxia or hypoxia (1% oxygen), and then treated with or without actinomycin D (AMD) (1 lgÆmL
)1
) for the indicated num-
ber of hours. Each lane contains 15 lg of total RNA. The lane labeled 0 h contained RNA prepared from precultured cells harvested just
before the addition of actinomycin D (0 h). (B, C) Relative expression levels of HO-1 and HO-2 mRNA under normoxia or hypoxia. The inten-
sity representing HO-1 or HO-2 mRNA was normalized with respect to the intensity of b-actin mRNA. The intensity representing HO-1 or
HO-2 mRNA at the time of addition of actinomycin D (0 h) under each condition is considered to be 100%.
Y. Zhang et al. Reduced expression of heme oxygenase-2
FEBS Journal 273 (2006) 3136–3147 ª 2006 The Authors Journal compilation ª 2006 FEBS 3141
globin [36]. However, the increase in the hemoglobin-
positive cells could be a result of a hypoxia-mediated
increase of transferrin receptors [37] and ⁄ or erythroid-
specific 5-aminolevulinate synthase [30]. Further experi-
ments are required to address the role of heme degrada-
tion in the population of hemoglobin-positive cells.
To the best of our knowledge, there has been no
report on the promoter function of the human HO-2
Fig. 7. Characterization of the human heme oxygenase (HO)-2 gene promoter. (A) Identification of the transcription start sites. The upstream
region of the HO-2 gene is shown. Exon 1 encodes the untranslated region, and exon 2 encodes the protein-coding region (closed box),
including the ATG translation–initiation codon. The nucleotide sequences of the proximal promoter and exon 1 are shown. Major transcription
start sites, identified by 5¢-RACE, are indicated in bold. Residue 1 represents the 5¢ end of exon 1. A newly identified 5¢-untranslated region
is shown as a stippled box, and underlined is the exon 1 region (from 58 to 98), based on the NCBI Blast database (accession number
NT_010552). The 5¢ end of intron 1 is also shown in lower case. (B) Promoter activities of HO-1 and HO-2 genes under hypoxia. YN-1 cells
were transfected with each reporter construct and then incubated under normoxia or hypoxia for 48 h. The two constructs, named HRESV40
and N-HRESV40, represent positive and negative controls for hypoxia. Relative luciferase activity under normoxia or hypoxia is shown as the
ratio to the normalized luciferase activity obtained with pGL3-basic under normoxia or hypoxia, respectively. The data are means ± SEM of
three independent experiments; **P<0.01.
Reduced expression of heme oxygenase-2 Y. Zhang et al.
3142 FEBS Journal 273 (2006) 3136–3147 ª 2006 The Authors Journal compilation ª 2006 FEBS
gene. We have identified the multiple transcription initi-
ation sites of the HO-2 gene and confirmed that the
HO-2 gene promoter is juxtaposed to the HSCARG
gene in the opposite direction. Thus, the HO-2 gene and
the HSCARG gene share a common promoter region,
known as a bidirectional promoter. The bidirectional
promoters are sometimes found in mammalian genes,
and belong to the family of TATA-less and GC-rich
promoters [38,39]. Such features are consistent with the
HO-2 gene promoter. In the present study, hypoxia did
not influence the expression of a reporter gene, carrying
the 1.5 kb bidirectional promoter region. Taken
together with the shortened half-life of HO-2 mRNA
under hypoxia, we suggest that the reduced expression
of HO-2 mRNA may be achieved at least in part by
post-transcriptional mechanisms, such as enhanced deg-
radation of HO-2 mRNA. However, functional studies
with further upstream regions or downstream regions
including a large intron 1 of the HO-2 gene are required.
In summary, the present study has suggested that
the reduced expression of HO-2 protein may contrib-
ute to the maintenance of intracellular heme level in
certain human cell types under hypoxia.
Experimental procedures
Cell culture and hypoxia study
The human cell lines used were KG1 myeloid cells, K562
erythroid cells, and Jurkat T-lymphocyte cells and were
maintained in RPMI-1640 medium (Sigma, St Louis, MO,
USA). YN-1 human erythroid cells [27,34] were maintained
in Iscove’s Modified Dulbecco’s Medium (IMDM) (Sigma).
HeLa and HepG2 cells were maintained in DMEM. Each
medium contains 10% heat-inactivated FBS, penicillin G
(100 UÆmL
)1
), and streptomycin sulfate (100 lgÆmL
)1
). For
hypoxia experiments, cells were cultured for the indicated
time at 37 °C in a chamber with 5% CO
2
⁄ 94% N
2
⁄ 1% O
2
[13]. In some experiments, cells were incubated under mild
hypoxia (5% CO
2
⁄ 90% N
2
⁄ 5% O
2
). The cells were harves-
ted for total RNA extraction and protein extraction.
Northern blot analysis
Total RNA was extracted from cultured cells and subjected
to northern blot analysis, as detailed previously [16]. The
signals for HO-1, HO-2 and b-actin mRNA were detected
with the DIG Northern Starter Kit (Roche Diagnostics,
Mannheim, Germany) according to the manufacturer’s pro-
tocol. For preparation of HO-1 and HO-2 RNA probes,
the human HO-1 cDNA of positions 81–878 [6] (GenBank
accession number X06985) and the human HO-2 cDNA
fragment (nucleotide positions 85–939) [7,9] (GenBank
accession number P30519) were amplified by PCR using
Pfu Turbo DNA polymerase (Stratagene, La Jolla, CA,
USA), and then cloned into pCR-bluntII-TOPO (Invitro-
gen, Carlsbad, CA, USA), and named pCR-hHO1 and
pCR-hHO2, respectively. SP6 RNA polymerase was used
for transcription of RNA probe from pCR-hHO1 and
pCR-hHO2.
Western blot analysis
Harvested cells were lysed in the lysis buffer (20 mm Hepes
(pH 7.5), 150 mm NaCl, 1 mm EDTA, 0.01 mgÆmL
)1
apro-
tinin, 0.01 mgÆmL
)1
antipain, 0.01 mgÆmL
)1
pepstatin,
0.1 mgÆmL
)1
leupeptin, 1.0% Triton X-100, and 1 mm phe-
nylmethylsulfonyl fluoride), as detailed previously [9,16].
The cell lysates were centrifuged at 15 000 g for 10 min
(KUBOTA RA-50J1 fix-angle rotor, KUBOTA, Tokyo,
Japan), and the supernatant (10 mg of protein) was ana-
lyzed on a 10% SDS-polyacrylamide gel. The proteins in
the gel were electrophoretically transferred to a polyvinylid-
ene difluoride membrane (Immobilon-P, Millipore Corpora-
tion, Billerica, MA, USA). The membranes were treated for
1 h at room temperature (20–22 °C) with anti-HO-1 (a gift
from Shigeru Taketani) [40] or anti-HO-2 antibody (Stress-
gene Canada, Victoria, Canada). HO-1 and HO-2 proteins
were detected with ECL Plus western blot kit (Amersham
Biosciences, Piscataway, NJ, USA). Expression of a-tubulin
was examined as an internal control using a-tubulin mono-
clonal antibody (NeoMarkers, Fremont, CA, USA).
Assay for HO catalytic activity
YN-1, K562, HeLa and HepG2 cells (2 · 10
7
) were incuba-
ted for 48 h under normoxia or hypoxia (1% oxygen), and
harvested for the assay of HO activity, as described previ-
ously [2,41,42]. Cells were suspended in 2 mL of 20 mm
Fig. 8. Increased heme contents under hypoxia in YN-1, HepG2
and HeLa cells. YN-1, HepG2 and HeLa cells were cultured under
normoxia or hypoxia (1% oxygen) for 48 h, and cellular heme con-
tents were measured, as described in Experimental procedures.
The data are from three independent experiments. Asterisks repre-
sent statistically significant differences compared to normoxia con-
trol: *P<0.05; **P<0.01.
Y. Zhang et al. Reduced expression of heme oxygenase-2
FEBS Journal 273 (2006) 3136–3147 ª 2006 The Authors Journal compilation ª 2006 FEBS 3143
potassium phosphate buffer (KPB) (pH 7.4) containing
134 mm KCl, and disrupted by sonication. The microsome
fraction was prepared by two steps of centrifugation and
was suspended by sonication in 150 lLof50mm KPB con-
taining 0.1% Triton X-100. Each sample (300 lg of pro-
tein) was added to the standard reaction mixture of
200 lL, which contained 0.1 m KPB (pH 7.4), 15 l m
hemin, 100 lgÆmL
)1
BSA, 30 lg of biliverdin reductase,
and 15 lg of cytochrome P450 reductase. After 2 min of
preincubation at 37 °C, the reaction was started by addition
of 10 lL of NADPH (8.4 lgÆmL) or 10 lL of water as a
blank mixture. The reaction mixture was incubated at
37 °C for 20 min. After centrifugation, the supernatant was
used to measure the absorbance at 468 nm. The amounts
of bilirubin formed in the reaction system were calculated
using a value of 43.5 mm
)1
Æcm
)1
. HO activity was expressed
as nmol bilirubinÆmg protein
)1
Æh
)1
. YN-1 cells were also
treated with 5 lm CdCl
2
for 6 h as a positive control,
because CdCl
2
induced HO-1 expression [10,43].
Effects of actinomycin D on the expression of
HO-1 and HO-2 mRNA
To study the effects of hypoxia on the stability of HO-1
and HO-2 mRNA, YN-1 cells were incubated for 12 h in
fresh medium under normoxia or hypoxia, followed by
the addition of actinomycin D (1 lg Æ mL
)1
) (Calbiochem-
Behring, La Jolla, CA) [16,44]. The cells were further incu-
bated for 2, 6 or 12 h under normoxia or hypoxia, and then
harvested at each time point for RNA extraction.
Identification of 5¢ end of HO-2 mRNA and the
promoter region of the HO-2 gene
To amplify the 5¢ end of HO-2 cDNA, nested PCR was
carried out using the BD Marathon-Ready human testis
cDNA library (BD Biosciences Clontech, Palo Alto, CA,
USA) and FailSafe
TM
PCR PreMix Selection Kit (Epicen-
tre, Madison, WI). Human testis cDNA was used, because
HO-2 protein is enriched in the testis [21,45]. The sense
PCR primers were an adapter primer and its nested (down-
stream) primer, which is located upstream of the cDNA,
and the antisense primers for HO-2 cDNA were a gene-spe-
cific primer-1, 5¢-CAGGTCCAGGGCGTTCATCCTGGC
CCGG-3¢, located in exon-4, and its nested (upstream) pri-
mer, 5¢-CCCCCCGAGAGATCCCCCATGTAGCGGG-3¢,
located in exon-4. The two steps of PCR were performed
according to the supplier’s protocol. The nested PCR prod-
ucts, extracted from a gel by using MinElute
TM
Gel Extrac-
tion Kit (Qiagen, Tokyo, Japan), were cloned into pCR
Ò
II-
TOPO vector (Invitrogen). DNA sequencing analysis
(Applied Biosystems, Foster City, CA, USA) was
performed to confirm the nucleotide sequence. The
tfsearch program on the TRANSFAC databases [46] was
used to identify potential cis-elements in the 5¢-flanking
region of the HO-2 gene.
Luciferase reporter constructs
The 1.5 kb 5¢-flanking region of the HO-2 gene was ampli-
fied by PCR using human genomic DNA as a template and
a primer set designed from a published sequence (GenBank
accession number P30519) (sense, 5¢-AGATCTATCCCTT
GAGGCCTTGTCCGCTTG-3¢; antisense, 5¢-AAGCTTG
CC GCAGGTCGCTGTCGCCTG-3¢; these contain a BglII
site and a HindIII site, respectively). The genomic fragment
was cloned into the BglII ⁄ HindIII-digested pGL3-basic vec-
tor (Promega, Madison, WI, USA) containing luciferase as
a reporter gene. The cloned 1.5 kb promoter region was
used as a template to generate deletions in the HO-2 pro-
moter. All PCR products (1494, 663 and 25 bp) were puri-
fied and subcloned in the pGL3-basic vector, yielding
phHO2(-1492), phHO2(-663), and phHO2(-25). The identity
of each construct was confirmed by sequencing.
The human HO-1 gene–luciferase constructs, phHO-
LUC45 [16], phHOLUC40, and phHOLUC(-58) [47], carry
the 4.5 kb, 4.0 kb and 58 bp fragments of the human HO-1
gene [10,48], respectively. Reporter plasmids, HRESV40
containing four copies of HRE and NHRESV40 lacking
HRE [49], were used as a positive and a negative control
for hypoxia, respectively.
Transient transfection assays
Transfection was performed with DMRIE-C reagent (Invi-
trogen), following the supplier’s protocol. YN-1 cells
(4 · 10
5
) were cotransfected with each promoter–reporter
fusion plasmid (0.784 lg) and pRL-TK vector (16 ng)
(Promega), and incubated for 4.5 h. Then, the transfected
YN-1 cells were incubated for 48 h under normoxia or hyp-
oxia (1% oxygen), and harvested. Luciferase activity was
measured with a luminometer using the Dual Luciferase
Assay System (Promega), as detailed previously [14,16]. A
promoterless construct, pGL3-basic, was used as a control.
The data are means ± SEM of three independent experi-
ments with each plasmid DNA preparation.
Fluorometric assay of heme
Heme contents in cells (expressed as ng per 10
6
cells) were
determined as described previously [50]. Cell suspensions
were centrifuged at 800 g for 5 min at 4 °C using an
Eppendorf 5415 R benchtop refrigerated centrifuge (rotor
type fix-angle rotor 1-16, 100 · g; Eppendorf AG, Ham-
burg, Germany), and 0.5 mL of 2 m oxalic acid was added
to the pellet. The mixtures were shaken vigorously and
immediately heated for 30 min at 100 °C. The mixtures
without heating were used as a blank for measurement of
Reduced expression of heme oxygenase-2 Y. Zhang et al.
3144 FEBS Journal 273 (2006) 3136–3147 ª 2006 The Authors Journal compilation ª 2006 FEBS
endogenous porphyrins. After cooling, fluorescence was
determined in an RF-5300PC spectrofluorometer (Shimadzu
Corp., Kyoto, Japan). The excitation wavelength was
400 nm, and the fluorescence emission was determined at
662 nm. Hemin solutions, containing 0, 1, 10, 50 or 100 ng
of hemin, were prepared in 0.5 mL of oxalic acid, and used
as standards. In all assays, 1 · 10
6
cells were used to deter-
mine heme contents.
Acknowledgements
We thank S. Taketani for anti-HO-1 and Y. Fujii-
Kuriyama for the HRE constructs. This study was
supported by Grants-in-aid for Scientific Research (B),
for Scientific Research on Priority Areas, and by the
21st Century COE Program Special Research Grant,
the Center for Innovative Therapeutic Development
for Common Diseases, from the Ministry of Educa-
tion, Science, Sports, and Culture of Japan. This study
was also supported by a grant provided by the Uehara
Memorial Foundation.
References
1 Tenhunen R, Marver HS & Schmid R (1968) The enzy-
matic conversion of heme to bilirubin by microsomal
heme oxygenase. Proc Natl Acad Sci USA 61, 748–755.
2 Yoshida T & Kikuchi G (1978) Features of the reaction
of heme degradation catalyzed by the reconstituted
microsomal heme oxygenase system. J Biol Chem 253 ,
4230–4236.
3 Shibahara S, Muller R, Taguchi H & Yoshida T (1985)
Cloning and expression of cDNA for rat heme oxyge-
nase. Proc Natl Acad Sci USA 82, 7865–7869.
4 Maines MD, Trakshel GM & Kutty RK (1986) Char-
acterization of two constitutive forms of rat liver
microsomal heme oxygenase. Only one molecular spe-
cies of the enzyme is inducible. J Biol Chem 261,
411–419.
5 Shibahara S (2003) The heme oxygenase dilemma in
cellular homeostasis: new insights for the feedback regu-
lation of heme catabolism. Tohoku J Exp Med 200,
167–186.
6 Yoshida T, Biro P, Cohen T, Muller RM & Shibahara
S (1988) Human heme oxygenase cDNA and induction
of its mRNA by hemin. Eur J Biochem 171, 457–461.
7 Ishikawa K, Takeuchi N, Takahashi S, Matera KM,
Sato M, Shibahara S, Rousseau DL, Ikeda-Saito M &
Yoshida T (1995) Heme oxygenase-2. Properties of the
heme complex of the purified tryptic fragment of recom-
binant human heme oxygenase-2. J Biol Chem 270,
6345–6350.
8 McCoubrey WK, Huang TJ & Maines MD (1997)
Heme oxygenase-2 is a hemoprotein and binds heme
through heme regulatory motifs that are not involved in
heme catalysis. J Biol Chem 272, 12568–12574.
9 Shibahara S, Yoshizawa M, Suzuki H, Takeda K,
Meguro K & Endo K (1993) Functional analysis of
cDNAs for two types of human heme oxygenase and
evidence for their separate regulation. J Biochem
(Tokyo) 113, 214–218.
10 Takeda K, Ishizawa S, Sato M, Yoshida T & Shibahara
S (1994) Identification of a cis-acting element that is
responsible for cadmium-mediated induction of the
human heme oxygenase gene. J Biol Chem 269, 22858–
22867.
11 Takahashi K, Hara E, Suzuki H, Sasano H & Shiba-
hara S (1996) Expression of heme oxygenase isozyme
mRNAs in the human brain and induction of heme
oxygenase-1 by nitric oxide donors. J Neurochem 67,
482–489.
12 Takahashi K, Hara E, Ogawa K, Kimura D, Fujita H
& Shibahara S (1997) Possible implications of the induc-
tion of human heme oxygenase-1 by nitric oxide donors.
J Biochem (Tokyo) 121, 1162–1168.
13 Nakayama M, Takahashi K, Kitamuro T, Yasumoto
K, Katayose D, Shirato K, Fujii-Kuriyama Y & Shiba-
hara S (2000) Repression of heme oxygenase-1 by
hypoxia in vascular endothelial cells. Biochem Biophys
Res Commun 271, 665–671.
14 Kitamuro T, Takahashi K, Ogawa K, Udono-Fujimori
R, Takeda K, Furuyama K, Nakayama M, Sun J, Fuj-
ita H, Hida W et al. (2003) Bach1 functions as a hypo-
xia-inducible repressor for the heme oxygenase-1 gene in
human cells. J Biol Chem 278, 9125–9133.
15 Panchenko MV, Farber HW & Korn JH (2000) Induc-
tion of heme oxygenase-1 by hypoxia and free radicals
in human dermal fibroblasts. Am J Physiol Cell Physiol
278, C92–C101.
16 Udono-Fujimori R, Takahashi K, Takeda K, Furuyama
K, Kaneko K, Takahashi S, Tamai M & Shibahara S
(2004) Expression of heme oxygenase-1 is repressed by
interferon-gamma and induced by hypoxia in human
retinal pigment epithelial cells. Eur J Biochem 271,
3076–3084.
17 Zenclussen AC, Lim E, Knoeller S, Knackstedt M, Her-
twig K, Hagen E, Klapp BF & Arck PC (2003) Heme
oxygenases in pregnancy II: HO-2 is downregulated in
human pathologic pregnancies. Am J Reprod Immunol
50, 66–76.
18 Lash GE, McLaughlin BE, MacDonald-Goodfellow
SK, Smith GN, Brien JF, Marks GS, Nakatsu K &
Graham CH (2003) Relationship between tissue damage
and heme oxygenase expression in chorionic villi of term
human placenta. Am J Physiol Heart Circ Physiol 284,
H160–H167.
19 Appleton SD, Marks GS, Nakatsu K, Brien JF, Smith
GN, Graham CH & Lash GE (2003) Effects of hypoxia
on heme oxygenase expression in human chorionic villi
Y. Zhang et al. Reduced expression of heme oxygenase-2
FEBS Journal 273 (2006) 3136–3147 ª 2006 The Authors Journal compilation ª 2006 FEBS 3145
explants and immortalized trophoblast cells. Am J Phy-
siol Heart Circ Physiol 284, H853–H858.
20 Poss KD, Thomas MJ, Ebralidze AK, O’Dell TJ &
Tonegawa S (1995) Hippocampal long-term potentiation
is normal in heme oxygenase-2 mutant mice. Neuron 15,
867–873.
21 Adachi T, Ishikawa K, Hida W, Matsumoto H,
Masuda T, Date F, Ogawa K, Takeda K, Furuyama K,
Zhang Y et al. (2004) Hypoxemia and blunted hypoxic
ventilatory responses in mice lacking heme oxygenase-2.
Biochem Biophys Res Commun 320, 514–522.
22 Williams SE, Wootton P, Mason HS, Bould J, Iles DE,
Riccardi D, Peers C & Kemp PJ (2004) Hemoxygenase-
2 is an oxygen sensor for a calcium-sensitive potassium
channel. Science 306, 2093–2097.
23 Katayose D, Ohe M, Yamauchi K, Ogata M, Shirato
K, Fujita H, Shibahara S & Takishima T (1993)
Increased expression of PDGF A- and B-chain genes
in rat lungs with hypoxic pulmonary hypertension.
Am J Physiol 264 (Lung Cell Mol Physiol 8), L100–
L106.
24 Katayose D, Isoyama S, Fujita H & Shibahara S (1993)
Separate regulation of heme oxygenase and heat shock
protein 70 mRNA expression in the rat heart by hemo-
dynamic stress. Biochem Biophys Res Commun 191, 587–
594.
25 Takemura H, Hida W, Sasaki T, Sugawara T & Sen T
(2005) Prevalence of chronic obstructive pulmonary dis-
ease in Japanese people on medical check-up. Tohoku J
Exp Med 207, 41–50.
26 Han F, Takeda K, Yokoyama S, Ueda H, Shinozawa
Y, Furuyama K & Shibahara S (2005) Dynamic changes
in expression of heme oxygenases in mouse heart and
liver during hypoxia. Biochem Biophys Res Commun
338, 653–659.
27 Endo K, Harigae H, Nagai T, Fujie H, Meguro K,
Watanabe N, Furuyama K, Kameoka J, Okuda M &
Hayashi N (1993) Two chronic myelogenous leukaemia
cell lines which represent different stages of erythroid
differentiation. Br J Haematol 85, 653–662.
28 Sato M, Ishizawa S, Yoshida T & Shibahara S (1990)
Interaction of upstream stimulatory factor with the
human heme oxygenase gene promoter. Eur J Biochem
188, 231–237.
29 Newby D, Cousins F, Myatt L & Lyall F (2005) Heme
oxygenase expression in cultured human trophoblast
cells during in vitro differentiation: effects of hypoxia.
Placenta 26, 201–209.
30 Hofer T, Wenger RH, Kramer Ferreira GC & Gass-
mann M (2003) Hypoxic up-regulation of erythroid
5-aminolevulinate synthase. Blood 101, 348–350.
31 Taketani S (2005) Aquisition, mobilization and utiliza-
tion of cellular iron and heme: endless findings and
growing evidence of tight regulation. Tohoku J Exp
Med 205, 297–318.
32 Fujita H & Sassa S (1989) The rapid and decremental
change in haem oxygenase mRNA during erythroid
differentiation of murine erythroleukaemia cells. Br J
Haematol 73, 557–560.
33 Tahara T, Sun J, Igarashi K & Taketani S (2004)
Heme-dependent up-regulation of the alpha-globin gene
expression by transcriptional repressor Bach1 in ery-
throid cells. Biochem Biophys Res Commun 324, 77–85.
34 Nagai T, Harigae H, Furuyama K, Munakata H, Haya-
shi N, Endo K, Sassa S & Yamamoto M (1997) 5-Ami-
nolevulinate synthase expression and hemoglobin
synthesis in a human myelogenous leukemia cell line.
J Biochem (Tokyo) 121, 487–495.
35 Nakajima O, Takahashi S, Harigae H, Furuyama K,
Hayashi N, Sassa S & Yamamoto M (1999) Heme defi-
ciency in erythroid lineage causes differentiation arrest
and cytoplasmic iron overload. EMBO J 18, 6282–6289.
36 Guimaraes JE, Berney JJ, Francis GE & Hoffbrand AV
(1984) The identification of mixed granulocytic–erythro-
cytic colonies in vitro. Exp Hematol 12, 535–538.
37 Tacchini L, Bianchi L, Bernelli-Zazzera A & Cairo G
(1999) Transferrin receptor induction by hypoxia. HIF-
1-mediated transcriptional activation and cell-specific
post-transcriptional regulation. J Biol Chem 274, 24142–
24146.
38 Koyanagi KO, Hagiwara M, Itoh T, Gojobori T &
Imanishi T (2005) Comparative genomics of bidirectional
gene pairs and its implications for the evolution of a tran-
scriptional regulation system. Gene 353, 169–176.
39 Adachi N & Lieber MR (2002) Bidirectional gene orga-
nization: a common architectural feature of the human
genome. Cell 109, 807–809.
40 Masuya Y, Hioki K, Tokunaga R & Taketani S (1998)
Involvement of the tyrosine phosphorylation pathway in
induction of human heme oxygenase-1 by hemin,
sodium arsenite, and cadmium chloride. J Biochem
(Tokyo) 124, 628–633.
41 Yoshida T & Kikuchi G (1978) Purification and proper-
ties of heme oxygenase from pig spleen microsomes.
J Biol Chem 253, 4224–4229.
42 Shibahara S, Yoshida T & Kikuchi G (1978) Induction
of heme oxygenase by hemin in cultured pig alveolar
macrophages. Arch Biochem Biophys 188, 243–250.
43 Okinaga S, Takahashi K, Takeda K, Yoshizawa M,
Fujita H, Sasaki H & Shibahara S (1996) Regulation of
human heme oxygenase-1 gene expression under thermal
stress. Blood 87, 5074–5084.
44 Shibahara S, Muller RM & Taguchi H (1987) Tran-
scriptional control of rat heme oxygenase by heat shock.
J Biol Chem 262, 12889–12892.
45 Trakshel GM & Maines MD (1988) Detection of two
heme oxygenase isoforms in the human testis. Biochem
Biophys Res Commun 154, 285–291.
46 Heinemeyer T, Wingender E, Reuter I, Hermjakob H,
Kel AE, Kel OV, Ignatieva EV, Ananko EA, Podkolod-
Reduced expression of heme oxygenase-2 Y. Zhang et al.
3146 FEBS Journal 273 (2006) 3136–3147 ª 2006 The Authors Journal compilation ª 2006 FEBS
naya OA, Kolpakov FA et al. (1998) Databases on
transcriptional regulation: TRANSFAC, TRRD and
COMPEL. Nucleic Acids Res 26, 362–367.
47 Takahashi S, Takahashi Y, Ito K, Nagano T,
Shibahara S & Miura T (1999) Positive and negative
regulation of the human heme oxygenase-1 gene expres-
sion in cultured cells. Biochim Biophys Acta 1447, 231–
235.
48 Shibahara S, Sato M, Muller RM & Yoshida T (1989)
Structural organization of the human heme oxygenase
gene and the function of its promoter. Eur J Biochem
179, 557–563.
49 Ema M, Taya S, Yokotani N, Sogawa K, Matsuda Y &
Fujii-Kuriyama Y (1997) A novel bHLH-PAS factor
with close sequence similarity to hypoxia-inducible fac-
tor 1alpha regulates the VEGF expression and is poten-
tially involved in lung and vascular development. Proc
Natl Acad Sci USA 94, 4273–4278.
50 Sassa S (1976) Sequential induction of heme pathway
enzymes during erythroid differentiation of mouse
Friend leukemia virus-infected cells. J Exp Med 143,
305–315.
Y. Zhang et al. Reduced expression of heme oxygenase-2
FEBS Journal 273 (2006) 3136–3147 ª 2006 The Authors Journal compilation ª 2006 FEBS 3147