Tài liệu Báo cáo khoa học: Steady-state kinetic behaviour of functioning-dependent structures docx
Bạn đang xem bản rút gọn của tài liệu. Xem và tải ngay bản đầy đủ của tài liệu tại đây (754.69 KB, 13 trang )
Steady-state kinetic behaviour of functioning-dependent
structures
Michel Thellier1,3, Guillaume Legent1, Patrick Amar2,3, Vic Norris1,3 and Camille Ripoll1,3
´
´
´
´
1 Laboratoire ‘Assemblages moleculaires: modelisation et imagerie SIMS’, Faculte des Sciences de l’Universite de Rouen,
Mont-Saint-Aignan Cedex, France
´
2 Laboratoire de recherche en informatique, Universite de Paris Sud, Orsay Cedex, France
3 Epigenomics Project, GenopoleÒ, Evry, France
Keywords
enzyme kinetics; metabolic or signalling
pathways; mathematical modelling; protein
associations
Correspondence
M. Thellier, Laboratoire Assemblages
´
´
moleculaires: modelisation et imagerie SIMS
´
FRE CNRS 2829, Faculte des Sciences de
´
l’Universite de Rouen, F-76821 Mont-SaintAignan Cedex, France
Fax: +33 2 35 14 70 20
Tel: +33 2 35 14 66 82
E-mail:
(Received 12 January 2006, revised 26 June
2006, accepted 20 July 2006)
A fundamental problem in biochemistry is that of the nature of the
coordination between and within metabolic and signalling pathways. It is
conceivable that this coordination might be assured by what we term functioning-dependent structures (FDSs), namely those assemblies of proteins
that associate with one another when performing tasks and that disassociate when no longer performing them. To investigate a role in coordination
for FDSs, we have studied numerically the steady-state kinetics of a model
system of two sequential monomeric enzymes, E1 and E2. Our calculations
show that such FDSs can display kinetic properties that the individual
enzymes cannot. These include the full range of basic input ⁄ output characteristics found in electronic circuits such as linearity, invariance, pulsing
and switching. Hence, FDSs can generate kinetics that might regulate and
coordinate metabolism and signalling. Finally, we suggest that the occurrence of terms representative of the assembly and disassembly of FDSs in
the classical expression of the density of entropy production are characteristic of living systems.
doi:10.1111/j.1742-4658.2006.05425.x
Numerous studies have shown that proteins involved
in metabolic or signalling pathways are often distributed nonrandomly, as multimolecular assemblies
[1–15]. Such assemblies range from quasi-static, multienzyme complexes (such as the fatty acid synthase or
the a-oxo acid dehydrogenase systems [5]) to transient,
dynamic protein associations [2,3,7,15,16]. Comparison
of yeast and human multiprotein complexes has shown
that conservation across species extends from single
proteins to protein assemblies [11]. Multi-molecular
assemblies may comprise proteins but also nucleic
acids, lipids, small molecules and inorganic ions. Such
assemblies may interact with membranes, skeletal elements and ⁄ or cell organelles [3,4,15,17]. They have
been termed metabolons, transducons and repairosomes in the case of metabolic pathways [3,10,18–23],
signal transduction [24] and DNA repair [12], respectively, or, more generally, hyperstructures [17,25–28].
According to Srere [3], metabolons are enzyme
assemblies in which intermediates are channelled from
each enzyme to the next without diffusion of these
intermediates into the surrounding cytoplasm [2–
7,9,15,23,29–33]. Potential advantages of channelling
[7,9,15,30,31,34,35] are (i) reduction in the size of the
pools of intermediates (a point, however, contested by
some authors [36,37]), (ii) protection of unstable or
scarce intermediates by maintaining them in a proteinbound state, (iii) avoidance of an ‘underground’ metabolism in which intermediates become the substrates of
other enzymes [38], and (iv) protection of the cytoplasm
from toxic or very reactive intermediates. The terms static and dynamic channelling have been used to describe,
respectively, the channelling in a quasipermanent metabolon and in a transient association between two
enzymes occurring while the intermediate metabolite is
transferred from the first enzyme to the second [39,40].
Abbreviation
FDS, functioning-dependent structure.
FEBS Journal 273 (2006) 4287–4299 ª 2006 The Authors Journal compilation ª 2006 FEBS
4287
Functioning-dependent structures
M. Thellier et al.
We propose here to generalize the concept of dynamic
channelling or, more precisely, the concept of a structure that dynamically and transiently forms to carry out
a process, into that of functioning-dependent structure
(FDS) [41]. In other words, an FDS is a dynamic, multimolecular structure that assembles when functioning
and that disassembles when no longer functioning, and
thus is created and maintained by the very fact that it is
in the process of accomplishing a task. The lifetime of
such a structure may be short or long, depending only
on the duration of the process that is catalysed by the
FDS. An FDS catalyses efficiently the processes that
have allowed this FDS to form. It can therefore be
viewed as a self-organized structure.
Published examples of transient, dynamic multimolecular assemblies, that only form in an activitydependent manner include: the role of the bifunctional
protein complex cysteine synthetase in the synthesis of
cysteine in Salmonella typhimurium [42]; the metabolite-modulated formation of complexes (especially
binary complexes) of sequential glycolytic enzymes
[4,43,44]; the functional coupling of pyruvate kinase
and creatine kinase via an enzyme–product–enzyme
complex in muscle [45]; the interaction between serine
acetyl-transferase and O-acetylserine(thiol)-lyase in
higher plants [46,47]; the ATP- and pH-dependent
association ⁄ dissociation of the V1 and V0 domains of
the yeast vacuolar H+- ATPases [48–50]; the promotion by substrate binding of the assembly of the three
components of protein-mediated exporters involved in
protein secretion in Gram-negative bacteria [51]; the
first step of glycogenolysis in vertebrate muscle tissues
by the sequential formation of a phosphorylase–glycogen complex followed by the binding of phosphorylase
kinase to this previously formed complex [18]; the clustering of the anchoring protein gephyrin with glycine
receptors following glycine receptor activation in
postsynaptic regions of spinal neurons [52–55]; the
clustering of antigen receptors followed by binding of
intracellular proteins, such as protein tyrosine kinases,
to the cytoplasmic portion of the receptors in the case
of signalling through lymphocyte receptors (reviewed
in [56]); the organization of functional rafts in the
plasma membrane upon T-cell activation [57]; the glycine decarboxylase complex in higher plants [58]; the
assembly of water-soluble, cytosolic proteins with the
membrane-anchored flavocytochrome b558 for the catalysis of the NADPH-dependent reduction of O2 into
the superoxide anion O2– in stimulated phagocytic cells
[59]; the dynamic association of HSP90 with the
RPM1 disease resistance protein in the response of
Arabidopsis plants to infection by Pseudomonas syringae [60]; the association of protein complexes with
4288
assembling actin molecules in the lamellipodium tip of
moving cells [61]; the clustering of glutamate receptors
opposite the largest and most physiologically active
sites of presynaptic release [62]; the differential nucleotide-dependent binding of Bfp proteins in the transduction of mechanical energy to the biogenesis machine of
Escherichia coli [63]. Even the Golgi apparatus of Saccharomyces cerevisiae can be viewed as a dynamic
structure with a size that depends on its functioning
such that it grows when it is secreting and shrinks
when it is not [64–67].
It is striking that these cellular systems that have
very different structures and functions nevertheless
exhibit the common behaviour of assembling into transient complexes or FDSs when functioning. Why? A
fundamental problem in biochemistry is that of coordination. The functioning of a protein in a metabolic or
signalling pathway in vivo is coordinated with that of
the other proteins in the same pathway, and the functioning of the pathway itself is coordinated with that
of the other pathways within the cell. In metabolic
pathways, the regulation needed for such coordination
comes in part from the sigmoidal kinetics provided by
allosteric enzymes, due to the fact that subunit–subunit
interactions are added to the classical enzyme–substrate interactions [68]. It is therefore tempting to speculate that FDSs are involved in the coordination
within and between metabolism and signalling.
If FDSs are to have a central role in coordination,
they should be predicted to generate regulatory kinetics via the enzyme–enzyme interactions that constitute
them. In the following, we have endeavoured to test
this prediction by numerically studying the steady-state
kinetics of a model system of two sequential monomeric enzymes, E1 and E2, which, when free, are of the
Michaelis–Menten type (i.e., with a single substratebinding site and no regulatory site). Our results show
that the metabolite-induced association of these two
enzymes into an FDS [20] may, under steady-state conditions, confer to the FDS basic regulatory kinetic features, that the individual enzymes lack. These include
the full range of input ⁄ output characteristics found in
electronic circuits such as a linear relationship between
input and output, an output limited to a narrow range
of inputs, a constant output whatever the input, and
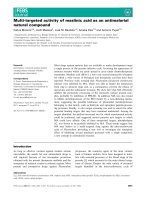
even switch-like behaviours (Fig. 1). Hence a metabolite-induced FDS could generate a wide variety of kinetics that could serve as signals.
Modelling a two-enzyme FDS
The different substances and reactions that can possibly
take place when an FDS is involved in the overall trans-
FEBS Journal 273 (2006) 4287–4299 ª 2006 The Authors Journal compilation ª 2006 FEBS
M. Thellier et al.
Functioning-dependent structures
output
A
B
output
input
input
output
C
D
output
(b)
(a)
input
input
Fig. 1. Classical input ⁄ output relationships in electrical circuits. (A) Linear response: this behaviour is obtained when a generator is connected to a load (resistor). (B) Constant response: this behaviour is obtained when a source of current is connected to a load; whatever the
value of the load, and therefore whatever the value of the potential difference, the current is unchanged. (C) Impulse response: the output
is non-null only for a particular value (or a narrow range of values) of the input. (D) curve (a): Step response: this behaviour corresponds to a
switch from low or null current to high current when the potential difference exceeds a threshold; curve (b): Inverse step response: this
behaviour corresponds to a switch from high current to low or null current when the potential difference exceeds a threshold.
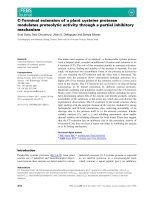
formation of an initial substrate, S1, into a final product, S3, via reactions catalysed by two enzymes, E1 and
E2, are represented in Fig. 2. In total, 29 reactions act
on 17 substances (free substances and complexes) and,
to account for a formation of the FDS solely dependent
on its activity, the reaction E1+E2 ¼ E1E2 does not
exist in this scheme. Note that the symbols used in
Fig. 2 to describe the complexes are such that E1S2E2
and E1E2S2 mean that S2 is bound to the catalytic site
of E1 or of E2, respectively, within the FDS, etc. To
write down the steady-state conditions of functioning of
the system (further details given in Appendix), (i) we
assume that external mechanisms supply S1 and remove
S3 as and when they are consumed and produced,
respectively, such that S1 is maintained at a constant
concentration and S3 at a zero concentration, and (ii)
we use the set of algebraic equations obtained by writing down the mass balance of the 15 other species
involved. For convenience, we have reasoned using dimensionless variables (note that capital letters are used
for chemical species and small letters for dimensionless
concentrations). We have also taken into account the
fact that the law of mass action has to be satisfied whatever the pathway from S1 to S3. When all calculations
are carried out for any given value of the concentration,
s1, of S1, the steady-state rate of transformation of S1
into S3 is calculated as corresponding to both the rate
of consumption of S1, v(s1), and the rate of production
of S3, v(s3), and the shape of the curves {s1, v(s1)} is
examined in cases involving either free enzymes alone
or an FDS with free enzymes.
It is worth noting that it would only be necessary to
add a few more reactions to Fig. 2 to describe the
interaction of these enzymes with other proteins or
molecules and hence study systems in which, for example, small proteins contribute to the formation of the
enzyme–enzyme complexes [15]; the theoretical treatment would be longer but otherwise essentially the
same as that followed here.
Results
Kinetics of the overall reaction of transformation
of S1 into S3
The system with only the free enzymes, E1 and E2
The overall rate of functioning of two free sequential
enzymes of the Michaelis–Menten type involved in a
metabolic pathway has already been computed as a
function of the concentration of initial substrate under
FEBS Journal 273 (2006) 4287–4299 ª 2006 The Authors Journal compilation ª 2006 FEBS
4289
Functioning-dependent structures
M. Thellier et al.
Fig. 2. The scheme of the reactions
involved in the functioning of our model of a
two-enzyme FDS. The system comprises 17
different chemical species (free enzymes,
free substrates or products, and binary,
ternary or quaternary complexes) indicated
in the green circles. These species are
linked to one another by 29 chemical reactions numbered R1 to R29 as indicated in
the rectangles.
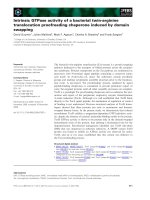
steady-state conditions [69]. The results are summarized
in Fig. 3A. Briefly, curves monotonically increasing up
to a plateau and exhibiting no inflexion points were
obtained for all parameter values tested. Occasionally,
the shape of these curves was close to that of a hyperbola. Cases existed (with the smallest K2 values in
Fig. 3A) in which the overall rate of reaction became a
quasi-linear function of the concentration of initial substrate, s1, almost up to the plateau (which never occurs
when a single enzyme is involved). Hence, under certain
conditions, free enzymes can generate signals or other
behaviours corresponding to a linear relationship
between input (concentration of first substrate) and
output (rate of production of final product) (Fig. 1A).
The system with an FDS
At some parameter values, in the case of an FDS, the
{s1, v(s1)} curves were similar to those obtained with
the free enzymes, i.e., they increased monotonically
without an inflexion point up to a plateau and sometimes exhibited an extended linear response with v(s1)
proportional to s1 over a large range of s1 values
(Fig. 3B, curves c and d). However, at other parameter
values, the {s1, v(s1)} curves exhibited a variety of
forms that were not found with the free enzymes. For
instance, in Fig. 3B, the curves (a) and (b) exhibited
substrate-inhibition behaviour, i.e., with increasing s1,
the rate of consumption of S1 initially increased then,
after reaching a maximal value, decreased.
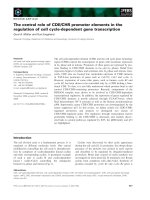
The occurrence of {s1, v(s1)} curves with a substrateinhibition shape was examined further (Fig. 4). At
some parameter values, with increasing s1, the rate of
4290
consumption of S1 decreased to almost zero (Fig. 4A).
This means that this FDS system exhibited a sort of
inversed behaviour in which it was active at low s1 values (except at the very lowest s1 values) and inactive at
the high s1 values. This corresponds to the scenario in
Fig. 1C in which an increasing input leads to an
output in the form of a spike or impulse. Another case
in which an increasing input leads to an output in the
form of an impulse (i.e., corresponding to the scenario
in Fig. 1C) is depicted in Fig. 4B.
At other values of the parameters, with increasing
s1, the rate of consumption of S1 again increased,
reached a maximal value, then decreased, whilst at saturating values of s1 the rate of consumption of S1
reached a plateau (instead of decreasing to zero)
(Fig. 4C). Moreover, at the largest K1 values (K1 ¼
104), the rate of consumption of S1 almost immediately
reached the plateau (Fig. 4C, curve d), which means
that the response of the system became effectively
independent of s1 (except again at the very lowest s1
values). This corresponds to the scenario in Fig. 1B in
which the output is independent of the input.
A curve is shown (Fig. 4D) that over a wide range
of low values of s1 has a relatively constant and high
rate of consumption of S1 but that with higher values
of s1 drops rapidly to a constant and low rate of consumption. This resembles the switch shown in Fig. 1D
curve (b).
Curves with a sigmoid shape, i.e., resembling the
switch shown in Fig. 1D curve (a), were sometimes
obtained (Fig. 5A). At the parameter values tested,
however, the adjustment of the curve to a Hill function
v(s1) ¼ vmaxỈ(s1)n ⁄ [(k)n+(s1)n] (in which n is the Hill
FEBS Journal 273 (2006) 4287–4299 ª 2006 The Authors Journal compilation ª 2006 FEBS
M. Thellier et al.
Functioning-dependent structures
v(s1)
v(s1)
0.2
0.18
d
e
d
b
c
0.1
c
b
0.12
a
a
0.06
A
B
0
0
0
0.01
0.02
0
s1
0.05
0.1
s1
Fig. 3. Examples of computed {s1, v(s1)} curves. (A) Case of a system made of two free enzymes: the parameter values are e1t ¼ e2t ¼ 0.5,
K ¼ 100, k1r ¼ 1 (Eqn A6), k2r ¼ 100, k3r ¼ k4r ¼ k9r ¼ k10r ¼ 1, k4f calculated according to Eqn (A25), K1 ¼ 10, K3 ¼ 100, K9 ¼ K10 ¼ 1 and
K2 ¼ 0.10 (curve a), 0.05 (curve b), 0.01 (curve c), 0.001 (curve d) and 0.0001 (curve e). Modified from [69]. (B) Case of a two-enzyme FDS:
the parameter values are e1t ¼ e2t ¼ 0.5, K ¼ 100, k1r ¼ 1 (Eqn A6), k2r ¼ 100, k3r ¼ k4r ¼ k5r ¼ k6r ¼ k7r ¼ k8r ¼ k9r ¼ k10r ¼ k11r ¼
k12r ¼ k13r ¼ k14r ¼ k15r ¼ k16r ¼ k17r ¼ k18r ¼ k19r ¼ k20r ¼ k21r ¼ k22r ¼ k23r ¼ k24r ¼ k25r ¼ k26r ¼ k27r ¼ k28r ¼ k29r ¼ 1, K1 ¼ 10, K2 ¼
0.01, K5 ¼ 1000, K3 ¼ K10 ¼ K11 ¼ K12 ¼ K13 ¼ K15 ¼ K17 ¼ K29 ¼ 1, K27 ¼ 100, K9 ¼ 10 (curve a), 102 (curve b), 103 (curve c), 104 (curve
d) and all the other Kj calculated as indicated in Eqns (A25) to (A27) and Table A2.
coefficient, vmax is the maximal rate of reaction and k
is the value of s1 that gives v(s1) ¼ 0.5Ỉvmax) was not
entirely satisfactory because a perfect straight line was
not obtained (r2 ¼ 0.985) when using the Hill system
of coordinates, {log s1, log [v(s1) ⁄ (vmax–v(s1))]}
(Fig. 5B); moreover, the sigmoidicity was rather weak
(Hill coefficient equal to only 1.47).
There were cases in which even more complicated
responses occurred. For example, in Fig. 6 in which
K10 was varied from 1 to 103 and in which all the
other parameters have the values given in the figure
caption, a {s1, v(s1)} curve similar to those in Fig. 4C
and with a low plateau value was observed with the
smallest K10 values (Fig. 6, curve a) while the substrate-inhibition effect was less and the plateau was
higher with increasing K10 values (Fig. 6, curve b).
Finally, with the highest values of K10 (Fig. 6, curves c
and d), the {s1, v(s1)} curves increased monotonically
to a plateau but with two inflexion points that conferred on them a dual-phasic aspect. Dual-phasic kinetic curves are often exhibited by both natural and
artificial enzymatic and transport systems [70–72];
although the functional advantage of such kinetics is
not clear, it is interesting that this complex behaviour
can be revealed by an FDS with as few as two
enzymes.
Discussion
The consequences of channelling on metabolism have
been extensively explored by modelling. In channelling,
the intermediate metabolites are confined to very small
volumes within a metabolon and have short half-lives.
It may therefore be invalid to assume that the local
statistical distribution of any molecule is Poissonian
and therefore that the classical macroscopic law of
kinetics can be used to describe the reaction rates
[29,73–75]. Indeed, certain models based on this invalid
assumption may even lead to an apparent violation of
the second law of thermodynamics [73]. The model
developed here is based on the classical macroscopic
laws of kinetics but, importantly, is self-consistent in
the sense that it uses the same assumptions to determine and compare the kinetics of two enzymes freely
diffusing or assembled into a FDS.
Numerous command or control devices used in
engineering are made from elements with input ⁄ output functions as shown in Fig. 1. In electronics,
these functions include the linear function obtained
when a source of potential difference is connected to
a resistor (Fig. 1A), the constant function obtained
when a current source is connected to a resistor
(Fig. 1B), the impulse function (Fig. 1C) and the
increasing (Fig. 1D, curve a) or decreasing (Fig. 1D,
curve b) step function. We have shown here that the
assembly of only two enzymes can result in a variety
of input ⁄ output relationships including, importantly,
those with characteristics similar to these basic functions. Hence, the assembly of just two enzymes could
provide a macromolecular mechanism for control
processes. This is illustrated by the following examples. The substrate concentration could be encoded
in a linear response (Fig. 1A). (Note that we occasionally obtained linear responses from a system of
FEBS Journal 273 (2006) 4287–4299 ª 2006 The Authors Journal compilation ª 2006 FEBS
4291
Functioning-dependent structures
M. Thellier et al.
v(s1)
v(s1)
0.04
0.0008
B
A
0.0004
0.02
0.0000
0
0.05
s1
0.1
0
0
v(s1)
0.08
s10.1
v(s1)
a
b
0.04
0 . 05
C
c
0.02
D
0.01
d
0
0
0.02
0.04
s1
0
0
0 .0 5
s10.1
Fig. 4. Various types of substrate-inhibition {s1, v(s1)} curves computed in the case of a two-enzyme FDS. (A) Example of an almost total inhibition at high s1 values (impulse behaviour): the parameter values are e1t ¼ e2t ¼ 0.5, K ¼ 100, k1r ¼ 1 (Eqn A6), k2r ¼ 104, k3r ¼ k4r ¼
k5r ¼ k6r ¼ k7r ¼ k8r ¼ k9r ¼ k10r ¼ k11r ¼ k12r ¼ k13r ¼ k14r ¼ k15r ¼ k16r ¼ k17r ¼ k18r ¼ k19r ¼ k20r ¼ k21r ¼ k22r ¼ k23r ¼ k24r ¼ k25r ¼ k26r ¼
k27r ¼ k28r ¼ k29r ¼ 1, K1 ¼ 10, K2 ¼ 0.0001, K5 ¼ 106, K3 ¼ K9 ¼ K10 ¼ K11 ¼ K12 ¼ K13 ¼ K17 ¼ 1, K15 ¼ K27 ¼ 100, K29 ¼ 1000
and all the other Kj calculated as indicated in Eqns (A25) to (A27) and Table A2. (B) Another example of an impulse behaviour: the parameter
values are e1t ¼ e2t ¼ 0.5, K ¼ 1000, k1r ¼ 1 (Eqn A6), k2r ¼ 104, k3r ¼ k4r ¼ k5r ¼ k6r ¼ k7r ¼ k8r ¼ k9r ¼ k10r ¼ k11r ¼ 1, k12r ¼ 103,
k13r ¼ k14r ¼ k15r ¼ k16r ¼ k17r ¼ k18r ¼ k19r ¼ k20r ¼ k21r ¼ k22r ¼ k23r ¼ k24r ¼ k25r ¼ k26r ¼ k27r ¼ k28r ¼ 1, k29r ¼ 104, K1 ¼ 10, K2 ¼
0.0001, K3 ¼ 1000, K5 ¼ 106, K9 ¼ K10 ¼ K11 ¼ 1, K12 ¼ 0.001, K13 ¼ 100, K15 ¼ 1000, K17 ¼ 1, K27 ¼ 100, K29 ¼ 10000 and all the other
Kj calculated as indicated in Eqns (A25) to (A27) and Table A2. (C) Examples of an only partial inhibition at high s1 values: the parameter values are e1t ¼ e2t ¼ 0.5, K ¼ 100, k1r ¼ 1 (Eqn A6), k2r ¼ 100, k3r ¼ k4r ¼ k5r ¼ k6r ¼ k7r ¼ k8r ¼ k9r ¼ k10r ¼ k11r ¼ k12r ¼ k13r ¼ k14r ¼
k15r ¼ k16r ¼ k17r ¼ k18r ¼ k19r ¼ k20r ¼ k21r ¼ k22r ¼ k23r ¼ k24r ¼ k25r ¼ k26r ¼ k27r ¼ k28r ¼ k29r ¼ 1, K1 ¼ 10 (curve a), 102 (curve b), 103
(curve c) and 104 (curve d), K2 ¼ 0.01, K5 ¼ 103, K9 ¼ 10, K3 ¼ K10 ¼ K11 ¼ K12 ¼ K13 ¼ K15 ¼ K17 ¼ K29 ¼ 1, K27 ¼ 100 and all the other
Kj calculated as indicated in Eqns (A25) to (A27) and Table A2. (D) Example of an inversed step response: the parameter values are e1t ¼
e2t ¼ 0.5, K ¼ 1000, k1r ¼ 1 (Eqn A6), k2r ¼ 104, k3r ¼ k4r ¼ k5r ¼ k6r ¼ k7r ¼ k8r ¼ k9r ¼ k10r ¼ k11r ¼ 1, k12r ¼ 103, k13r ¼ k14r ¼ k15r ¼
k16r ¼ k17r ¼ k18r ¼ k19r ¼ k20r ¼ k21r ¼ k22r ¼ k23r ¼ k24r ¼ k25r ¼ k26r ¼ k27r ¼ k28r ¼ 1, k29r ¼ 104, K1 ¼ 10, K2 ¼ 0.0001, K3 ¼ 75, K5 ¼
106, K9 ¼ K10 ¼ K11 ¼ 1, K12 ¼ 0.001, K13 ¼ 100, K15 ¼ 1000, K17 ¼ 1, K27 ¼ 100, K29 ¼ 10000 and all the other Kj calculated as indicated
in Eqns (A25) to (A27) and Table A2.
two enzymes that diffused freely, i.e., without FDS.)
Homeostasis results when, despite the concentration
of the initial substrate, s1, varying, the rate of production of the final product is constant (Fig. 1B).
An impulse that could constitute a signal, results
when, at a narrow range of low concentrations of
substrate s1, the rate of production of the final product takes the form represented in Fig. 1C (Fig. 4A,B
show a more realistic representation). A switch as
represented in Fig. 1D (curve a) could be based on
the sigmoid curve in the production rate. A switch
from a high rate to a low rate of production occurs
4292
when s1 exceeds the threshold s0 at the inflection
point (Fig. 4D) and this could correspond to a substrate-inhibition behaviour. Hence the assembly of
two enzymes into an FDS could allow a switch
behaviour. Alternatively, it could allow this enzyme
system to be efficient at a low substrate concentration but not at a high concentration where the substrate would become available for enzymes in a
different metabolic pathway.
A strongly sigmoid curve from low to high rates of
production was not revealed by our calculations (see
above). Weakly sigmoid curves from low to high rates
FEBS Journal 273 (2006) 4287–4299 ª 2006 The Authors Journal compilation ª 2006 FEBS
M. Thellier et al.
Functioning-dependent structures
v(s1)
log z1
0.08
A
B
2
1
0.04
0
-3
log s1
-2
-1
0
-1
-2
0
0
0.1
-3
0 .2
s1
Fig. 5. Example of a sigmoid {s1, v(s1)} curve computed in the case of a two-enzyme FDS. The parameter values are e1t ¼ e2t ¼ 0.5,
K ¼ 100, k1r ¼ 1 (Eqn A6), k2r ¼ 10, k3r ¼ k4r ¼ k5r ¼ k6r ¼ k7r ¼ k8r ¼ k9r ¼ k10r ¼ k11r ¼ k12r ¼ k13r ¼ k14r ¼ k15r ¼ k16r ¼ k17r ¼ k18r ¼
k19r ¼ k20r ¼ k21r ¼ k22r ¼ k23r ¼ k24r ¼ k25r ¼ k26r ¼ k27r ¼ k28r ¼ k29r ¼ 1, K1 ¼ K2 ¼ 0.1, K3 ¼ 10, K5 ¼ 1000, K9 ¼ K10 ¼ K11 ¼ K12 ¼
K13 ¼ K15 ¼ K17 ¼ K29 ¼ 1, K27 ¼ 100 and all the other Kj calculated as indicated in Eqns (A25) to (A27) and Table A2. (A) Curve represented
using the direct system of coordinates, {s1, v(s1)}. (B) Curve represented using the Hill system of coordinates, {log s1, log z1} with
z1 ¼ {v(s1) ⁄ [vmax–v(s1)]}; from the slope of the dashed regression line fitted to the curve, the Hill coefficient was estimated to be of the order
of 1.47.
v(s1)
0.4
d
c
0.2
b
a
0
0
0.1
s1
0.2
Fig. 6. Examples of dual-phasic {s1, v(s1)} curves computed in the
case of a two-enzyme FDS. The parameter values are e1t ¼ e2t ¼
0.5, K ¼ 100, k1r ¼ 1 (Eqn A6), k2r ¼ 100, k3r ¼ k4r ¼ k5r ¼ k6r ¼
k7r ¼ k8r ¼ k9r ¼ k10r ¼ k11r ¼ k12r ¼ k13r ¼ k14r ¼ k15r ¼ k16r ¼ k17r ¼
k18r ¼ k19r ¼ k20r ¼ k21r ¼ k22r ¼ k23r ¼ k24r ¼ k25r ¼ k26r ¼ k27r ¼
k28r ¼ k29r ¼ 1, K1 ¼ K9 ¼ 10, K2 ¼ 0.01, K3 ¼ K11 ¼ K12 ¼ K13 ¼
K15 ¼ K17 ¼ K29 ¼ 1, K5 ¼ 1000, K27 ¼ 100, K10 ¼ 1 (curve a), 10
(curve b), 102 (curve c) and 103 (curve d) and all the other Kj calculated as indicated in Eqns (A25) to (A27) and Table A2.
of production were sometimes observed with Hill coefficients of less than 2 (Fig. 5) but these could not constitute switches. Compared with the sigmoidicity of
allosteric enzymes [68], that of a two-enzyme FDS –
the only type tested here – is poor. Experimental
results are consistent with this because the formation
of a protein–protein complex of serine acetyl transferase with O-acetylserine(thiol)-lyase strongly modifies
the kinetic properties of the first enzyme and results in
a transition from a typical Michaelis–Menten behaviour to a behaviour displaying positive cooperativity
with respect to serine and acetyl-CoA with a Hill coefficient in the range of 1.3–2.0 [47].
It is probable that many more types of FDSs exist
than those found so far experimentally (see above).
Indeed, many FDSs may have escaped detection precisely because they tend to dissociate as the substrate
concentration decreases, as generally occurs during
in vitro studies. It may even turn out that most
enzymes and other proteins such as those involved in
signalling assemble into FDSs in vivo when functioning. These FDSs may be connected to more permanent
structures such as membranes and the cytoskeleton.
They may even be connected to one another to form a
network integrating FDSs responsible for metabolism
and for signal transduction [11,76]. Such a vision of
intracellular organization is supported by many studies
showing the recruitment of proteins into functional
structures (reviewed in [3–5]) and the coordination of
multiple functions via the formation of networks of
signalling complexes [11,16,77–79]. More than 50 different types of protein assemblies, containing up to 35
proteins, have been identified in functions that include
transcription regulation, cell-cycle ⁄ cell-fate control,
RNA processing, and protein transport [13]. It could
be argued that the concept of FDS should not be limited to the intracellular level. Indeed, a concept similar
to that of the FDS has been employed at the multicellular level to explain how neurones participate in
FEBS Journal 273 (2006) 4287–4299 ª 2006 The Authors Journal compilation ª 2006 FEBS
4293
Functioning-dependent structures
M. Thellier et al.
different assemblies at different times depending on the
task to be carried out [80].
Biochemists are familiar with the Structure fi Function relationship with respect to proteins or other
active molecules or cell substructures. They are less
familiar with the idea that the very functioning of
these cellular components may result in their assembling into a dynamic structure from which a better or
even a new functioning emerges. In this case, the relationship above must be changed into
Structure
Function
This leads to the intuition that the very existence of
such a self-organizing relationship in a system is an
indication that this system is a living one. To try to
express this quantitatively, consider the density of
entropy production in a process involving an FDS.
According to the second law of thermodynamics, the
functioning of any system entails a positive production
of entropy that can be written as a bilinear form of the
flux densities of the processes and their conjugated
driving forces [81]. Whichever reaction pathway in our
system is chosen to connect S1 and S3 (Fig. 2), under
steady-state conditions the only molecules that undergo
transformation are S1 and S3 while the other molecules
remain unchanged. Hence, the corresponding density of
entropy production, r, is that of the overall reaction of
transformation of S1 into S3, and r does not depend
on whether the system is catalysed via free enzymes or
an FDS. Out of steady state, however, the situation is
different because the free enzymes, E1 and E2, can act
immediately on their substrates whereas the FDS
enzymes must assemble into an FDS before they can
act. Consequently, if r is expressed in the standard
way, terms representing the entropic cost of FDS
assembly ⁄ disassembly are present only in the description of living systems.
Acknowledgements
We thank Jacques Ricard and Derek Raine for helpful
comments and criticisms.
References
1 Mowbray J & Moses V (1976) The tentative identification in Escherichia coli of a multi-enzyme complex with
glycolytic activity. Eur J Biochem 66, 25–36.
2 Srivastava DK & Bernhard SA (1986) Metabolic transfer
via enzyme-enzyme complexes. Science 234, 1081–1086.
4294
3 Srere PA (1987) Complexes of sequential metabolic
enzymes. Annu Rev Biochem 56, 21–56.
´
4 Keleti T, Ovadi J & Batke J (1989) Kinetic and physicochemical analysis of enzyme complexes and their possible role in the control of metabolism. Prog Biophys Mol
Biol 53, 105–152.
´
´
5 Ovadi J, Tompa P, Vertessy B, Orosz F, Keleti T &
Welch GR (1989) Transient time analysis of substrate
channelling in interacting enzyme systems. Biochem J
257, 187–190.
´
6 Srere PA & Ovadi J (1990) Enzyme–enzyme interactions
and their metabolic role. FEBS Lett 268, 360–364.
´
7 Ovadi J (1991) Physiological significance of metabolic
channelling. J Theor Biol 152, 1–22.
8 Hrazdina G & Jensen RA (1992) Spatial organization
of enzymes in plant metabolic pathways. Annu Rev
Plant Physiol Mol Biol 43, 241–267.
9 Mathews CK (1993) The cell – bag of enzymes or network of channels? J Bacteriol 175, 6377–6381.
10 Mitchell CG (1996) Identification of a multienzyme
complex of the tricarboxylic acid cycle enzymes containing citrate synthase isoenzymes from Pseudomonas
aeruginosa. Biochem J 313, 769–774.
11 Gavin AC, Bosche M, Krause R, Grandi P, Marzloch
ă
M, Bauer A, Schultz J, Rick JM, Michon AM, Cruciat
CM et al. (2002) Functional organization of the yeast
proteome by systematic analysis of protein complexes.
Nature 415, 141–147.
12 Minsky A, Shimoni E & Frenkiel-Krispin D (2002)
Stress, order and survival. Nature Rev Mol Cell Biol 3,
50–60.
13 Spirin V & Mirny LA (2003) Protein complexes and
functional modules in molecular networks. Proc Natl
Acad Sci USA 100, 12123–12128.
14 Champion MM, Campbell CS, Siegele DA, Russell
DH & Hu JC (2003) Proteome analysis of
Escherichia coli K-12 by two-dimensional native-state
chromatography and MALDI-MS. Mol Microbiol 47,
383–396.
15 Winkel BSJ (2004) Metabolic channelling in plants.
Annu Rev Plant Biol 55, 85–107.
16 Aloy P, Bottcher B, Ceulemans H, Leutwein C, Mellwig
ă
C, Fischer S, Gavin AC, Bork P, Superti-Furga G, Serrano L & Russell RB (2004) Structure-based assembly of
protein complexes in yeast. Science 303, 2026–2029.
17 Norris V & Fishov I (2001) Membrane domains, hyperstructures and cell division. Biochimie 83, 91–98.
18 Shmelev VK & Serebrenikova TP (1997) A study of
supramolecular organization of glycogenolytic enzymes
in vertebrate muscle tissue. Biochem Mol Biol Int 43,
867–872.
19 Velot C, Mixon MB, Teige M & Srere PA (1997) Model
of a quinary structure between Krebs TCA cycle
enzymes: a model for the metabolon. Biochemistry 36,
14271–14276.
FEBS Journal 273 (2006) 4287–4299 ª 2006 The Authors Journal compilation ª 2006 FEBS
M. Thellier et al.
20 Norris V, Gascuel P, Guespin-Michel J, Ripoll C &
Saier MH Jr (1999) Metabolite-induced metabolons: the
activation of transporter-enzyme complexes by substrate
binding. Mol Microbiol 31, 1592–1595.
21 Pauwels K, Abadjieva A, Hilven P, Stankiewicz A &
Crabeel M (2003) The N-Acetylglutamate synthase ⁄
N-Acetylglutamate kinase metabolon of Saccharomyces
cerevisiae allows coordinated feedback regulation of the
first two steps in arginine biosynthesis. Eur J Biochem
270, 1014–1024.
22 Alvarez BV, Vilas GL & Casey JR (2005) Metabolon
disruption: a mechanism that regulates bicarbonate
transport. EMBO J 24, 2499–2511.
23 Jørgensen K, Rasmussen AV, Morant M, Nielsen AH,
Bjarnholt N, Zagrobelny M, Bak S & Møller BL (2005)
Metabolon formation and metabolic channeling in the
biosynthesis of plant natural products. Curr Opin Plant
Biol 8, 280–291.
´
24 Trewavas AJ & Malho R (1997) Signal perception and
transduction: the origin of the phenotype. Plant Cell 9,
1181–1195.
25 Le Sceller L, Ripoll C, Demarty M, Cabin-Flaman A,
Nystrom A, Saier MH Jr & Norris V (2000) Modelling
bacterial hyperstructures with cellular automata.
Interjournal of Complex Systems Article 366. http://
www.interjournal.org.
26 Norris V, Amar P, Ballet P, Bernot G, Delaplace F,
Demarty M, Giavitto JL, Ripoll C, Thellier M &
Zemirline A (2002) Hyperstructures. In Proceedings of
the Autrans Seminar on Modelling and Simulation of Biological Processes in the Context of Genomics (Amar P,
´ `
Kepes F, Norris V & Tracqui P, eds), pp. 169–191.
´
`
Barneoud, Bonchamp-les-Laval, France.
´
´
27 Guzman EC, Guarino E, Riola J, Caballero JL & Jime´
nez-Sanchez A (2003) Ribonucleoside diphosphate
reductase is a functional and structural component of
the replication hyperstructure in Escherichia coli. Recent
Res Devel Mol Biol 1, 29–43.
28 Thellier M (2003) From a static to a dynamic description of living systems. Nova Acta Leopoldina NF 88
332, 11–15.
29 Westerhoff HV & Welch GR (1992) Enzyme organization and the direction of metabolic flow: physicochemical considerations. Curr Top Cell Regul 33, 361–390.
30 Mendes P, Kell DB & Welch GR (1995) Metabolic
channelling in organized enzyme systems: experiments
and models. In Enzymology in vivo (Advances in Molecular and Cellular Biology series) (Brindle K, ed.), pp.
1–19. JAI Press, London.
31 Anderson KS (1999) Fundamental mechanisms of substrate channelling. Methods Enzymol 308, 111–145.
32 James CL & Viola RE (2002) Production and characterization of bifunctional enzymes. Substrate channelling in the aspartate pathway. Biochemistry 41, 3726–
3731.
Functioning-dependent structures
33 Maher AD, Kuchel PW, Ortega F, de Atauri P,
Centelles J & Cascante M (2003) Mathematical
modelling of the urea cycle. A numerical investigation
into substrate channelling. Eur J Biochem 270, 3953–
3961.
34 Mendes P, Kell DB & Westerhoff HV (1992) Channelling can decrease pool size. Eur J Biochem 204, 257–
266.
´
35 Vertessy BG & Vas M (1992) Metabolite channeling
versus free diffusion: reinterpretation of aldolasecatalysed inactivation of glyceraldehydes-3-phosphate
dehydrogenase. Biochem J 286, 977–980.
36 Cornish-Bowden A (1991) Failure of channelling to
maintain low concentrations of metabolic intermediates.
Eur J Biochem 195, 103–108.
37 Cornish-Bowden A & Cardenas ML (1993) Channelling
can affect concentrations of metabolic intermediates at
constant net flux: artefact or reality? Eur J Biochem 213,
87–92.
38 D’Ari R & Casadesus J (1998) Underground metabolism. Bioessays 20, 181–186.
39 Friedrich P (1974) Dynamic compartmentation in soluble enzyme systems. Acta Biochim Biophys Acad Sci
Hung 9, 159–173.
40 Friedrich P (1984) Supramolecular Enzyme Organization:
Quaternary Structure and Beyond. Pergamon Press ⁄
´
´
Akademiai Kiado, Oxford ⁄ Budapest.
41 Thellier M, Legent G, Norris V, Baron C & Ripoll C
(2004) Introduction to the concept of ‘functioningdependent structures’ in living cells. CR Biologies 327,
1017–1024.
42 Kredich NM, Becker MA & Tomkins GM (1969) Purification and characterization of cysteine synthetase, a
bifunctional protein complex, from Salmonella typhimurium. J Biol Chem 244, 2428–2439.
´
43 Ovadi J (1988) Old pathway-new concept: control
of glycolysis by metabolite–modulated dynamic
enzyme associations. Trends Biochem Sci 13, 486–
490.
44 Torshin I (1999) Activating oligomerization as intermediate level of signal transduction: analysis of proteinprotein contacts and active sites in several glycolytic
enzymes. Front Biosci 4D, 557–570.
45 Dillon PF & Clark JF (1990) The theory of diazymes
and functional coupling of pyruvate kinase and creatine
kinase. J Theor Biol 143, 275–284.
46 Droux M, Martin J, Sajus P & Douce R (1992) Purification and characterization of O-acetylserine (thiol) lyase
from spinach chloroplasts. Arch Biochem Biophys 295,
379–390.
47 Droux M, Ruffet ML, Douce R & Job D (1998) Interaction between serine acetyl-transferase and O-acetylserine (thiol) lyase in higher plants. Structure and kinetic
properties of the free and bound enzymes. Eur J Biochem 255, 235–245.
FEBS Journal 273 (2006) 4287–4299 ª 2006 The Authors Journal compilation ª 2006 FEBS
4295
Functioning-dependent structures
M. Thellier et al.
48 Kane PM (1995) Disassembly and reassembly of the
yeast vacuolar H+-ATPase in vivo. J Biol Chem 270,
17025–17032.
49 Parra KJ & Kane PM (1998) Reversible association
between the V1 and V0 domains of yeast vacuolar H+ATPase is an unconventional glucose-induced effect.
Mol Cell Biol 18, 7064–7074.
50 Kane PM & Parra KJ (2000) Assembly and regulation of
the yeast vacuolar H+-ATPase. J Exp Biol 203, 81–87.
´
´
51 Letoffe S, Delepelaire P & Wandersman C (1996) Protein secretion in Gram-negative bacteria: assembly of
the three components of ABC protein mediated exporters is ordered and promoted by substrate binding.
EMBO J 15, 5804–5811.
52 Kirsch J & Betz H (1998) Glycine-receptor activation is
required for receptor clustering in spinal neurones.
Nature 392, 717–720.
53 Betz H, Kuhse J, Schmieden V, Laube B, Kirsch J &
Harvey RJ (1999) The strychnine-sensitive glycine receptor (GlyR) is a pentameric chloride. Ann N Y Acad Sci
868, 667–676.
54 Sabatini DK, Barrow RK, Blackshaw S, Burnett PE,
Lai MM, Field ME, Bahr BA, Kirsch J, Betz H &
Snyder SH (1999) Interaction of RAFT1 with Gephyrin
is required for rapamycine-sensitive signalling. Science
284, 1161–1164.
55 Kins S, Betz H & Kirsch J (2000) Collybistin, a newly
identified brain-specific GEF, induces submembrane
clustering of gephyrin. Nat Neurosci 3, 22–29.
56 Janeway CA, Travers P, Walport M & Capra JD (1999)
Signalling through lymphocyte receptors. In Immunobiology, 4th edn, pp. 163–193. Elsevier Science Ltd,
London and Garland Pu, New York.
57 Tuosto L, Parolini I, Schroder S, Sargiacomo M,
Lanzavecchia A & Viola A (2001) Organization of
plasma membrane functional rafts upon T-cell
activation. Eur J Immunol 31, 345–349.
´
´
58 Douce R, Bourguignon J, Neuburger M & Rebeille F
(2001) The glycine decarboxylase system: a fascinating
complex. Trends Plant Sci 6, 167–176.
59 Vignais PV (2002) The superoxide-generating NADPH
oxidase: structural aspects and activation mechanisms.
Cell Mol Life Sci 59, 1428–1459.
60 Hubert DA, Tornero P, Belkhadir Y, Krishna P,
Takahashi A, Shirasu K & Dangl JL (2003) Cytosolic
HSP90 associates with and modulates the Arabidopsis
RPM1 disease resistance protein. EMBO J 22, 5679
5689.
61 Giannone G, Dubin-Thaler BJ, Dobereiner HG, Kieffer
ă
N, Bresnick AR & Sheetz MP (2004) Periodic lamellipodial contractions correlate with rearward actin waves.
Cell 116, 431–443.
62 Marrus SB & Di Antonio A (2004) Preferential localization of glutamate receptors opposite sites of high presynaptic release. Curr Biol 14, 924–931.
4296
63 Crowther LJ, Yamagata A, Craig L, Tainer JA &
Donnenberg MS (2005) The ATPase activity of BfpD
is greatly enhanced by zinc and allosteric interactions
with other Bfp proteins. J Biol Chem 280, 24839–
24848.
64 Morin-Ganet MN, Rambourg A, Deitz SB, Franzusoff
´ `
A & Kepes F (2000) Morphogenesis and dynamics of
the yeast Golgi apparatus. Traffic 1, 56–68.
´ `
65 Kepes F (2002) Secretory compartments as instances of
dynamic self-evolving structures. Acta Biotheor 50, 209–
221.
66 Presley JF, Ward TH, Pfeifer AC, Siggia ED, Phair RD
& Lippincott-Schwartz J (2002) Dissection of COPI and
Arf1 dynamics in vivo and role in Golgi membrane
transport. Nature 417, 187–193.
67 Rambourg A, Delosme JM, Incitti R, Satiat-Jeunemaıˆ ´ `
tre B, Tracqui P & Kepes F (2002) Modeling the
dynamics of secretory compartments. In Proceedings of
the Autrans Seminar on Modelling and Simulation of Biological Processes in the Context of Genomics (Amar P,
´ `
Kepes F, Norris V & Tracqui P, eds), pp. 147–168.
´
`
Barneoud, Bonchamp-les-Laval, France.
68 Monod J, Wyman J & Changeux JP (1965) On the nature of allosteric transitions: a plausible model. J Mol
Biol 12, 88–118.
69 Legent G, Thellier M, Norris V & Ripoll C
(2006) Steady-state kinetic behaviour of two- or
n-enzyme systems made of free sequential enzymes
involved in a metabolic pathway. CR Biologies 329,
doi: 10.10.16/J.CRVI.2006.02.008.
70 Epstein E (1966) Dual pattern of ion absorption by
plant cells and by plants. Nature 212, 457–474.
71 Vincent JC & Thellier M (1983) Theoretical analysis of
the significance of whether or not enzyme or transport
systems in structured media follow Michaelis-Menten
kinetics. Biophys J 41, 23–28.
72 Thellier M, Vincent JC, Alexandre S, Lassalles JP, Deschrevel B, Norris V & Ripoll C (2003) Biological processes
in organised media. CR Biologies 326, 149–159.
73 Westerhoff HV & Kamp F (1986) Maxwell’s demons in
channelled metabolism: paradoxes and their resolution.
In Organization of Cell Metabolism (Welch GR & Clegg
JS, eds), pp. 339–356. Plenum Press, London.
74 Schnell S & Turner TE (2004) Reaction kinetics in
intracellular environments with macromolecular crowding: simulations and rate laws. Prog Biophys Mol Biol
85, 235–260.
75 Turner TE, Schnell S & Burrage K (2004) Stochastic
approaches for modelling in vivo reactions. Comput Biol
Chem 38, 165–178.
76 Ripoll C, Norris V & Thellier M (2004) Ion condensation and signal transduction. Bioessays 26, 549–557.
77 Jordan JD, Landau EM & Iyengar R (2000) Signaling
networks: the origin of cellular multitasking. Cell 103,
193–200.
FEBS Journal 273 (2006) 4287–4299 ª 2006 The Authors Journal compilation ª 2006 FEBS
M. Thellier et al.
Functioning-dependent structures
78 Bhalla S & Iyengar R (1999) Emergent properties of
networks of biological signalling pathways. Science 283,
381–387.
79 Bhalla S & Iyengar R (2001) Robustness of the bistable
behaviour of a biological signalling feedback loop.
Chaos 11, 221–226.
80 Singer W (2003) Oscillations and synchrony: time as
coding space in neuronal processing. Nova Acta
Leopoldina NF 88 332, 35–56.
81 Nicolis G & Prigogine I (1977) Self-Organization in
Non-Equilibrium Systems. Wiley Interscience, New York.
Table A1. The various reactions possibly taking place in the system
under study. Reactions R1 to R4 correspond to the formation of
enzyme–substrate complexes, reactions R5 to R8 and R22 to R25
correspond to the formation of the FDS, reactions R9 to R11, R13
and R26 to R29 correspond to the transformation of S1 into S2 by
enzyme E1, or S2 into S3 by enzyme E2, reaction R12 corresponds
to the channelling of S2 from E1 to E2 within the FDS and reactions
R14 to R21 correspond to the fixation of a second substrate by the
FDS. For any of these reactions, j, k’jf is the rate constant of the
reaction written left to right and k’jr is the rate constant of the reaction written right to left.
Reference number
Reaction
Rate constants
Appendix
R1
R2
R3
R4
R5
R6
R7
R8
R9
R10
R11
R12
R13
R14
R15
R16
R17
R18
R19
R20
R21
R22
R23
R24
R25
R26
R27
R28
R29
E1+S1 ¼ E1S1
E1+S2 ¼ E1S2
E2+S2 ¼ E2S2
E2+S3 ¼ E2S3
E1S1+E2 ¼ E1S1E2
E1S2+E2 ¼ E1S2E2
E2S2+E1 ¼ E1E2S2
E2S3+E1 ¼ E1E2S3
E1 S1 ¼ E1 S2
E2 S2 ¼ E2 S3
E1S1E2 ¼ E1S2E2
E1S2E2 ¼ E1E2S2
E1E2S2 ¼ E1E2S3
E1S1E2+S2 ¼ E1S1E2S2
E1S2E2+S2 ¼ E1S2E2S2
E1S2E2+S3 ¼ E1S2E2S3
E1E2S2+S1 ¼ E1S1E2S2
E1E2S2+S2 ¼ E1S2E2S2
E1S1E2+S3 ¼ E1S1E2S3
E1E2S3+S1 ¼ E1S1E2S3
E1E2S3+S2 ¼ E1S2E2S3
E1S1+E2S2 ¼ E1S1E2S2
E1S1+E2S3 ¼ E1S1E2S3
E1S2+E2S2 ¼ E1S2E2S2
E1S2+E2S3 ¼ E1S2E2S3
E1S1E2S2 ¼ E1S2E2S2
E1S1E2S2 ¼ E1S1E2S3
E1S2E2S2 ¼ E1S2E2S3
E1S1E2S3 ¼ E1S2E2S3
k¢1f, k¢1r
k¢2f, k¢2r
k¢3f, k¢3r
k¢4f, k¢4r
k¢5f, k¢5r
k¢6f, k¢6r
k¢7f, k¢7r
k¢8f, k¢8r
k¢9f, k¢9r
k¢10f, k¢10r
k¢11f, k¢11r
k¢12f, k¢12r
k¢13f, k¢13r
k¢14f, k¢14r
k¢15f, k¢15r
k¢16f, k¢16r
k¢17f, k¢17r
k¢18f, k¢18r
k¢19f, k¢19r
k¢20f, k¢20r
k¢21f, k¢21r
k¢22f, k¢22r
k¢23f, k¢23r
k¢24f, k¢24r
k¢25f, k¢25r
k¢26f, k¢26r
k¢27f, k¢27r
k¢28f, k¢28r
k¢29f, k¢29r
The basis of the model of a two-enzyme FDS
For computing purpose, it is convenient to list in a
table all the different reactions, Rj, appearing in Fig. 2
(Table A1). The rate constants, k¢jf and k¢jr, of the forward and reverse reactions are also indicated in the
table. Note that, depending on the molecularity of the
terms in the left-hand side of the reactions, k¢1f to kÂ8f
and kÂ14f to kÂ25f are expressed in mol)1ặs)1ặm3, while
the other rate constants (k¢9f to k¢13f, k¢26f to k¢29f and
all the k¢jr) are expressed in s)1. In the following, when
any reaction, Rj, in the table proceeds left to right or
right to left, it is written jf or jr, respectively. With
these conventions, the chain of reactions ‘1f-9f-2r-3f10f-4r’ corresponds to the classical case in which the
free enzymes, E1 and E2, transform S1 into S3 via the
liberation of S2 by E1, the diffusion of S2 in the reaction medium and the recapture of S2 by E2. Any other
chain of reactions equivalent to S1 fi S3 (e.g. 12f-17f26f-28f-16r) implicates an FDS.
Definition of dimensionless quantities
For easier analysis, we treat our problem using dimensionless variables and parameters. If the concentration of any substance, X, is written [X], a
dimensionless concentration, x, may be obtained by
normalizing [X] to the total concentration of enzymes
([E1]t+[E2]t),
x ẳ ẵX=ẵE1 t ỵ ẵE2 t ị
A1ị
s ẳ k01r t
Similarly, the dimensionless expression, kj, of the
rate constants, k¢j, will be obtained by normalization
to k¢1r for the rate constants that are expressed in s)1,
and by normalization to k¢1r ⁄ ([E1]t+[E2]t) for those
that are expressed in mol)1ặs)1ặm3, e.g.,
e.g.,
k9f ẳ k09f =k01r ; k9r ẳ k09r =k01r ; k5r ẳ k05r =k01r ; etc:
e1t ẳ ẵE1 t =ẵE1 t ỵ ẵE2 t ị; e1 ẳ ẵE1 =ẵE1 t ỵ ẵE2 t ị;
A2ị
e2 ẳ ẵE2 =ẵE1 t ỵ ẵE2 t ị;
A4ị
and
k1f ẳ ẵE1 t ỵ ẵE2 t ị k01f =k0lr ;
e1 s1 e2 s3 ẳ ẵE1 S1 E2 S3 =ẵE1 t ỵ ẵE2 t ị; etc:
Because kÂ1r is expressed in s)1, a dimensionless
expression, s, of the time, t, may be written as
A3ị
k5f ẳ ẵE1 t ỵ ẵE2 t Þ Á k05f =k01r ; etc:
ðA5Þ
With these conventions, it should be noted that k1r
is always expressed as
FEBS Journal 273 (2006) 4287–4299 ª 2006 The Authors Journal compilation ª 2006 FEBS
4297
Functioning-dependent structures
M. Thellier et al.
k1r ẳ k01r =k01r ẳ 1
A6ị
The basic equations of the steady-state problem
It is apparent in Table A1 that the 29 reactions under
consideration (R1 to R29) involve 17 different chemical species (E1, E2, S1, S2, S3, E1S1, E1S2, E2S2, E2S3,
E1S1E2, E1S2E2, E1E2S2, E1E2S3, E1S1E2S2, E1S2E2S2,
E1S1E2S3 and E1S2E2S3). Assuming that external
mechanisms supply S1 and remove S3 as and when
they are consumed and produced, respectively, such
that S1 is maintained at a constant concentration and
S3 at a zero concentration, the steady-state condition
of functioning of the system is obtained by writing
down the mass balance of the 15 other species
involved. Using the dimensionless quantities, this is
written
de1 =ds ¼ k1r Á e1 s1 k1f e1 s1 ỵ k2r e1 s2 k2f e1 s2
ỵ k7r e1 e2 s2 k7f e1 e2 s2 ỵ k8r Á e1 e2 s3
À k8f Á e1 Á e2 s3 ẳ 0
A7ị
de2 =ds ẳ k3r e2 s2 k3f e2 s2 ỵ k4r e2 s3 k4f e2 s3
ỵ k5r e1 s1 e2 k5f e2 e1 s1 ỵ k6r Á e1 s2 e2
À k6f Á e2 Á e1 s2 ¼ 0
ðA8Þ
de1 s1 e2 =ds ¼ k5f Á e2 Á e1 s1 À k5r Á e1 s1 e2 À k11f e1 s1 e2
ỵ k11r e1 s2 e2 k14f s2 e1 s1 e2
ỵ k14r e1 s1 e2 s2 À k19f Á s3 Á e1 s1 e2
ỵ k19r e1 s1 e2 s3 ẳ 0
A14ị
de1 s2 e2 =ds ¼ k6f Á e2 Á e1 s2 À k6r Á e1 s2 e2 À k12f Á e1 s2 e2
ỵ k12r e1 e2 s2 k15f s2 e1 s2 e2
ỵ k15r e1 s2 e2 s2 k16f s3 e1 s2 e2
ỵ k16r e1 s2 e2 s3 ẳ 0
A15ị
de1 e2 s2 =ds ẳ k7f Á e1 Á e2 s2 À k7r Á e1 e2 s2 k13f e1 e2 s2
ỵ k13r e1 e2 s3 À k17f Á s1 Á e1 e2 s2
ỵ k17r e1 s1 e2 s2 k18f s2 e1 e2 s2
ỵ k18r e1 s2 e2 s2 ẳ 0
A16ị
de1 e2 s3 =ds ẳ k8f e1 e2 s3 k8r e1 e2 s3 ỵ k13f Á e1 e2 s2
À k13r Á e1 e2 s3 k20f s1 e1 e2 s3 ỵ k20r Á e1 s1 e2 s3
À k21f Á s2 Á e1 e2 s3 ỵ k21r e1 s2 e2 s3 ẳ 0
A17ị
de1 s1 e2 s2 =ds ẳ k14f s2 e1 s1 e2 k14r e1 s1 e2 s2
ỵ k17f Á s1 Á e1 e2 s2 À k17r Á e1 s1 e2 s2
ỵ k22f e1 s1 e2 s2 À k22r Á e1 s1 e2 s2
À k26f Á e1 s1 e2 s2 ỵ k26r e1 s2 e2 s2
k27f e1 s1 e2 s2 ỵ k27r e1 s1 e2 s3 ẳ 0 A18ị
de1 s1 e2 s3 =ds ¼ k19f Á s3 Á e1 s1 e2 À k19r Á e1 s1 e2 s3
ds2 =ds ¼ Àk2f Á e1 s2 ỵ k2r e1 s2 k3f e2 s2
ỵ k3r e2 s2 k14f s2 e1 s1 e2 ỵ k14r e1 s1 e2 s2
À k15f Á s2 Á e1 s2 e2 þ k15r Á e1 s2 e2 s2
þ k20f Á s1 Á e1 e2 s3 À k20r Á e1 s1 e2 s3
ỵ k23f e1 s1 e2 s3 k23r Á e1 s1 e2 s3
À k18f Á s2 Á e1 e2 s2 ỵ k18r e1 s2 e2 s2
k21f s2 e1 e2 s3 ỵ k21r e1 s2 e2 s3 ẳ 0
ỵ k27f e1 s1 e2 s2 À k27r Á e1 s1 e2 s3
À k29f Á e1 s1 e2 s3 ỵ k29r e1 s2 e2 s3 ẳ 0 A19ị
A9ị
de1 s2 e2 s2 =ds ẳ k15f Á s2 Á e1 s2 e2 À k15r Á e1 s2 e2 s2
de1 s1 =ds ¼ Àk1r Á e1 s1 þ k1f Á e1 Á s1 þ k5r Á e1 s1 e2
ỵ k18f s2 e1 e2 s2 k18r e1 s2 e2 s2
ỵ k24f e1 s2 Á e2 s2 À k24r Á e1 s2 e2 s2
À k5f Á e2 Á e1 s1 À k9f Á e1 s1 ỵ k9r e1 s2
k22f e1 s1 e2 s2 ỵ k22r e1 s1 e2 s2
k23f e1 s1 e2 s3 ỵ k23r e1 s1 e2 s3 ẳ 0
A10ị
de1 s2 =ds ẳ k2f Á e1 Á s2 À k2r Á e1 s2 À k6f e2 e1 s2
ỵ k6r e1 s2 e2 ỵ k9f e1 s1 k9r e1 s2
k24f e1 s2 e2 s2 ỵ k24r Á e1 s2 e2 s2
À k25f Á e1 s2 Á e2 s3 ỵ k25r e1 s2 e2 s3 ẳ 0
de1 s2 e2 s3 =ds ¼ k16f Á s3 Á e1 s2 e2 À k16r Á e1 s2 e2 s3
ðA11Þ
À k7f Á e1 Á e2 s2 À k10f Á e2 s2 ỵ k10r e2 s3
k22f e1 s1 e2 s2 ỵ k22r e1 s1 e2 s2
A12ị
de2 s3 =ds ¼ k4f Á e2 Á s3 À k4r e2 s3 k8f e1 e2 s3
ỵ k8r e1 e2 s3 ỵ k10f e2 s2 k10r Á e2 s3
À k23f Á e1 s1 Á e2 s3 ỵ k23r e1 s1 e2 s3
k25f e1 s2 e2 s3 ỵ k25r e1 s2 e2 s3 ẳ 0
4298
ỵ k21f s2 e1 e2 s3 k21r e1 s2 e2 s3
ỵ k25f e1 s2 Á e2 s3 À k25r Á e1 s2 e2 s3
ỵ k28f e1 s2 e2 s2 k28r e1 s2 e2 s3
ỵ k29f e1 s1 e2 s3 À k29r Á e1 s2 e2 s3 ¼ 0 A21ị
de2 s2 =ds ẳ k3r e2 s2 ỵ k3f e2 s2 ỵ k7r e1 e2 s2
k24f e1 s2 e2 s2 ỵ k24r e1 s2 e2 s2 ẳ 0
ỵ k26f e1 s1 e2 s2 À k26r Á e1 s2 e2 s2
À k28f e1 s2 e2 s2 ỵ k28r e1 s2 e2 s3 ẳ 0 A20ị
Now, each of the 29 reactions, Rj, in Table A1 has
an equilibrium constant, Kj, equal to the ratio of its
forward to its reverse rate constant
Kj ¼ kjf =kjr
ðA13Þ
ðA22Þ
Using the maple software (Maplesoft Europe, Zug,
Switzerland), the rank of the 29 · 17 matrix of the
FEBS Journal 273 (2006) 4287–4299 ª 2006 The Authors Journal compilation ª 2006 FEBS
M. Thellier et al.
Functioning-dependent structures
stoichiometric coefficients is shown to be equal to 14.
This means that, to solve the set of Eqns (A7) to
(A21), we are justified in fixing arbitrarily the values of
14 equilibrium constants (or linear combinations of
equilibrium constants) and in using appropriate linear
combinations of these basic constants to calculate the
other 15 equilibrium constants. The choice of this base
of 14 independent equilibrium constants is to a large
extent arbitrary. We have chosen
K1 ; K2 ; K3 ; K5 ; K9 ; K10 ; K11 ; K12 ; K13 ; K15 ; K17 ;
ðA23Þ
K27 ; K29 and K
as our base of independent equilibrium constants. In
this base, K is the equilibrium constant of the overall
reaction of transformation of S1 into S3. This constant
K may be expressed by considering any reaction pathway whose balance is S1 fi S3, e.g., {1f-2r-3f-4r-9f -10f},
i.e.,
K ¼ ðk1f Á k2r Á k3f Á k4r Á k9f Á k10f Þ=
ðk1r Á k2f Á k3r Á k4f Á k9r Á k10r Þ
¼ ðK1 Á K3 Á K9 Á K10 Þ=ðK2 Á K4 Þ
ðA24Þ
Table A2. A set of 15 independent reaction circuits with a zero balance, and the calculation of the nonindependent equilibrium constants. The expression of the 15 circuits (L1 to L15), which we have
chosen as a base, is given in the second column. Then the expressions of the 15 nonindependent equilibrium constants (third column) are calculated using Eqns (A22) and (A26) along with the
values of the 14 independent equilibrium constants (base A23), the
expression of K4 (Eqn A25) and the expression of the nonindependent equilibrium constants already calculated.
Reaction circuits with
a zero balance
Reference
number
Expression
Calculated equilibrium constants
L1
L2
L3
L4
L5
L6
L7
5f-6r-9r-11f
3f-6r-15r-24f
12r-15f-18r
2f-7r-18r-24f
1f-7r-17r-22f
9r-22f-24r-26f
10r-22f-23r-27f
L8
L9
L10
4f-5r-19r-23f
11r-14f-15r-26f
9r-23f-25r-29f
L11
L12
L13
L14
L15
11f-16f-19r-29r
26f-27r-28f-29r
7f-8r-10r-13f
13r-17f-20r-27f
13r-18f-21r-28f
K6 ẳ (K5ặK11) K9
K24 ẳ (K5ặK11ặK15) (K3ặK9)
K18 ẳ K15 K12
K7 ẳ (K2ặK5ặK11ặK12) (K3ặK9)
K22 ẳ (K2ặK5ặK11ặK12ặK17) (K1ặK3ặK9)
K26 ẳ (K1ặK9ặK15) (K2ặK12ặK17)
K23 ẳ (K2ặK5ặK11ặK12ặK17ặK27)
(K1ặK3ặK9ặK10)
K19 ¼ (K11ỈK12ỈK17ỈK27) ⁄ K
K14 ¼ (K2ỈK11ỈK12ỈK17) ⁄ (K1ỈK9)
K25 ¼ (K2ỈK5ỈK11ỈK12ỈK17ỈK27ỈK29)
(K1ặK3ặ(K9)2ặK10)
K16 ẳ (K12ặK17ặK27ặK29) K
K28 ẳ (K2ặK12ặK17ặK27ặK29) (K1ặK9ặK15)
K8 ẳ (K2ặK5ặK11ặK12ặK13) (K3ặK9ặK10)
K20 ẳ (K17ặK27) K13
K21 ẳ (K2ặK17ặK27ặK29) (K1ặK9ặK13)
or
K4 ẳ k4f =k4r ẳ K1 K3 K9 Á K10 Þ=ðK2 Á KÞ
ðA25Þ
The remaining 15 equilibrium constants (K6, K7, K8,
K14, K16, K18, K19, K20, K21, K22, K23, K24, K25, K26
and K28) can be calculated along independent reaction
circuits with a zero balance. For example, the reaction
circuit {5f-6r-9r-11f}, the overall total of which is easily
shown to be 0 by combining the forward reactions R5
and R11 with the reverse reactions R6 and R9, is described by the equation
ðK5 Á K11 Þ=ðK6 K9 ị ẳ 1
A26ị
K6 ẳ K5 K11 ị=K9
A27ị
hence
and similarly with the circuits L1 to L15, as indicated
in Table A2.
Again, using the maple software, the set of
Eqns (A7) to (A21) is solved, depending on the values
of the parameters of the problem (the 14 fixed equilibrium constants, one of the two rate constants, kjf or
kjr, of each reaction, Rj, present in Table A1 and the
relative concentrations of the enzymes E1 and E2), and
Eqn (A6) which must always be satisfied. For any
given value of the concentration, s1, of S1, the absolute
values (positive) of the steady-state rate of transformation of S1 into S3 is calculated as corresponding to
both the rate of consumption of S1, v(s1), and the rate
of production of S3, v(s3), i.e.,
Vs1 ị ẳ k1r e1 s1 ỵ k1f e1 s1 k17r e1 s1 e2 s2
ỵ k17f Á s1 Á e1 e2 s2 À k20r Á e1 s1 e2 s3
ỵ k20f s1 e1 e2 s3
Vs3 ị ẳ k4f e2 s3 ỵ k4r Á e2 s3 À k16f Á s3 Á e1 s2 e2
ỵ k16r e1 s2 e2 s3 k19f s3 e1 s1 e2
ỵ k19r e1 s1 e2 s3
FEBS Journal 273 (2006) 4287–4299 ª 2006 The Authors Journal compilation ê 2006 FEBS
Vs1 ị ẳ Vs3 ị
A28ị
A29ị
A30ị
4299