Tài liệu Báo cáo khoa học: Identification of GAS-dependent interferon-sensitive target genes whose transcription is STAT2-dependent but ISGF3-independent doc
Bạn đang xem bản rút gọn của tài liệu. Xem và tải ngay bản đầy đủ của tài liệu tại đây (312.18 KB, 13 trang )
Identification of GAS-dependent interferon-sensitive target
genes whose transcription is STAT2-dependent but
ISGF3-independent
Melissa M. Brierley
1
, Katie L. Marchington
1
, Igor Jurisica
2
and Eleanor N. Fish
1
1 Department of Cell and Molecular Biology, Toronto General Research Institute, University Health Network, and Department of
Immunology, University of Toronto, ON, Canada
2 Division of Signaling Biology, Ontario Cancer Institute, University Health Network, and Department of Medical Biophysics,
University of Toronto, ON, Canada
The type I interferons (IFN)-a ⁄ b are multifunctional
cytokines that mediate host defense against microbial
challenges, influence both normal and neoplastic pro-
liferation, and modulate innate and adaptive immune
responses [1,2]. The binding of type I IFNs to their
shared cognate receptor, type I interferon receptor
(IFNAR), activates multiple intracellular signaling
cascades that coordinate to trigger both the tran-
scriptional activation and translational modifications
necessary to invoke various biological responses [3,4].
Arguably the most notable of these cascades is the
Janus kinase (Jak)-signal transducer and activator of
transcription (STAT) pathway that regulates the
transcription of numerous IFN-sensitive genes (ISGs).
Upon IFN binding to IFNAR, the receptor-associated
kinases tyrosine kinase 2 (Tyk2) and Jak1 phos-
phorylate key tyrosine residues within the intra-
cellular domains of the receptor subunits [5]. These
Keywords
gene regulation; interferon; signal
transduction; transcription factors
Correspondence
E. N. Fish, Toronto General Research
Institute, 67 College Street, Rm 424,
Toronto, ON M5G 2M1, Canada
Fax: +1 416 340 3453
Tel: +1 416 340 5380
E-mail: en.fi
(Received 19 January 2006, revised 6 Febru-
ary 2006, accepted 13 February 2006)
doi:10.1111/j.1742-4658.2006.05176.x
Signal transducer and activator of transcription 2 (STAT2) is best known
as a critical transactivator component of the interferon-stimulated gene
factor 3 (ISGF3) complex that drives the expression of many interferon
(IFN)-inducible genes. However, STAT2 is also involved in DNA binding
in non-ISGF3 transcriptional complexes. We used a DNA microarray to
survey the expression of genes regulated by IFN-inducible, STAT2-depend-
ent DNA binding, and compared the cDNAs of IFN-treated cells over-
expressing intact STAT2 to those of IFN-treated cells overexpressing
mutated STAT2 lacking the DNA binding domain. The IFN-inducible
expression of genes known to be regulated by ISGF3 was similar in both
cases. However, a subset of IFN-inducible genes was identified whose
expression was decreased in cells expressing the mutated STAT2. Impor-
tantly, these genes all contained gamma-activated sequence (GAS)-like ele-
ments in their 5¢ flanking sequences. Our data reveal the existence of a
collection of GAS-regulated target genes whose expression is IFN-inducible
and independent of ISGF3 but highly dependent on the STAT2 DNA
binding domain. This report is the first analysis of the contribution of the
STAT2 DNA binding domain to IFN responses on a global basis, and
shows that STAT2 is required for the IFN-inducible activation of the full
spectrum of GAS target genes.
Abbreviations
IFN, interferon; ISG, IFN-sensitive gene; ISGF3, IFN-stimulated gene factor 3; ISRE, IFN-stimulated response element; IFNAR, type I
interferon receptor; GAS, gamma-activated sequence; IRF, IFN regulatory factor; BSTVQ, binary tree-structured vector quantization; OPHID,
online predicted human protein interaction database; SOM, self-organizing map; STAT2, signal transducer and activator of transcription 2;
TSS, transcriptional start site.
FEBS Journal 273 (2006) 1569–1581 ª 2006 The Authors Journal compilation ª 2006 FEBS 1569
phosphorylated residues act as recruitment sites for
STAT proteins, whereupon activated Jaks phosphory-
late a single tyrosine residue within the carboxy termi-
nus of the STATs [6,7]. The phosphorylated and
activated STATs form both homodimeric and hetero-
dimeric complexes that translocate to the nucleus and
bind specific DNA sequences within the promoter
regions of ISGs to initiate transcription [8].
An important IFN-inducible complex is IFN-stimu-
lated gene factor 3 (ISGF3), comprised of STAT1,
STAT2 and IRF-9 (a member of the IFN regulatory
factor [IRF] family) [9]. Upon nuclear import, ISGF3
binds to the IFN-stimulated response element (ISRE)
present in the promoter regionsof a subset of IFN-
inducible genes and triggers transcription. As well as
ISGF3, type I IFNs induce the formation of additional
STAT-containing complexes, including STAT1–1,
STAT3–3 and STAT5–5 homodimers as well as
STAT3–1 and STAT2–1 heterodimers [10–12]. Rather
than to the ISRE, these homodimers and heterodi-
mers bind to palindromic gamma-activated sequences
(GAS) located in the promoters of a different subset
of ISGs.
Studies of human U6A fibroblasts lacking functional
STAT2 have shown that this transcription factor is
necessary for IFN-inducible antiviral and growth
inhibitory responses [13,14]. Similarly, while STAT2
knockout mice are viable and show no developmental
defects, they have a compromised IFN response and
are highly susceptible to viral infections [15]. These
defects are due, at least in part, to the loss of function
of STAT2-containing ISGF3 complexes that would
normally induce expression of ISRE-containing genes
such as ISG15, 9-27, 6-16, PKR, OAS and MxA
[16,17]. However, some of the defects in STAT2-defici-
ent systems appear to be due to the loss of function of
ill-defined STAT2-containing complexes that are dis-
tinct from ISGF3. While it is known that STAT2–1
heterodimers can regulate IFN responses by binding to
specific GAS-like elements [14,18], only a few GAS-
containing ISGs, including IRF1 and FccRI, have
been identified to date [10].
Microarray gene expression analyses have led to the
identification of numerous ISGs and have implicated
IFNs in activities as diverse as cell adhesion, transcrip-
tional regulation, apoptosis and lipid metabolism
[19,20]. In previous work, we constructed a panel of
fibroblast cell lines (based on the STAT2-deficient cell
line U6A) that overexpress various types of mutated
STAT2 molecules. In that study, cells bearing the V453I,
V454I (VV-II) mutation (U6A-2VV-II cells) that com-
promises the STAT2 DNA binding domain, exhibited
intact ISRE-mediated transcriptional activation but
impaired GAS-mediated transcription [14]. To precisely
determine the transcriptional target genes of ISGF3-
independent STAT2-containing complexes, cDNAs
from IFN-treated cells overexpressing either intact
STAT2 (U6A-2 cells) or the VV-II mutant form of
STAT2 (U6A-2VV-II) were hybridized to an Affymetrix
DNA microarray containing over 22 000 unique tran-
scripts. By comparing the IFN-inducible gene expres-
sion profiles of these cells, we identified a subset of
GAS-dependent ISGs whose activation is exclusively
regulated by ISGF3-independent STAT2-containing
complexes.
Results
ISG expression in the absence of the STAT2 DNA
binding domain as revealed by DNA microarray
We used DNA microarray analysis to compare the
gene expression profiles of U6A (STAT2-deficient),
U6A-2 (intact STAT2), and U6A-2VV-II (mutant
STAT2 lacking the DNA binding domain) cells treated
with 5 ngÆmL
)1
IFN-alfacon-1 for 6 h. Differences in
mRNA expression among these groups (normalized to
untreated controls) were evaluated using the Affyme-
trix U-133A GeneChip microarray and genespringÒ
software. As expected, IFN treatment of U6A cells
expressing either intact or mutated STAT2 induced
the expression (to varying degrees) of many ISGs
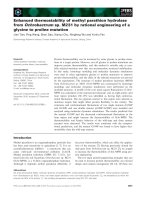
(Fig. 1). Indeed, IFN-alfacon-1 treatment up-regulated
the expression of 232 and 286 genes in U6A-2 and
U6A-2VV-II cells, respectively, by greater than two-
fold. In control U6A cells, only eight genes showed a
greater than two-fold increase in expression in
response to IFN, confirming the importance of STAT2
function to ISG expression. Furthermore, several
genes known to be important for mediating the biolo-
gical effects of IFN, most notably 2¢5¢OAS1 ⁄ 2, Mx
and viperin, were not expressed in U6A cells following
IFN stimulation (Table 1). In contrast, in both U6A-2
and U6A-2VV-II cells, IFN treatment induced com-
parable levels of expression of several known ISRE-
mediated ISGs, including 2¢5¢OAS, Mx, ISG15, 9-27
and MHC class I. These results confirm that the activ-
ity of ISGF3 complexes is intact in the absence of the
STAT2 DNA binding domain. Expression levels of
several known GAS-driven genes, including GBP1,
were also up-regulated to the same degree in both
U6A-2 and U6A-2VV-II cells (Table 1). However, the
expression levels of several other ISGs including
IFIT1, IFIT2, 2¢5¢OAS2 and GIP3, differed markedly
between IFN-treated U6A-2 and U6A-2VV-II cells
(Table 1).
ISGF3-independent STAT2-dependent GAS genes M. M. Brierley et al.
1570 FEBS Journal 273 (2006) 1569–1581 ª 2006 The Authors Journal compilation ª 2006 FEBS
ISG expression in the absence of the STAT2 DNA
binding domain as revealed by real-time PCR
To more quantitatively examine the expression of IFN-
regulated genes in the absence of the STAT2 DNA
binding domain, we treated U6A, U6A-2 and U6A-
2VV-II cells with IFN-alfacon-1 for 6 h and analyzed
gene expression using relative quantitative real-time
PCR. We also carried out MatInspector analyses (see
below) of the upstream promoter regions of IFN-regu-
lated genes to determine the presence of ISRE, GAS
and additional regulatory sequences. Among the genes
selected for examination were PKR, 2¢5¢OAS and Mx1;
genes whose products are known mediators of the
IFN-inducible antiviral response [16]. Comparable
transcriptional activation of the PKR, 2¢5¢OAS and Mx
genes was observed in IFN-stimulated U6A-2 and
U6A-2VV-II cells, and the promoters of all three genes
contained the expected ISRE elements (Fig. S1A–C).
These data support our previous findings that ISGF3
activation is intact in U6A-2VV-II cells (above and
[14]). Moreover, while the promoter regions of PKR
and 2¢5¢OAS also contain potential GAS-like elements,
ISGF3-independent STAT2-containing complexes
dependent on a functional STAT2 DNA binding
domain do not appear to play an important role in
mediating the transcription of these genes.
The c-fos gene was examined in this system as an
example of a GAS-driven gene whose IFN-inducibility
is independent of both ISRE and STAT2. Our analysis
confirmed previous findings [21] that the c-fos
promoter contains a single GAS-like element but not
an ISRE. As well, we found that STAT2 expression
was not required to mediate c-fos expression, because
comparable (albeit weak) IFN-inducible transcriptional
activation of c-fos occurred in U6A, U6A-2 and U6A-
2VV-II cells (Fig. S1D). This result is consistent
with previous studies demonstrating that IFN-indu-
cible c-fos expression is mediated by the binding of
STAT1–1, STAT1–3 or STAT3–3 complexes to the
GAS-like element [22].
Several genes listed in Table 1 were characterized by
absent or weak expression in IFN-treated U6A cells
but high levels of inducible expression in both U6A-2
and U6A-2-VV-II cells. This profile implies that
STAT2, but not necessarily its DNA binding domain,
is required for the expression of these genes. We more
closely examined the expression of the GBP1 gene as
an example of this class of ISG. GBP1 expression was
only weakly up-regulated in U6A cells but induced to
high levels in both U6A-2 and U6A-2-VV-II cells
(Fig. S1E). Our promoter analysis confirmed the exist-
ence of a single ISRE and two GAS-like elements in
the GBP1 upstream promoter region (Fig. S1E). These
127
8
0
0
0
0
576
172
51
35
20
8
351
120
51
35
18
8
1 10 100 1000
Number of Genes Activated upon IFN Stimulation
U6A
VV-II
U6A-2
> 20.0 fold
> 10.0 fold
> 6.0 fold
> 4.0 fold
> 2.0 fold
> 1.5 fold
Fig. 1. IFN-inducible transcriptional activation in the absence of the STAT2 DNA binding domain as determined by Affymetrix DNA microarray
analysis. Total mRNA samples from U6A-2, U6A-2VV-II and U6A cells either left untreated or treated with IFNa for 6 h were applied to
Affymetrix U-133A microarray gene chips. Hybridization data from the IFN-treated samples were normalized to the data from the correspond-
ing untreated samples. The normalized gene expression profiles for each cell category were analyzed as described in Experimental proce-
dures to determine the number and expression level of genes up-regulated following stimulation with IFN. A total of 286 genes were
induced by IFN to a greater than two-fold increase over untreated controls in the absence of the STAT2 DNA binding domain (VV-II).
M. M. Brierley et al. ISGF3-independent STAT2-dependent GAS genes
FEBS Journal 273 (2006) 1569–1581 ª 2006 The Authors Journal compilation ª 2006 FEBS 1571
results indicate that, although STAT2 is required for
IFN-inducible GBP1 expression, ISGF3-independent
STAT2-containing complexes do not appear to play a
significant role in the transcription of this gene. These
results are in agreement with earlier studies which
implicated IFN-a and IFN-c induced STAT1–1 com-
plex interactions with the GAS-like elements [23,24].
Two genes listed in Table 1 were characterized by
IFN-inducibility in U6A-2 cells but absent or weak
expression in both U6A and U6A-2-VV-II cells, imply-
ing that the STAT2 DNA binding domain is essential
for the IFN-triggered expression of these genes: TLR3,
RBMS3. Closer examination of the IFN-inducible
expression of the TLR3 gene using quantitative PCR
confirmed its diminished expression in U6A and U6A-
2-VV-II cells (Fig. S1F). Furthermore, promoter analy-
sis confirmed a previous report [25] identifying both
ISRE and GAS-like elements in the TLR3 promoter
(Fig. S1F). Notably, in this study mutational analysis
determined that the ISRE is important for mediating
TLR3 expression, and competition assays and gene
expression studies suggested that STAT1 can bind to
Table 1. IFN-inducible gene expression in U6A, U6A-2 and U6A-2VV-II cells. Fold induction values represent the change in mRNA levels in
IFN-treated cells compared to untreated cells and were obtained using
GENESPRINGÒ software.
Affymetrix
accession
number Gene description
Fold induction
upon IFN
stimulation U6A U6A-2 VV-II
203153_at IFN-induced protein with tetratricopeptide repeats 1 (IFIT1) – 171.5 98.8
217502_at IFN-induced protein with tetratricopeptide repeats 2 (IFIT2) – 56.1 84.8
204747_at IFN-induced protein with tetratricopeptide repeats 4 (IFIT4) – 41.1 58.6
219211_at Ubiquitin specific protease 18 (USP18) – 40.3 17.7
206553_at 2¢5¢ oligoadenylate synthetase 2 (OAS2) – 31.8 9.0
213797_at Viperin – 30.7 50.6
218943_s_at RNA helicase (RIG-I) – 22.4 23.1
205483_s_at IFN-stimulated protein, 15 kDa (ISG15) – 19.0 38.6
202869_at 2¢5¢ oligoadenylate synthetase 1 (40–46 kDa) (OAS1) – 15.2 13.9
203882_at IFN-stimulated transcription factor 3 gamma (ISGF3G ⁄ IRF9) – 13.5 14.9
213293_s_at Tripartite motif-containing 22 (TRIM22) – 13.3 7.1
214453_s_at IFN-induced, hepatitis C-associated microtubular aggregate
protein (44 kDa) (MTAP44)
– 12.6 14.1
204994_at Myxovirus (influenza) resistance 2 (MX2) – 11.1 12.3
218986_s_at Hypothetical protein FLJ20035 – 10.8 7.0
206271_at Toll-like receptor 3 (TLR3) – 10.2 –
214022_s_at IFN induced transmembrane protein 1 (9–27) – 9.5 7.4
202411_at IFN alpha-inducible protein 27 (IFI27) – 8.5 16.8
204415_at IFN alpha-inducible protein (6–16 or G1P3) – 7.5 22.4
219691_at Hypothetical protein FLJ20073 – 7.0 8.1
208747_s_at Complement subcomponent C1s, alpha- and beta-chains – 6.1 9.5
202270_at Guanylate binding protein 1, interferon-inducible (GBP1) – 5.7 10.0
204533_at Small inducible cytokine subfamily B (Cys-X-Cys) 1.9 5.2 4.5
219209_at Melanoma differentiation associated protein-5 (MDA5) – 5.1 5.5
208392_x_at IFN-induced protein 75, 52 kDa (IFI75) – 5.0 5.3
220104_at Hypothetical protein FLB6421 – 5.0 3.9
207571_x_at Basement membrane-induced gene (ICB-1) – 4.2 11.7
219417_s_at Similar to IFN-induced protein 35 – 4.1 6.1
210797_s_at 2¢5¢ oligoadenylate synthetase-related protein p30 (OASL) – 3.8 5.4
206767_at RNA binding motif, single stranded interacting protein 3 (RBMS3) – 3.8 –
206513_at Absent in melanoma 2 (AIM2) – 3.8 5.7
221044_s_at Ring finger protein 21, IFN-responsive (RNF21) – 3.6 2.1
202446_s_at Phospholipid scramblase 1 – 3.6 5.2
205660_at 2¢5¢ oligoadenylate synthetase-like (OASL) – 3.4 7.2
203595_s_at Retinoic acid- and IFN-inducible protein (58 kDa) (RI58) – 3.4 3.3
200887_s_at Signal transducer and activator of transcription 1 (STAT1) – 3.4 2.8
204804_at Sjogren syndrome antigen A1 (SSA1) – 3.4 3.5
218400_at 2¢5¢ oligoadenylate synthetase 3 (OAS3) – 3.3 8.0
208012_x_at IFN-induced protein 41, 30 kDa (IFI41) – 3.0 3.0
ISGF3-independent STAT2-dependent GAS genes M. M. Brierley et al.
1572 FEBS Journal 273 (2006) 1569–1581 ª 2006 The Authors Journal compilation ª 2006 FEBS
the GAS-like elements and is required for IFN-indu-
cible TLR3 expression. Viewed together, these findings
strongly suggest that the binding of ISGF3-independ-
ent STAT2-containing heterodimers to GAS-like ele-
ments within the TLR3 promoter region may
contribute significantly to TLR3 expression.
ISG expression in the absence of the STAT2
DNA binding domain as revealed by binary
tree-structured vector quantization analysis
The analysis of the microarray results presented in
Table 1 required the use of an arbitrary ‘cut-off’ value
for level of gene expression, an approach that introduces
an element of bias into the analysis. The binary tree-
structured vector quantization (BTSVQ) algorithm (see
below) can be used to analyze microarray data in more
depth and in the absence of such bias. We applied the
BTSVQ algorithm to our microarray data to identify
additional target genes that are transcriptionally
regulated by ISGF3-independent STAT2-containing
complexes. The BTSVQ algorithm sorts data into binary
trees based on equality of expression of each mRNA
target [26]. Samples having progressively dissimilar
levels of target gene expression are placed further down
the tree. The data are then visualized by the means of
self-organizing maps (SOMs; see below) to cluster genes
into distinct units having similar expression levels.
When the total gene expression profiles of untreated
and IFN-treated U6A, U6A-2 and U6A-2VV-II cells
were analyzed using BTSVQ, the resulting binary tree
showed that cells expressing intact STAT2 segregated
from the U6A and U6A-2VV-II cells at the first level
(Fig. 2). Interestingly, the data suggested that the gene
U6A UT U6A T VV-II UT U6A-2 TU6A-2 UTVV-II T
Level 1
Child 1 Child 2
Level 2 U6A UT U6A T VV-II T VV-II UT U6A-2 TU6A-2 UT
Child 3 Child 4Child 1Child 2
Level 3 U6A UT U6A T VV-II T
Child 4Child 3
Level 4
U6A UT U6A T
Child 6Child 5
U6A UT U6A T VV-II UT U6A-2 UTVV-II T
Samples
Areas representing
genes not expressed
Areas representing
expressed genes
Index
U6A-2 T
Fig. 2. BSTVQ analysis of IFN-inducible gene expression in U6A, U6A-2 and U6A-2VV-II cells. The raw data from the Affymetrix U-133A
microarray analysis in Fig. 1 were analyzed using BSTVQ (see Experimental procedures) to generate a binary tree indicating the progressive
degree of dissimilarity of the six cell categories. The SOMs (colored regions) visually represent the differences in gene expression profiles
amongst the six cell categories. Areas identified by visual exploratory analysis are circled and represent genes with the indicated expression
pattern.
M. M. Brierley et al. ISGF3-independent STAT2-dependent GAS genes
FEBS Journal 273 (2006) 1569–1581 ª 2006 The Authors Journal compilation ª 2006 FEBS 1573
expression profile of cells expressing the VV-II mutant
form of STAT2 was more similar to that of U6A cells
than that of U6A-2 cells (Level 1). IFN treatment led
to the further segregation of the sample types as evi-
denced by the altered gene expression profiles in these
cells. Surprisingly, untreated U6A-2VV-II cells were
first to segregate away from the U6A ⁄ U6A2VV-II
cluster, suggesting that IFN stimulation of cells expres-
sing the VV-II mutant form of STAT2 inhibited the
expression of certain genes (Level 2).
Examination of the SOMs confirmed that each cell
category had a unique gene expression profile and that
IFN treatment altered the profile in each case. These
changes to the profile were visualized as blue zones of
the SOMs of the untreated samples becoming red
in the corresponding IFN-treated samples, as IFN-
inducible genes were up-regulated (Fig. 2, colored
regions). Significantly, while IFN treatment down-
regulated a relatively small number of genes in U6A
and U6A-2 cells, IFN-treated U6A-VV-II cells showed
the down-regulation of a substantially larger subset of
genes.
Identification and characterization of a subset of
ISGF3-independent STAT2-dependent target
genes
To identify those genes whose expression was
exclusively regulated by ISGF3-independent STAT2-
containing complexes, we directly compared the gene
expression profiles of the IFN-treated U6A-2 and
U6A-2VV-II cells shown in Fig. 3. Using SOM exam-
ination and the BTSVQ program, we were able to
extract a list of 19 differentially expressed transcripts
that were highly expressed in the IFN-treated U6A-2
sample but absent from the IFN-treated U6A-2VV-II
sample (Table 2). Nine of these transcripts represented
genes encoding well-characterized proteins with defined
functions. The remaining 10 transcripts represented
either hypothetical proteins or proteins with unknown
functions. When genespringÒ was employed to calcu-
late the fold-increase in expression of these genes upon
IFN treatment, we found that each of these mRNAs
was up-regulated about 20–60-fold in IFN-treated
U6A-2 cells compared to IFN-treated U6A-2VV-II
cells (Table 2).
To investigate the promoters of the nine known dif-
ferentially expressed ISGs, we sequenced a region 1000
bases upstream from the transcriptional start site
(TSS) of each gene and searched for the presence
of various STAT-binding GAS elements and ISGF3-
binding ISREs. While three of the genes under study
contained potential ISREs, all exhibited potential
STAT-binding elements with the GAS-like palindromic
core motif TTNNNNNAA (Fig. S2). It should be
noted that, although no GAS-like elements were evi-
dent in the 1000 bp immediately upstream of the
JUND TSS, the matinspector program was able to
identify one GAS-like element between )3809 to
)3791 and a second one between )3813 to )3837 (rel-
ative to the JUND TSS). Importantly, for each ISG,
the region containing the GAS-like elements also con-
tained binding sites for known transcription factors,
including Sp1, Oct1, CREB and NF-jB. This juxta-
position strongly suggests that the GAS-like elements
probably function as promoter regulators modulating
the expression of ISGs.
To verify that the genes detected by BTSVQ
analysis were indeed highly expressed in IFN-treated
U6A-2 cells but not in IFN-treated U6A-2VV-II cells,
real-time PCR validation was performed on four of
the above nine genes: CLDN4, BF, DGKE and MSR1.
The analysis confirmed that these genes were all
expressed at substantially higher levels in IFN-treated
U6A-2 cells than in U6A-2VV-II cells (Fig. 3). Thus,
IFN-inducible expression of these genes is impaired in
the absence of the STAT2 DNA binding domain, sug-
gesting that their IFN-inducible transcription requires
ISGF3-independent STAT2-containing complexes.
Notably, MSR1 exhibited the least difference in IFN-
inducible gene expression between U6A-2 and U6A2-
VV-II cells. Whereas the 1000 bp upstream regions of
0
2
4
6
8
10
12
14
16
BF CLDN4 DGKE MSR1
Relative fold induction U6A-2T vs VV-IIT
Fig. 3. Characterization of the induction levels of a subset of
ISGF3-independent STAT2-dependent ISGs identified by BSTVQ.
The differential expression of four of the ISGs examined in Fig. 4
was assessed in IFN-stimulated U6A, U6A-2 and VV-II cells using
relative quantitative real-time PCR as for Fig. 2. For each sample,
b-actin was evaluated as a reference gene and used for normaliza-
tion. For each gene, data are presented as the fold-increase in
expression in IFN-treated U6A-2 cells compared to IFN-treated
U6A-2VV-II cells. Values ± SE were calculated using
RELATIVE QUANTI-
FICATION
software (Roche) and are the mean of three separate react-
ions, each performed in triplicate.
ISGF3-independent STAT2-dependent GAS genes M. M. Brierley et al.
1574 FEBS Journal 273 (2006) 1569–1581 ª 2006 The Authors Journal compilation ª 2006 FEBS
CLDN4, BF and DGKE contain GAS elements and no
ISREs (Fig. S2), both elements are present in the
upstream region of MSR1. This result suggests that
IFN-inducible, ISGF3-dependent (as well as ISGF3-
independent) STAT2-containing complexes make a con-
tribution to the regulation of MSR1 gene expression.
To explore the physiological relevance of our
microarray findings, we attempted to link our gene
expression data to potential ISGF3-independent
STAT2-regulated signaling pathways that might influ-
ence IFN-inducible outcomes, by generating pathway
networks downstream of IFNAR that highlighted
genes cited in this study (Fig. 4). In addition, we map-
ped our ISGF3-independent STAT2-regulated ISGs
to the OPHID protein–protein interaction network
[27] () to examine the inter-
relationship of these targets within multiple pathways.
This exercise generated a network of 1400 proteins
linked by 2261 interactions, with all but 16 interac-
tions being from human curated sources (Fig. S3).
Notably, all of the IFN-inducible, ISGF3-independent
STAT2-dependent targets identified in this study were
interconnected via signaling networks known to be
activated by IFNs-a ⁄ b. In particular, many of the
identified ISGF3-independent STAT2-mediated events
were associated with cell growth regulation.
Discussion
STAT2 is known to be critical for type I IFN signaling
and to play a crucial role in ISGF3-mediated tran-
scription of IFN-inducible genes. However, STAT2¢s
Table 2. mRNAs identified by BSTVQ analysis of microarray data as highly expressed in IFN-treated U6A-2 cells but not in IFN-treated U6A-
2VV-II cells. Fold induction values represent the change in mRNA levels in IFN-treated U6A-2 cells compared to IFN-treated U6A-2VV-II cells
and were obtained using
GENESPRINGÒ software.
Gene description Function Fold change
Characterized (9)
Claudin 4 (CLDN4) Integral membrane protein and component of tight strand junctions 52.2
Macrophage scavenger receptor 1 (MSR1) Macrophage-specific trimeric integral membrane glycoprotein 42.7
Jun D proto-oncogene (JUND)
a
Component of the AP1 transcription factor complex, role in regulation
of transcription from Pol II promoter
35.0
Desmin (DES) Muscle-specific class II intermediate filament, implicated in
cytoskeleton organization and biogenesis
24.8
Interleukin 20 receptor, alpha (IL-20RA) Receptor for interleukin 20 (IL-20), a cytokine that may be involved
in epidermal function.
24.6
Peptidyl-prolyl cistrans isomerase
NIMA-interacting 1-like (PIN1L)
May be involved in organization of the synaptic cell–cell junction
through interaction with the delta-catenin ⁄ NPRAP-N-cadherin complex
24.3
Neuromedin B receptor (NMBR) Binds neuromedin B, a potent mitogen and growth factor for normal
and neoplastic lung and for gastrointestinal epithelial tissue. Involved
in G-protein signalling
24.3
Diacylglycerol kinase, epsilon (64 kDa) May be involved mainly in the regeneration of phosphatidylinositol (PI)
from diacylglycerol in the PI-cycle during cell signal transduction.
Role in ATP binding and diacylglycerol kinase activity (DGKE)
24.0
B-factor, properdin (BF) Complement factor B, a component of the alternative pathway of
complement activation
22.5
Hypothetical ⁄ unknown (10)
FLJ21198 fis, clone COL00220 Function unknown 58.0
ESTs, Moderately similar to G02654
ribosomal protein L39
Function unknown 44.7
mRNA for KIAA0550 protein Similar to brain-specific angiogenesis inhibitor 3, a seven-span
transmembrane protein
35.0
PAR5 gene Similar to small nuclear ribonucleoprotein polypeptide N,
function unknown
30.5
Unknown clone 12262, mRNA Similar to translocase of inner mitochondrial membrane 8
homolog A (yeast)
27.5
Hypothetical protein PRO2822 Weak similarity to cytokine receptor-like factor 2 precusor 26.9
cDNA DKFZp434N021 Function unknown 26.0
Clone 24775 mRNA sequence Hypothetical protein BC013764, inferred role in potassium ion transport 25.0
Clone 248602, mRNA sequence Similar to hypothetical protein PRO1722 24.5
Hypothetical protein FLJ10619 Function unknown, has a ubiquitin-associated domain 21.3
a
Identified by two separate probe sets.
M. M. Brierley et al. ISGF3-independent STAT2-dependent GAS genes
FEBS Journal 273 (2006) 1569–1581 ª 2006 The Authors Journal compilation ª 2006 FEBS 1575
function with respect to ISGF3-independent transcrip-
tion of ISGs has been unclear. Previous work showed
that, in cells with a loss of function mutation in the
DNA binding domain of STAT2, ISRE-mediated tran-
scriptional activation and gene expression were intact
but GAS-driven transcriptional activation was
compromised [14]. By comparing the IFN-regulated
gene expression profile of cells expressing intact
STAT2 with that of cells expressing the mutated
STAT2, we have identified a subset of GAS-driven
target genes that are selectively regulated by ISGF3-
independent STAT2-containing complexes. We are
confident that our stepwise approach to analyzing our
microarray data has produced results in which bias
has been minimized, ensuring that our results are bio-
logically relevant. We first established full gene expres-
sion profiles of main subgroups of individual cells
responding to IFN treatment. This unsupervised clus-
tering step was followed by identification of the most
differentially regulated genes. Finally, these genes were
validated by real-time PCR and placed into the context
of IFN-related biological pathways.
Target gene binding by STAT complexes is
determined by DNA motif sequence specificity. STAT
homo- or heterodimeric complexes recognize and bind
promoter sequences containing the GAS-like palin-
dromic core motif, TTNNNNN(N)AA. Although the
preferential GAS element for the STAT2–1 heterodi-
mer is ATTTCCCGGAAA [18], the STAT2–1 complex
can also bind to the GAS elements within the promo-
ters of both IRF1 (ATTTCCCCGAAA) and FccRI
(ATTTCCCAGAAA) [28]. While the close conserva-
tion of these three elements suggests a highly con-
served binding motif, other binding site studies have
suggested that STAT2-containing complexes can bind
to sequences that are distinct from canonical ISRE
and GAS elements [18,29]. Thus, there is a degree of
promiscuity in binding to various DNA motifs that
may facilitate STAT-mediated transcriptional regula-
tion across a broader range of genes [30,31]. In our
Jak1
STAT1
STAT2
IFN-α
IFNAR1 IFNAR2
Tyk2
NMBR
DGKE
MSR1
CLDN4
BF
DES
PIN1L
TLR3
JUND
IL-20R
α
CLDN4
membrane tight junctions
membrane tight junctions
DGKE
PKC isoforms
regulates signaling
JUND
IFI-202 / p202
regulation of proliferation
BF
complement cascade
PROLIFERATION
MSR1
lipoprotein uptake
MAPKs
IL-20Rα
DES
mitochondrial
structural integrity,
intracellular signaling
DES
nuclear shape
DES
gene expression
regulation
TLR3
PI3K
NMBR
PIN1L
proliferation
regulator of mitosis
extracellular
cytoplasm
nucleus
Fig. 4. ISGF3-independent STAT2-dependent ISGs in a signaling context. Schematic representation of potential pathway interactions
between known IFN signaling effectors and factors whose expression was found to be regulated by ISGF3-independent STAT2-containing
complexes.
ISGF3-independent STAT2-dependent GAS genes M. M. Brierley et al.
1576 FEBS Journal 273 (2006) 1569–1581 ª 2006 The Authors Journal compilation ª 2006 FEBS
study, the 5¢ flanking regions of the identified ISGF3-
independent STAT2-dependent ISGs contained GAS-
like sequences in their promoters in which the core
GAS consensus sequence was uniformly conserved but
the spacer nucleotides varied (Figs 2 and 4).
Two of the genes identified in Table 2 as regulated
by ISGF3-independent STAT2-containing complexes,
namely BF and JUND, have been previously character-
ized as ISGs [19,20]. BF is an early component of the
alternative complement activation pathway important
for the cellular antiviral response [32,33]. Interestingly,
C1s, an early component of the classical complement
cascade, was up-regulated upon IFN stimulation of
both U6A-2 and U6A-2VV-II cells (Table 1). This lat-
ter observation suggests that ISGF3 complexes mediate
IFN-inducible classical complement activation, while
ISGF3-independent STAT2-containing complexes may
regulate activation of the alternative complement
cascade. CLDN4, a component of intracellular junc-
tions that regulate paracellular ion flux, may be a
potential mediator of IFN-induced antitumor res-
ponses. Increased levels of this protein have been
detected in various tumor cell lines [34–36]. CLDN4 is
negatively regulated by TGF-b, positively regulated
by Ras signaling, and restricts the invasiveness and
metastatic potential of pancreatic cancer cells [34].
The JUND proto-oncogene may also influence the
antiproliferative activity of IFNs. JUND has been
implicated in the activation of the IFN-inducible
protein, p202 [37]. In association with E2F, p202
inhibits cell growth by abrogating E2F1-mediated tran-
scriptional activation of S-phase genes driving cellular
proliferation [38].
It is less obvious how other genes identified in Table 2
are related to IFN-mediated activities, as none has been
previously characterized as an ISG. Nevertheless, the
case can be made for several of these genes to be linked
to different aspects of IFN biology. For example,
although its precise function remains unknown, the
alpha chain of the IL-20 receptor, IL-20RA, mediates
the signaling of cytokines that are involved in immune
regulation and inflammatory responses, namely IL-19,
IL-20, IL-24 and IL-26 [39–43]. Therefore, IFN regula-
tion of IL-20RA will affect various aspects of the innate
and adaptive immune response. DGKE encodes a diacyl-
glycerol kinase that influences the diacyglycerol-protein
kinase C pathway [44], associated with CLDN4 assem-
bly and membrane integrity [45]. As suggested above,
IFN regulation of CLDN4 may be associated with
antiproiferative activity. DES encodes a filamentous
protein involved in cytoskeletal organization and the
control of nuclear shape and has also been implicated
in intracellular signaling and the regulation of gene
expression [46,47]. How other genes, such as PIN1L,
MSR1 and NMBR, might function as ISGs is currently
a matter of speculation.
As well as the nine known genes cited above, our
BSTVQ comparison of the gene expression profiles of
IFN-treated U6A-2 and U6A-2VV-II cells revealed an
additional 10 differentially expressed transcripts that
encode proteins with unknown functions. It remains to
be determined how these transcripts influence the bio-
activity of IFNs. The ongoing challenge is to define the
sequence of events occurring postreceptor engagement
by IFNs-a ⁄ b that distinguish specific signaling cascades
leading to specific biological outcomes. Future investi-
gations of the nature of the newly identified ISFG3-
independent STAT2-dependent ISGs cited in this study
may shed light on these issues.
Experimental procedures
Cells and reagents
Human fibroblast U6A (null for STAT2) cells were obtained
from G Stark (Cleveland Clinic Foundation, Cleveland,
OH). U6A-2 (overexpresses wild-type STAT2) cells and
U6A-2VV-II (overexpresses STAT2 lacking DNA binding
domain function) cells have been described previously [14].
Cells were cultured in Dulbecco’s modified Eagle’s medium
(Invitrogen, Carlsbad, CA, USA), supplemented with 10%
(v ⁄ v) fetal bovine serum (HyClone, South Logan, UT, USA),
100 UÆmL
)1
penicillin, 100 mgÆmL
)1
streptomycin (Invitro-
gen) and 250 lgÆmL
)1
Hygromycin B (Calbiochem, Missis-
sauga, ON, Canada). Human recombinant IFN-alfacon-1
(specific activity 3.0 · 10
9
UÆmg
)1
) was provided by L Blatt
(Intermune, Brisbane, CA).
RNA preparation for Affymetrix microarray
analysis
To prepare total cellular RNA, cells were either left untreated
or treated with 5 ngÆmL
)1
IFN-alfacon-1 for 6 h at 37 °C.
Cell pellets were lysed and homogenized using Qiagen (Mis-
sissauga, ON, Canada) QIA-shredder columns and RNA
isolation was performed using the Qiagen RNeasy mini-kit
according to the manufacturer’s protocol. The preparation
of cDNAs, sample hybridization and scanning of HG-U-133
A GeneChip
Ò
Arrays (Affymetrix, Santa Clara, CA, USA)
was performed at the Centre for Applied Genomics Micro-
array Facility (Hospital for Sick Children, Toronto, ON) in
accordance with procedures established by Affymetrix.
Microarray data analysis
Raw microarray data were normalized and analyzed using
both the genespringÒ version 6.1 (Silicon Genetics, Santa
M. M. Brierley et al. ISGF3-independent STAT2-dependent GAS genes
FEBS Journal 273 (2006) 1569–1581 ª 2006 The Authors Journal compilation ª 2006 FEBS 1577
Clara, CA, USA) and binary tree-structured vector quanti-
zation (BTSVQ) software programs [26,48]. Analysis using
the genespringÒ program was performed as follows: (a)
raw microarray data were first normalized according to
default settings to ensure per chip normalization; (b) data
were filtered to exclude raw data readings lower than 80;
(c) to obtain the IFN-inducible gene profiles of each cell
category, sample–sample normalization was performed
using the untreated sample as the control; (d) these normal-
ized data were then filtered to include only those with pre-
sent or marginal flags.
To analyze the complete set of raw microarray data with-
out exclusions, the btsvq method was employed. btsvq is
an unbiased computational system that combines partitive
k-means clustering and SOMs to analyze and visualize
microarray gene expression data [26]. This tool enables the
analysis and clustering of gene expression data without pre-
conceived bias. Partitive k-means clustering is a statistical
method of dividing data into a predefined number of clus-
ters. The btsvq program uses k ¼ 2 such that, at each level,
the data are partitioned into two groups based on the
degree of similarity of their gene expression profiles. This
hierarchical clustering method generates a binary tree that
can be used to determine which sample types have the most
similar gene expression profiles. The averaged gene expres-
sions of individual gene clusters are then projected into a
color space to visualize the multidimensional data (SOM
mapping). The SOM algorithm clusters genes with similar
levels of expression and assigns the average level of gene
expression a color value. Regions in red represent highly
expressed or present genes and those in blue represent
unexpressed or absent genes. The intensity of the color is
also informative as a darker shade indicates a greater
degree of expression of genes represented by that region
than does a paler shade.
Complementary DNA synthesis and real-time
PCR
Cells were either left untreated or treated with 5 ngÆmL
)1
IFN-alfacon-1 for 6 h at 37 °C. Cells were lysed and homo-
genized using Qiagen QIA-shredder columns and RNA
isolation was performed as described above. cDNAs were
synthesized using 1 lg RNA in the presence of random
primers and AMV Reverse Transcriptase (Promega, Madi-
son, WI, USA) for 1 h at 42 °C.
Components for real-time PCR were obtained from the
LightCycler
Ò
FastStart Plus DNA Master SYBR Green I
kit (Roche). The LightCycler
Ò
instrument (Roche, Missis-
sauga, ON, Canada) and relative quantification soft-
ware were used for all reactions. PCR reactions were
performed in a final volume of 20 l L containing 0.5 lm of
each primer and 5 lL template cDNA (concentration
100 ngÆlL
)1
). The primer sets used are listed in Table S1.
Standard curves were established for each primer set and
reference (b-actin) and target reactions were performed in
triplicate for each sample.
Promoter analysis
The 5¢ flanking sequences were obtained from the NCBI
Entrez Gene database ( />query.fcgi?db ¼ gene). Promoters were assessed for poten-
tial STAT-binding sites using the gene2promoter and
matinspector programs (Genomatix; omatix.
de) [49]. The NCBI Gene ID numbers were as follows:
c-fos (2353), GBP1 (2633), PKR (5610), Mx1 (4599),
2¢-5¢OAS (4939), TLR3 (7038), CLDN4 (1364), BF (629),
NMBR (4829), IL20RA (53832), DES (1674), DGKE
(8526), PIN1L (5301), MSR1 (4481) and JUND (3727).
Pathway analysis
Pathway analysis was conducted using pathwayassist soft-
ware (Iobion Informatics LLC, Stratagene, La Jolla, CA,
USA) and the Online Predicted Human Interaction Data-
base (OPHID; ). OPHID is a web-
based database of about 40 000 predicted and known
human protein–protein interactions [27].
Acknowledgements
This study was supported by Canadian Institutes of
Health Research Grant MOP 15094 (to E.N.F.);
National Science and Engineering Research Council of
Canada (NSERC) Grant 203833-02, the Institute for
Robotics and Intelligent Systems, and IBM (to I.J.).
References
1 Stark GR, Kerr IM, Williams BR, Silverman RH &
Schreiber RD (1998) How cells respond to interferons.
Annu Rev Biochem 67, 227–264.
2 Pestka S, Krause CD & Walter MR (2004) Interferons,
interferon-like cytokines and their receptors. Immunol
Rev 202, 8–32.
3 Brierley MM & Fish EN (2002) Review: IFN-alpha ⁄
beta receptor interactions to biologic outcomes: under-
standing the circuitry. J Interferon Cytokine Res 22,
835–845.
4 Uddin S & Platanias LC (2004) Mechanisms of Type-I
interferon signal transduction. J Biochem Mol Biol 37,
635–641.
5 Platanias LC, Uddin S & Colamonici OR (1994) Tyr-
osine phosphorylation of the alpha and beta subunits
of the type I interferon receptor. Interferon-beta selec-
tively induces tyrosine phosphorylation of an alpha
subunit-associated protein. J Biol Chem 269, 17761–
17764.
ISGF3-independent STAT2-dependent GAS genes M. M. Brierley et al.
1578 FEBS Journal 273 (2006) 1569–1581 ª 2006 The Authors Journal compilation ª 2006 FEBS
6 Schindler C, Shuai K, Prezioso VR & Darnell JE Jr
(1992) Interferon-dependent tyrosine phosphorylation of
a latent cytoplasmic transcription factor. Science 257,
809–813.
7 Fu XY, Schindler C, Improta T, Aebersold R & Darnell
JE Jr (1992) The proteins of ISGF-3, the interferon
alpha-induced transcriptional activator, define a gene
family involved in signal transduction. Proc Natl Acad
Sci USA 89, 7840–7843.
8 Darnell JE Jr (1997) STATs and gene regulation.
Science 277, 1630–1635.
9 Fu XY, Kessler DS, Veals SA, Levy DE & Darnell JE
Jr (1990) ISGF3, the transcriptional activator induced
by interferon alpha, consists of multiple interacting
polypeptide chains. Proc Natl Acad Sci USA 87 , 8555–
8559.
10 Li X, Leung S, Qureshi S & Darnell JE Jr & Stark GR
(1996) Formation of STAT1-STAT2 heterodimers and
their role in the activation of IRF-1 gene transcription
by interferon-alpha. J Biol Chem 271, 5790–5794.
11 Ghislain JJ & Fish EN (1996) Application of genomic
DNA affinity chromatography identifies multiple inter-
feron-alpha-regulated Stat2 complexes. J Biol Chem
271, 12408–12413.
12 Uddin S, Lekmine F, Sassano A, Rui H, Fish EN &
Platanias LC (2003) Role of Stat5 in type I interferon-
signaling and transcriptional regulation. Biochem
Biophys Res Commun 308, 325–330.
13 Leung S, Qureshi SA, Kerr IM & Darnell JE Jr & Stark
GR (1995) Role of STAT2 in the alpha interferon sig-
naling pathway. Mol Cell Biol 15 , 1312–1317.
14 Brierley MM & Fish EN (2005) Functional relevance of
the conserved DNA-binding domain of STAT2. J Biol
Chem 280, 13029–13036.
15 Park C, Li S, Cha E & Schindler C (2000) Immune
response in Stat2 knockout mice. Immunity 13,
795–804.
16 Samuel CE (2001) Antiviral actions of interferons. Clin
Microbiol Rev 14, 778–809.
17 Martensen PM & Justesen J (2004) Small ISGs coming
forward. J Interferon Cytokine Res 24 , 1–19.
18 Ghislain JJ, Wong T, Nguyen M & Fish EN (2001) The
interferon-inducible Stat2:Stat1 heterodimer preferen-
tially binds in vitro to a consensus element found in the
promoters of a subset of interferon-stimulated genes.
J Interferon Cytokine Res 21, 379–388.
19 de Veer MJ, Holko M, Frevel M, Der S, Walker E,
Paranjape JM, Silverman RH & Williams BR (2001)
Functional classification of interferon-stimulated
genes identified using microarrays. J Leukoc Biol 69,
912–920.
20 Der A, Zhou SD, Williams BR & Silverman RH (1998)
Identification of genes differentially regulated by inter-
feron alpha, beta, or gamma using oligonucleotide
arrays. Proc Natl Acad Sci USA 95, 15623–15628.
21 Hannigan GE & Williams BR (1992) Interferon-alpha
activates binding of nuclear factors to a sequence ele-
ment in the c-fos proto-oncogene 5¢-flanking region.
J Interferon Res 12, 355–361.
22 Eilers A, Baccarini M, Horn F, Hipskind RA, Schindler
C & Decker T (1994) A factor induced by differentia-
tion signals in cells of the macrophage lineage binds to
the gamma interferon activation site. Mol Cell Biol 14,
1364–1373.
23 Anderson SL, Carton JM, Lou J, Xing L & Rubin BY
(1999) Interferon-induced guanylate binding protein-1
(GBP-1) mediates an antiviral effect against vesicular
stomatitis virus and encephalomyocarditis virus.
Virology 256, 8–14.
24 Nantais DE, Schwemmle M, Stickney JT, Vestal DJ
& Buss JE (1996) Prenylation of an interferon-
gamma-induced GTP-binding protein: the human gua-
nylate binding protein, huGBP1. J Leukoc Biol 60,
423–431.
25 Heinz S, Haehnel V, Karaghiosoff M, Schwarzfischer L,
Muller M, Krause SW & Rehli M (2003) Species-speci-
fic regulation of Toll-like receptor 3 genes in men and
mice. J Biol Chem 278, 21502–21509.
26 Sultan M, Wigle DA, Cumbaa CA, Maziarz M, Glas-
gow J, Tsao MS & Jurisica I (2002) Binary tree-struc-
tured vector quantization approach to clustering and
visualizing microarray data. Bioinformatics 18 (Suppl.
1), S111–S119.
27 Brown KR & Jurisica I (2005) Online predicted human
interaction database. Bioinformatics 21, 2076–2082.
28 Ahlbom BE, Sidenvall R & Anneren G (1996) Deletion
of chromosome 21 in a girl with congenital hypothyr-
oidism and mild mental retardation. Am J Med Genet
64, 501–505.
29 Bluyssen HA & Levy DE (1997) Stat2 is a transcrip-
tional activator that requires sequence-specific contacts
provided by stat1 and p48 for stable interaction with
DNA. J Biol Chem 272, 4600–4605.
30 Ehret GB, Reichenbach P, Schindler U, Horvath CM,
Fritz S, Nabholz M & Bucher P (2001) DNA binding
specificity of different STAT proteins. Comparison of
in vitro specificity with natural target sites. J Biol Chem
276, 6675–6688.
31 Meyer T, Marg A, Lemke P, Wiesner B & Vinkemeier
U (2003) DNA binding controls inactivation and
nuclear accumulation of the transcription factor Stat1.
Genes Dev 17, 1992–2005.
32 Lubinski JM, Jiang M, Hook L, Chang Y, Sarver C,
Mastellos D, Lambris JD, Cohen GH, Eisenberg RJ &
Friedman HM (2002) Herpes simplex virus type 1
evades the effects of antibody and complement in vivo.
J Virol 76, 9232–9241.
33 Friedman HM (2003) Immune evasion by herpes sim-
plex virus type 1, strategies for virus survival. Trans Am
Clin Climatol Assoc 114, 103–112.
M. M. Brierley et al. ISGF3-independent STAT2-dependent GAS genes
FEBS Journal 273 (2006) 1569–1581 ª 2006 The Authors Journal compilation ª 2006 FEBS 1579
34 Michl P, Buchholz M, Rolke M, Kunsch S, Lohr M,
McClane B, Tsukita S, Leder G, Adler G & Gress TM
(2001) Claudin-4: a new target for pancreatic cancer
treatment using Clostridium perfringens enterotoxin.
Gastroenterology 121, 678–684.
35 Hough CD, Sherman-Baust CA, Pizer ES, Montz FJ,
Im DD, Rosenshein NB, Cho KR, Riggins GJ & Morin
PJ (2000) Large-scale serial analysis of gene expression
reveals genes differentially expressed in ovarian cancer.
Cancer Res 60, 6281–6287.
36 Ross DT, Scherf U, Eisen MB, Perou CM, Rees C,
Spellman P, Iyer V, Jeffrey SS, Van de Rijn M, Walt-
ham M, Pergamenschikov A, Lee JC, Lashkari D, Sha-
lon D, Myers TG, Weinstein JN, Botstein D & Brown
PO (2000) Systematic variation in gene expression pat-
terns in human cancer cell lines. Nat Genet 24, 227–235.
37 Xin H, Pramanik R & Choubey D (2003) Retinoblas-
toma (Rb) protein upregulates expression of the Ifi202
gene encoding an interferon-inducible negative regulator
of cell growth. Oncogene 22, 4775–4785.
38 Choubey D, Li SJ, Datta B, Gutterman JU & Lengyel
P (1996) Inhibition of E2F-mediated transcription by
p202. EMBO J 15, 5668–5678.
39 Wang M, Tan Z, Zhang R, Kotenko SV & Liang P
(2002) Interleukin 24 (MDA-7 ⁄ MOB-5) signals
through two heterodimeric receptors, IL-22R1 ⁄ IL-20R2
and IL-20R1 ⁄ IL-20R2. J Biol Chem 277, 7341–7347.
40 Sauane M, Gopalkrishnan RV, Lebedeva I, Mei MX,
Sarkar D, Su ZZ, Kang DC, Dent P, Pestka S & Fisher
PB (2003) Mda-7 ⁄ IL-24 induces apoptosis of diverse
cancer cell lines through JAK ⁄ STAT-independent path-
ways. J Cell Physiol 196, 334–345.
41 Dumoutier L, Leemans C, Lejeune D, Kotenko SV &
Renauld JC (2001) Cutting edge: STAT activation by
IL-19, IL-20 and mda-7 through IL-20 receptor com-
plexes of two types. J Immunol 167, 3545–3549.
42 Pletnev S, Magracheva E, Kozlov S, Tobin G, Kotenko
SV, Wlodawer A & Zdanov A (2003) Characterization
of the recombinant extracellular domains of human
interleukin-20 receptors and their complexes with inter-
leukin-19 and interleukin-20. Biochemistry 42, 12617–
12624.
43 Sheikh F, Baurin VV, Lewis-Antes A, Shah NK, Smir-
nov SV, Anantha S, Dickensheets H, Dumoutier L,
Renauld JC, Zdanov A, et al. (2004) Cutting edge:
IL-26 signals through a novel receptor complex
composed of IL-20 receptor 1 and IL-10 receptor 2.
J Immunol 172, 2006–2010.
44 Toya M, Hozumi Y, Ito T, Takeda M, Sakane F,
Kanoh H, Saito H, Hiroi M, Kurachi H, Kondo H
et al. (2005) Gene expression, cellular localization and
enzymatic activity of diacylglycerol kinase isozymes in
rat ovary and placenta. Cell Tissue Res 320, 525–533.
45 Banan A, Zhang LJ, Shaikh M, Fields JZ, Choudhary
S, Forsyth CB, Farhadi A & Keshaarzian A (2005)
Theta isoform of protein kinase C alters barrier func-
tion in intestinal epithelium through modulation of
distinct claudin isotypes: a novel mechanism for regu-
lation of permeability. J Pharmacol Exp Ther 31,
962–982.
46 Toivola DM, Tao GZ, Habtezion A, Liao J & Omary
MB (2005) Cellular integrity plus: organelle-related and
protein-targeting functions of intermediate filaments.
Trends Cell Biol 15, 608–617.
47 Costa ML, Escaleira R, Cataldo A, Oliveira F & Mer-
melstein CS (2004) Desmin: molecular interactions and
putative functions of the muscle intermediate filament
protein. Braz J Med Biol Res 37, 1819–1830.
48 Conway AR (2003) genespring (version 6.1), Silicon
Genetics, Redwood City, CA.
49 Quandt K, Frech K, Karas H, Wingender E &
Werner T (1995) MatInd and MatInspector: new fast
and versatile tools for detection of consensus matches
in nucleotide sequence data. Nucleic Acids Res 23,
4878–4884.
Supplementary material
The following material is available for this article
online:
Table S1. Primers used for real-time PCR.
Fig. S1. Characterization of the promoter sequences
and induction levels of a subset of ISGF3-independent
STAT2-dependent ISGs identified by microarray. Left
panels: The indicated genes were differentially induced
in U6A-2, U6A-2VV-II and U6A in response to IFN
and were selected for promoter analysis. Sequenced
1000 bases 5¢ upstream from the transcriptional start
site (TSS) as identified by the gene2promoter pro-
gram were analyzed by the matinspector program to
locate various transcription factor binding sites (see key
at bottom). The nucleotide sequences and specific loca-
tions of ISRE and GAS-like elements are shown relat-
ive to the TSS (indicated as +1). Right panels: The
differential expression of the ISGs on the left was
assessed in IFN-stimulated U6A, U6A-2 and U6A-
2VV-II (VV-II) cells using relative quantitative real-
time PCR. For each sample, b-actin was evaluated as a
reference gene and used for normalization. Histograms
representing the fold induction of gene expression in
IFN-treated versus untreated cells are shown. Values
are the mean ± SE of three independent experiments.
Fig. S2. Characterization of the promoter sequences of
a subset of ISGF3-independent STAT2-dependent
ISGs identified by BSTVQ. The indicated genes were
identified by BSTVQ analysis as differentially induced
in U6A-2, U6A-2VV-II and U6A in response to IFN.
The location of GAS-like elements within the 5¢ flank-
ISGF3-independent STAT2-dependent GAS genes M. M. Brierley et al.
1580 FEBS Journal 273 (2006) 1569–1581 ª 2006 The Authors Journal compilation ª 2006 FEBS
ing regulatory sequences of these genes was determined
using the gene2promoter and matinspector pro-
grams as for Figure S1. The nucleotide sequences and
specific locations of ISRE and GAS-like elements
within these promoter regions are shown relative to
the TSS (+1).
Fig. S3. OPHID analysis of pathway interactions
among IFN-inducible, ISGF3-independent STAT2-
dependent gene products. Proteins are represented as
nodes in the graph and edges correspond to interac-
tions. To aid interpretation, we highlight the identified
proteins as triangles, interferon related proteins as
ovals, and hubs (highly connected components within
the network) as rectangles. All other proteins are rep-
resented as small circles. Color of individual nodes cor-
responds to gene ontology [Ashburner M, Ball CA,
Blake JA, Bolstein D, Butler H, Cherry JM, Davis
AP, Dolinski K, Dwight SS, Eppig JT, et al. (2000)
Gene ontology: tool for unification of biology. The
Gene Ontology Consortium. Nat Genet 25 25–29], as
shown on the legend. Most of the proteins fall into cel-
lular fate and organization, followed by uncharacter-
ized proteins.
This material is available as part of the online article
from
M. M. Brierley et al. ISGF3-independent STAT2-dependent GAS genes
FEBS Journal 273 (2006) 1569–1581 ª 2006 The Authors Journal compilation ª 2006 FEBS 1581