Tài liệu Báo cáo khoa học: Isochore structures in the chicken genome ppt
Bạn đang xem bản rút gọn của tài liệu. Xem và tải ngay bản đầy đủ của tài liệu tại đây (566.3 KB, 12 trang )
Isochore structures in the chicken genome
Feng Gao and Chun-Ting Zhang
Department of Physics, Tianjin University, China
The first draft genome sequence of the red jungle
fowl, Gallus gallus, was published in December 2004.
The chicken (G. gallus) is an important model organ-
ism that bridges the evolutionary gap between mam-
mals and other vertebrates and serves as a main
laboratory model for the $ 9600 extant avian species.
The chicken also represents the first agricultural ani-
mal to have its genome sequenced. Like most bird
species, the chicken has a relatively small genome of
$ 1200 million base pairs, or $ 39% of the size of
the human genome [1].
The nuclear genomes of vertebrates are mosaics of
isochores, very long stretches [> 300 kilobases (kb)] of
DNA that are fairly homogeneous in base composi-
tion. Isochores can be partitioned into a small number
of families that cover a range of GC levels, which is
narrow in cold-blooded vertebrates, but broad in
warm-blooded vertebrates [2,3]. The large-scale vari-
ation in base composition correlates both coding and
noncoding sequences and seems to reflect a fundamen-
tal level of genome organization [4]. This isochore
organization shows marked variation in a number of
important genomic features, including gene density [5],
chromosome bands [6,7], patterns of codon usage [8],
gene length [9], replication timing [10], recombination
rate [11,12], and the distribution of transposable ele-
ments [13]. By in situ hybridization of fractionated
DNA on mitotic and meiotic chromosomes, a com-
positional map of chicken chromosomes has been
obtained and the most gene-rich regions have been
studied [14]. Now, the availability of the complete
chicken genome sequence provides an unprecedented
Keywords
compositional homogeneity; compositional
segmentation; Gallus gallus; isochores;
windowless technique
Correspondence
C T. Zhang, Department of Physics, Tianjin
University, Tianjin 300072, China
Fax: +86 22 27402697
Tel: +86 22 27402987
E-mail:
(Received 13 November 2005, revised 5
January 2006, accepted 14 February 2006)
doi:10.1111/j.1742-4658.2006.05178.x
The availability of the complete chicken genome sequence provides an
unprecedented opportunity to study the global genome organization at the
sequence level. Delineating compositionally homogeneous G + C domains
in DNA sequences can provide much insight into the understanding of the
organization and biological functions of the chicken genome. A new seg-
mentation algorithm, which is simple and fast, has been proposed to parti-
tion a given genome or DNA sequence into compositionally distinct
domains. By applying the new segmentation algorithm to the draft chicken
genome sequence, the mosaic organization of the chicken genome can be
confirmed at the sequence level. It is shown herein that the chicken genome
is also characterized by a mosaic structure of isochores, long DNA seg-
ments that are fairly homogeneous in the G + C content. Consequently,
25 isochores longer than 2 Mb (megabases) have been identified in the
chicken genome. These isochores have a fairly homogeneous G + C con-
tent and often correspond to meaningful biological units. With the aid of
the technique of cumulative GC profile, we proposed an intuitive picture
to display the distribution of segmentation points. The relationships
between G + C content and the distributions of genes (CpG islands, and
other genomic elements) were analyzed in a perceivable manner. The cumu-
lative GC profile, equipped with the new segmentation algorithm, would be
an appropriate starting point for analyzing the isochore structures of
higher eukaryotic genomes.
Abbreviations
SNP, single nucleotide polymorphism.
FEBS Journal 273 (2006) 1637–1648 ª 2006 The Authors Journal compilation ª 2006 FEBS 1637
opportunity to study the global genome organization
at the sequence level.
In this article, we analyzed the isochore structures of
the chicken genome using a new segmentation algo-
rithm [15]. By applying the segmentation algorithm to
24 chicken chromosome sequences, the boundaries of
isochores for each chromosome were obtained, respect-
ively. It was found that the chicken genome is
organized into a mosaic structure of isochores. Conse-
quently, 25 isochores longer than 2 Mb have been
identified, i.e. eight GC-rich isochores and 17 GC-poor
isochores.
Results and discussion
The isochores in the chicken genome
It should be noted that the chicken genome sequence
still contains a large number of gaps (Table 1). In the
case of GGA1, there are 9847 gaps remaining. There-
fore, applying the segmentation algorithm to each frag-
ment will fail to unveil the characteristic of the whole
genome. In order to display the global G + C content
distribution along chromosomes, only gaps > 1% of
the chromosome size were retained; gaps < 1% of the
chromosome size were simply deleted. By applying the
segmentation algorithm to the resulting contigs of each
chromosome, the segmentation points were obtained at
a certain threshold t
0
, respectively. At a given thresh-
old t
0
, the number of resulting segmentation points
can reflect the compositional homogeneity of the
sequences. For instance, the size of GGA6 is similar to
that of GGAZ. At the same threshold t
0
¼ 100, there
are 161 segmentation points in GGA6, while there are
only 58 segmentation points in GGAZ. This indicates
that GGAZ sequence is more homogeneous than
GGA6, and this is also confirmed by Fig. 1. The varia-
tions of the cumulative GC profile for GGA6 are
Table 1. The summary statistics in the chicken genome. The number of isochores longer than 300 kb obtained at t
0
¼ 100 in each chromo-
some is also presented in the table.
Chromosome
Chromosome
size (bp)
Number
of gaps
Percent of
gaps in the
chromosome (%)
G+C
content
(%)
Number of
isochores
1 188 239 860 9847 2.45 39.78 186
2 147 590 765 7333 2.64 39.61 151
3 108 638 738 4411 2.59 39.82 110
4 90 634 903 4122 3.04 39.91 89
5 56 310 377 2599 4.20 40.91 50
6 33 893 787 1531 1.48 41.54 36
7 37 338 262 1505 5.46 41.24 37
8 30 024 636 1252 6.55 41.79 24
9 23 409 228 1145 1.54 42.73 23
10 20 909 726 1233 10.32 42.96 16
11 19 020 054 1395 5.67 41.40 17
12 19 821 895 880 4.10 43.13 17
13 17 279 963 1132 2.87 44.25 12
14 20 603 938 1423 2.21 44.17 20
15 12 438 626 722 1.78 45.10 14
16 239 457 37 25.86 52.55 –
17 10 632 206 832 7.47 47.42 6
18 8919 268 473 1.38 45.67 12
19 9463 882 563 1.57 46.52 5
20 13 506 680 767 1.59 45.60 9
21 6202 554 476 2.61 47.01 5
22 2228 820 90 1.90 43.47 –
23 5666 127 451 12.60 49.72 5
24 5910 111 475 2.25 49.08 6
26 4255 270 369 16.05 50.62 –
27 2668 888 325 6.68 49.13 –
28 4731 479 542 17.09 47.91 1
32 1018 878 115 2.88 52.71 –
W 4916 845 629 18.89 38.81 –
Z 33 651 169 4843 9.14 39.46 30
Isochores in the chicken genome F. Gao and C T. Zhang
1638 FEBS Journal 273 (2006) 1637–1648 ª 2006 The Authors Journal compilation ª 2006 FEBS
much larger than those of the cumulative GC profile
for GGAZ.
Here, t
0
was chosen with the aid of the cumulative
GC profile and the density distribution of CpG
islands. For example, there are 14, 20, and 148 seg-
mentation points obtained on GGA14 with t
0
set at
1000, 500, and 100, respectively. As shown in Fig. 2,
the domains obtained can delineate the variations of
the cumulative GC profile and the density distribution
of CpG islands more and more accurately with
decreasing t
0
. On the other hand, a smaller t
0
leads to
more segmentation points and shorter segmented sub-
sequences. Similar procedures were carried out for
macrochromosomes, intermediate chromosomes and
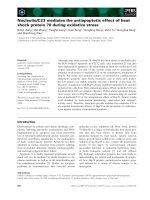
Fig. 1. The negative cumulative GC profiles for the chicken genome. The gaps in the chicken chromosome sequences are left empty in the
curves. Note that sharp peaks correspond to the sites where G + C content undergoes abrupt changes, from GC-rich regions to GC-poor
regions, and vice versa, indicating a mosaic structure of the chromosomes. A jump in the Àz
0
n
curve indicates an increase of the G + C con-
tent; whereas a drop down in the Àz
0
n
curve indicates a decrease of the G + C content. An approximate straight region in the Àz
0
n
curve
implies that the G + C content in this region is roughly constant.
F. Gao and C T. Zhang Isochores in the chicken genome
FEBS Journal 273 (2006) 1637–1648 ª 2006 The Authors Journal compilation ª 2006 FEBS 1639
sex chromosome Z, respectively. Consequently, for
macrochromosomes, intermediate chromosomes and
sex chromosome Z, the threshold t
0
is set to 1000 to
partition these chromosomes into compositionally dis-
tinct domains. For microchromosomes, which are
much smaller and contain higher density of CpG
islands and genes, t
0
¼ 500 is adopted in order to
reflect more details. Finally, t
0
¼ 100 is used as a
threshold to identify isochores in the chicken genome.
Here, the region from 12 579 268–13 821 432 nucleo-
tide on GGA14 was deemed as an isochore.
The distributions of length and G + C content are
presented in Fig. 3, based on all the segments obtained
at t
0
¼ 100 without the constraint of the minimum
length. It can be seen that the length distribution is
notably skewed, with the highest value being 10.5 Mb,
corresponding to a region with high-repeat density and
low-gene density on GGA1. The G + C content distri-
bution is also highly skewed, with a long tail of
GC-rich regions. It should be noted that the view of
the chicken genome we now have from the sequence
may still be a compositionally biased one, as some of
the most GC-rich, CpG-island-rich regions, namely
several microchromosomes such as chromosomes 25,
29, 30, or 31, are essentially missing from the sequence
in the currently available chicken genome draft.
Consequently, 25 isochores longer than 2 Mb (exclu-
ding gaps) were identified (Table 2), i.e. eight GC-rich
isochores and 17 GC-poor isochores. In general, GC-
rich isochores tend to be shorter than GC-poor ones.
The classification of isochores adopted here was pro-
posed by Zhang and Zhang [16], which is based on the
relative magnitude of the G + C content of isochores
with respect to the genomic G + C content. Accord-
ing to this classification, the G + C content of GC-
rich isochores (GC-poor isochores) is higher (lower)
than the genomic G + C content.
Biological implications of isochores
With the aid of the technique of cumulative GC pro-
file, we proposed an intuitive picture to display the dis-
tribution of segmentation points. The relationships
between G + C content and the distributions of genes
(CpG islands, and other genomic elements) can be an-
alyzed in a perceivable manner. The cumulative GC
profile is also called the z
0
n
curve, which is a discrete
function of the nucleotide position n in a genome or
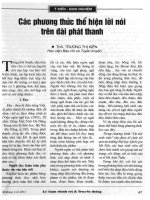
Fig. 2. The negative cumulative GC profile for GGA14 marked with
the segmentation points obtained. The bottom four plots show the
distributions of the G + C content and CpG islands along chicken
chromosome 14, respectively. The G + C contents are calculated
for the domains segmented at t
0
¼ 1000, 500, and 100, respect-
ively. Note that the distribution of CpG islands is closely correlated
with the segmented regions with distinct G + C content. The nota-
tion used here is described as follows. Besides the position coordi-
nates, the order of occurrence for each point in the segmentation
process is also labeled in the figure. We used ‘f’, ‘l’, ‘r’, and an inte-
ger to label the order of occurrence, where f denotes the first point
occurring during the course of segmentation, and l and r denote
that the point occurs in the left and right subsequence, respect-
ively. The integer denotes the times of segmentation. For example,
in point 12579268-rl
2
4, the first part, 12579268, is the position
coordinate. The second part, rl
2
4, denotes the order of occurrence.
The last integer, 4, in the second part means that this point occurs
after four segmentations. In the symbol rl
2
, l appears twice, so we
used ‘l
2
’ instead of ‘ll’ for convenience. Also note that the coordi-
nate value of each segmentation point has been corrected by tak-
ing the gap length into account. For instance, there is a gap
occurring at n
0
fi n
0
+ D, where D is the gap length. If a segmen-
tation point obtained is situated at n,andn > n
0
, then the actual
coordinate of n adopted in this plot is n + D. Meanwhile, the gap
region n
0
fi n
0
+ D is represented by a blank interval in this plot.
Here, n
0
and n are the relative coordinates with respect to the con-
tig without gaps. Other gaps are dealt with using similar procedure.
Isochores in the chicken genome F. Gao and C T. Zhang
1640 FEBS Journal 273 (2006) 1637–1648 ª 2006 The Authors Journal compilation ª 2006 FEBS
chromosome. Before studying the features of the
cumulative GC profiles of the chicken genome, some
basic characteristics of the cumulative GC profile need
to be addressed. It was shown that the average G + C
content of a genome or chromosome at position
n fi n + Dn is calculated by
G þ C / DðÀz
0
n
Þ=Dn [16].
Therefore, a jump in the Àz
0
n
curve indicates an
increase of the G + C content; whereas a drop down
in the Àz
0
n
curve indicates a decrease of the G + C
content. An approximate straight region in the Àz
0
n
curve implies that the G + C content in this region is
roughly constant. In addition, the segmentation point
obtained here is exactly a turning point of the G + C
content, which corresponds to an extreme point in the
cumulative GC profile [15]. Therefore, the segmenta-
tion coordinates may be used to annotate the related
cumulative GC profile, presenting researchers an intu-
itive picture. Consequently, the coordinates of segmen-
tation points for 24 chicken chromosome sequences
were labeled on the cumulative GC profiles, which are
accessible at />Analysis of the identified isochores showed that
these isochores correspond to an approximately
straight line in the –z’ curves, a reflection of the fact
that the G + C contents in these regions are fairly
homogenous. We also found that these regions often
correspond to meaningful biological units. For exam-
ple, at t
0
¼ 100 level, only three segmented domains
(isochores 4, 8 and 9 in Table 2) longer than 4 Mb
were identified on GGA1. These domains are located
on the long arm of GGA1, corresponding to regions
with high-repeat density and low-gene density [17].
For two of them (isochores 8 and 9 in Table 2),
only approximate coordinates between 140 and
160 Mb were given in [17]. Here, the precise bound-
aries, sizes, and G + C contents of these isochores
have been determined using the present method
(Table 2).
As shown in Figs 2, 4 and 5, the obtained segmenta-
tion points have clear biological implications. Note
that the distribution of CpG islands is closely correla-
ted with the segmented regions with distinct G + C
content. We therefore investigated the correlation
between the G + C content of isochores and the dis-
tribution of CpG islands throughout the chicken gen-
ome (Fig. 6). With t
0
¼ 100, only a total of 811
segments longer than 300 kb were considered as iso-
chores, according to our definition of an isochore
(Table 1). It was shown that there are positive and
highly significant correlations between the G + C con-
tent of these isochores and the corresponding density
distribution of CpG islands (R ¼ 0.82, P < 0.001).
The positive correlation between the G + C content
and the density distribution of CpG islands is a well-
known fact. It is therefore worth pointing out that the
segmentation points obtained here are exactly the
boundaries of the related regions. For example, there
is an abrupt increase (decrease) of the density of CpG
islands at the first (second) boundary of the short
GC-rich region between 15 908 133 and 16 385 348
nucleotide on GGA12 (Fig. 4). Similar phenomena are
observed in other G + C distinct regions.
The precise boundary coordinates obtained by the
segmentation algorithm and the associated cumulative
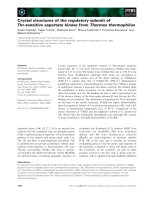
Fig. 3. Histogram of length and G + C content based on all the seg-
ments obtained at t
0
¼ 100 without the constraint of the minimum
length in the draft genome sequence of chicken. (A) The length dis-
tribution of all the obtained segments. The length distribution is
notably skewed, with the highest value being 10.5 Mb, correspond-
ing to a region with high-repeat density and low-gene density on
GGA1. (B) The G + C content distribution of all the obtained seg-
ments. It shows that the G + C content distribution is also highly
skewed, with a long tail of GC-rich regions.
F. Gao and C T. Zhang Isochores in the chicken genome
FEBS Journal 273 (2006) 1637–1648 ª 2006 The Authors Journal compilation ª 2006 FEBS 1641
GC profile provide a useful platform to analyze a gen-
ome or chromosome. For instance, any gene-finding
algorithm would benefit from these boundary coordi-
nates. To gain better gene-finding results, different
parameters would be adopted in a gene-finding algo-
rithm by considering different regions of distinct
G + C content with precise boundary coordinates. In
[1], an evidence-based system (Ensembl [18]) and two
comparative gene prediction methods (twinscan [19]
and SGP-2 [20]) were applied to chicken gene predic-
tion, and the overall performances of these methods
have been evaluated in terms of sensitivity and specific-
ity indices. Here, the distribution of gene density is an-
alyzed based on the prediction results, respectively. We
can see from Fig. 4 that the density distribution of the
predicted genes is also correlated with the segmented
regions with distinct G + C content. Based on the
cumulative GC profile, the performance of these meth-
ods even can be assessed for a certain region in an
intuitive form. As gene density is positively correlated
with G + C content and CpG island density, it seems
that the gene density predicted by SGP-2 is more rea-
sonable than that predicted by Ensembl and twinscan
at the region between 15 908 133 and 16 385 348
nucleotide on GGA12, based on Fig. 4.
The obtained isochore map can also be displayed in
the UCSC Genome Browser as a custom track, together
with a series of tracks aligned with the genomic sequence
[21]. As an example, the top track in Fig. 5 shows the
isochore structure of chicken chromosome 28, integra-
ted with comprehensive genome information, such as
the G + C content, isochores from Pennsylvania State
University (PSU) [22], gene density predicted by
Ensembl, CpG islands, best alignments with the human
genome, single nucleotide polymorphisms (SNPs) and
repeat densities. This graphical interface allows rapid
visual inspection of the correlation of different types of
information [21]. Note that the density distributions of
CpG islands and genes are correlated with the segmen-
ted regions with distinct G + C content. Here, the
region from 2 021 043 to 2 644 230 nucleotide was
deemed as an isochore (with length ¼ 623 kb), which is
the longest region among the obtained segments on
GGA28. The G + C content of this isochore is 37.08%,
the lowest G + C content among the identified iso-
chores. It is clearly shown that this isochore corresponds
to a desert region of genes ⁄ CpG islands ⁄ SNPs and con-
tains high-density simple tandem repeats. It can also be
seen from Fig. 5 that our result is more reasonable than
that obtained from PSU. The isochore data from PSU
Table 2. The identified isochores longer than 2 Mb (excluding gaps) in the chicken genome at t
0
¼ 100. nt, nucleotide.
Number Chromosome Type Start (nt) End (nt) Length (Mb) G + C content (%)
1 1 GC 26 077 602 28 181 264 2.1 40.29
2 1 GC 29 988 573 32 824 401 2.8 42.06
3 1 AT 37 805 223 39 913 801 2.1 35.28
4 1 AT 87 214 801 91 955 853 4.7 36.47
5 1 GC 116 177 050 118 308 306 2.1 40.30
6 1 AT 118 535 967 120 790 329 2.3 35.54
7 1 AT 133 030 407 135 339 653 2.3 36.35
8 1 AT 139 198 420 149 661 748 10.5 36.49
9 1 AT 153 131 387 157 455 517 4.3 36.60
10 1 GC 160 813 722 163 314 397 2.5 42.54
11 1 GC 170 242 840 172 762 689 2.5 41.68
12 2 AT 37 000 568 39 401 689 2.4 39.29
13 2 AT 53 100 091 55 916 444 2.8 39.24
14 2 AT 69 341 958 74 887 195 5.5 35.92
15 2 AT 92 103 722 95 811 433 3.7 35.70
16 3 GC 4284 124 6535 663 2.3 41.23
17 4 AT 5305 442 7838 037 2.5 35.35
18 4 AT 41 074 838 43 335 895 2.3 35.76
19 4 AT 70 251 475 73 231 218 3.0 35.31
20 4 AT 77 338 564 82 572 558 5.2 38.63
21 10 AT 4970 289 8586 236 3.6 39.28
22 13 AT 1821 731 4511 591 2.7 37.54
23 Z AT 17 296 997 19 878 666 2.6 38.83
24 Z GC 23 595 353 27 731 946 4.1 41.94
25 Z GC 27 740 090 30 058 946 2.3 39.48
Isochores in the chicken genome F. Gao and C T. Zhang
1642 FEBS Journal 273 (2006) 1637–1648 ª 2006 The Authors Journal compilation ª 2006 FEBS
were generated based on the methods described in
[22], in which a measure, compositional heterogeneity
(or variability) index, was proposed to compare the dif-
ferences in compositional heterogeneity between long
genomic sequences. It seems that there is something
wrong with the boundary coordinates of the isochores
identified from PSU. For example, the region from
1 935 001 to 2 075 000 nucleotide was deemed as an
isochore in the result from PSU, while both the cumula-
tive GC profile for GGA28 (Fig. 1) and G + C content
in five-base windows clearly showed an abrupt change
in the G + C content within this region.
Based on the present method, other chicken chromo-
somes were also analyzed, the detailed analysis for
which is accessible at />The program of the new segmentation algorithm is
also available on request.
Comparison with the other segmentation
algorithms
Traditionally, the G + C content distribution of a
genome is usually assessed by computing the G + C
content in sliding windows moving along the genome.
Fig. 4. The negative cumulative GC profile
for GGA12 marked with the segmentation
points obtained. The bottom five plots show
the distributions of G + C content, genes
and CpG islands along chicken chromosome
12, respectively. Here, the distribution of
gene density is plotted based on the predic-
ted results by SGP-2, Ensembl and
TWINSCAN, respectively. Note that the density
distributions of the predicted genes are also
correlated with the segmented regions with
distinct G + C content. However, it seems
that the gene density predicted by SGP-2 is
more reasonable than that predicted by
Ensembl and
TWINSCAN at the region
between 15 908 133 and 16 385 348
nucleotides, respectively. The notation used
here is the same as that in Fig. 2. For the
details about the notation, refer to the
legend of Fig. 2. Also note that there are a
number of larger or smaller gaps in GGA12.
Here, only gaps >1% of the chromosome
size were retained; gaps <1% of the
chromosome size were simply deleted.
Consequently, GGA12 was split into two
contigs. The superscript in front of the
position coordinates is used to denote
which contig the segmentation point
belongs to.
F. Gao and C T. Zhang Isochores in the chicken genome
FEBS Journal 273 (2006) 1637–1648 ª 2006 The Authors Journal compilation ª 2006 FEBS 1643
Fig. 5. UCSC Genome Browser on chicken chromosome 28 with our own custom annotation track. The top track shows the obtained iso-
chore map integrated with comprehensive genome information, such as the G + C content, isochores from Pennsylvania State University,
gene density predicted by Ensembl, CpG islands, best alignments with the human genome, single nucleotide polymorphisms (SNPs) and
repeat densities. Here, the obtained segments longer than 50 kb at t
0
¼ 100 are displayed at the UCSC Genome Browser as a custom track.
These segments are represented by rectangular blocks, and the corresponding G + C contents are labeled on the left of the segments. Seg-
ments with higher G + C content are more darkly shaded. The precise boundary coordinates can be found at />The region from 2021 043 to 2644 230 nucleotide was identified as an isochore, with the lowest G + C content (37.08%) among the
obtained segments on GGA28. It is clearly shown that this isochore corresponds to a desert region of genes ⁄ CpG islands ⁄ SNPs and
contains high-density simple tandem repeats. Note that there are abrupt changes in the density distributions of CpG islands, genes and other
elements at the boundaries of this isochore identified by the present algorithm.
Isochores in the chicken genome F. Gao and C T. Zhang
1644 FEBS Journal 273 (2006) 1637–1648 ª 2006 The Authors Journal compilation ª 2006 FEBS
The disadvantage of this routinely used window-based
method is that the resolution is low, e.g. the method is
not sensitive in detecting the small changes in the
G + C content. In addition, the distribution pattern
of G + C content obtained is largely dependent on
the window size.
Historically, other windowless methods have been
developed to calculate the G + C content, which are
usually given the name of ‘segmentation of DNA
sequences’. Among them, the methods of entropic seg-
mentation [23,24], hidden Markov model [25,26] and
wavelet shrinkage technique [27] should be mentioned.
The advantages and disadvantages of the latter two
methods were discussed in [28]. As the entropic seg-
mentation algorithm is widely used to find segmenta-
tion points for various genomes, one may wonder if
the two algorithms (the entropic and our algorithm)
result in the same or different results. Therefore, it is
interesting to compare the two segmentation algo-
rithms. Here, we focus the comparison only with the
entropic segmentation algorithm. Both segmentation
algorithms possess the highest resolution (single nuc-
leotide accuracy). By applying the new algorithm to
the chicken chromosome sequences, the coordinates of
segmentation points obtained are completely identical
to those derived from the entropic segmentation algo-
rithm (data not shown here).
Compared with the entropic segmentation algorithm,
the new algorithm has a series of merits. First, the new
algorithm is simpler and faster than the entropy-based
algorithm. Secondly, the new algorithm is based on the
genome order index S , which has a clear geometrical
meaning, i.e. it is a square of a Euclidean distance [29].
Thirdly, S possesses clear biological implications, e.g.
S usually has different values in coding and noncoding
regions, which has been used to recognize protein-cod-
ing genes in the budding yeast genome [30]. Finally,
the new segmentation algorithm is superior to the
entropic one in that the former is able to provide an
intuitive picture by incorporating with the Z-curve rep-
resentation of DNA sequences [31]. The segmentation
point obtained here is exactly a turning point of the
G + C content, which corresponds to an extreme
point in the cumulative GC profile. Consequently, we
may use the segmentation coordinates to annotate the
related cumulative GC profile, presenting researchers
with an intuitive picture.
Conclusions
Delineating compositionally homogeneous G + C
domains in DNA sequences can provide much insight
into the understanding of the organization and biologi-
cal functions of a given genome. Compositionally
homogeneous segments of genomic DNA have been
shown to correlate to a number of important genomic
features. Furthermore, quantitative analysis of compo-
sitional heterogeneity reveals the statistical properties
of DNA sequences, which is useful to locate the origin
and terminus of replication in bacterial [32] and archa-
eal [33] genomes, and detect horizontally transferred
genes and genomic islands [28].
In this paper, it has been shown that the chicken
genome is organized into a mosaic structure of iso-
chores. A new algorithm has been applied to segment
24 chicken chromosome sequences, and the boundaries
of isochores obtained for each chromosome have been
determined precisely.
In summary, the cumulative GC profile marked with
the coordinates of resulting segmentation points is a
useful tool for genome analysis. This leads to a neat
graphical representation of G + C content variations
along a genome or chromosome, and a clear-cut defini-
tion of isochores. This technique allowed us to
show ⁄ confirm that GC-rich isochores in a chicken
chromosome have higher gene and CpG-islands densi-
ties than AT-rich isochores. Although these are well-
known characteristics of isochores of the vertebrate
organisms, the advantage of the technique is that an
investigator is able to study all of these in a perceiv-
able and precise manner. We believe that a plot similar
to Fig. 4 could become a common tool for analyzing
Fig. 6. Correlation between the G + C content of isochore and the
density distribution of CpG islands. With t
0
¼ 100, only a total of
811 segments longer than 300 kb were considered as isochores
according to the definition of isochore. Consequently, the correl-
ation coefficient and equation of the linear regression line were
given in the plot. It shows there are positive and highly significant
correlations between the G + C content of these isochores and the
corresponding density distribution of CpG islands (R ¼ 0.82,
P < 0.001).
F. Gao and C T. Zhang Isochores in the chicken genome
FEBS Journal 273 (2006) 1637–1648 ª 2006 The Authors Journal compilation ª 2006 FEBS 1645
the G + C content variations for any genome or chro-
mosome. For higher eukaryotic genomes, the cumula-
tive GC profile equipped with the new segmentation
algorithm would be an appropriate starting point for
analyzing their isochore structures.
Experimental procedures
The draft chicken genome sequence, release galGal2, and
its associated annotation files, such as the data of gene,
CpG island, SNPs, isochores from PSU, best alignments
with the human genome and so on, were downloaded from
In the present study, we follow the
convention of the International Chicken Genome Sequen-
cing Consortium (ICGSC 2004) by classifying chicken chro-
mosomes into three classes: five macrochromosomes
(GGA1-5), five intermediate chromosomes (GGA6-10) and
28 microchromosomes (GGA11-38). Here, sex chromosome
W and microchromosomes smaller than GGA28 were
excluded from the study. Our analysis of the distributions
of G + C content, CpG islands, and genes was only
restricted to the remaining 24 chromosomes. The densities
of CpG islands and genes were calculated in 100 kb long,
nonoverlapping windows.
A new segmentation algorithm of DNA
sequences
The genome order index S is defined by
S ¼ SðPÞ¼a
2
þ c
2
þ g
2
þ t
2
ð1Þ
where a, c, g and t denote the occurrence frequencies of
A, C, G and T, respectively, in a genome or a DNA
sequence. The genome order index S defined in Eqn 1 is
a useful statistical quantity to reflect the compositional
characteristics of a genome [29], which can serve as an
appropriate divergence measure to quantify the composi-
tional difference between two DNA sequences [15]. The
new segmentation algorithm proposed here is based on
the quadratic divergence (see Eqn 2). Consider a genome
with N bases. Let n be an integer, 2 £ n £ N – 1. For a
given n, the genome sequence is partitioned into two sub-
sequences, one left and the other right. Let w
1
¼ n ⁄ N
and w
2
¼ (N ) n) ⁄ N. Let P
l
¼ (a
l
,c
l
,g
l
,t
l
) and P
r
¼
(a
r
,c
r
,g
r
,t
r
), where a
l
,c
l
,g
l
,t
l
and a
r
,c
r
,g
r
,t
r
are the occur-
rence frequencies of bases A, C, G and T in the left and
right subsequences, respectively. Thus,
DSðP
l
; P
r
Þ¼ðn=NÞSðP
l
Þþ½ðN À nÞ=NSðP
r
Þ
À Sfðn= NÞP
l
þ½ðN À nÞ=NP
r
g; ð2Þ
where S(P) is defined by Eqn 1. If we suppose that n*isa
position, at which DS(P
l
,P
r
) reaches maximum, then n*is
a compositional segmentation point of the genome first
found. The new algorithm is also recursive, as in [23] and
[24], i.e. after n* is determined, the same procedure is
applied to both the resulting left and right subsequences,
respectively. The procedure should be applied recursively
until DS(P
l
,P
r
) is less than a given threshold.
However, a question which needs to be answered is the
halting condition of the segmentation algorithm. This is
done by defining a halting parameter, t
t ¼ N Â DSðP
l
; P
r
Þð3Þ
where N is the length of sequence or subsequence to be seg-
mented. If t < t
0
, the segmentation procedure halts, other-
wise, the procedure continues until t < t
0
. As we are only
interested in segmenting concrete genomes, the choice of t
0
is based on a heuristic consideration. A larger threshold t
0
leads to less segmentation points and longer segmented sub-
sequences, whereas a smaller threshold t
0
leads to more seg-
mentation points and shorter segmented subsequences. For
an obtained segmentation point, it is important to know
whether the halting parameter value is significantly different
from that of a random sequence. In order to halt the seg-
mentation at different significance levels, we estimated the
distribution of the halting parameter based on 100 000 ran-
dom sequences with length of 1 Mb. For each of these
sequences, we calculated a halting parameter for the first
point occurring during the course of segmentation and
obtained thus 100 000 numbers. Consequently, cumulative
frequency and counts were plotted against the halting
parameter, respectively (Fig. 7). For example, if the signifi-
cance level is 5% then t
0
corresponds to 6.194. However, a
much more stringent stopping criterion is actually required
in most cases. It should be noted that in some cases the
segmentation procedure also halts when the resulting subse-
quence is shorter than a given minimum length. Here, we
choose 3000 nucleotide as the minimum length according to
a requirement imposed by the experimental characterization
of isochores through DNA centrifugation [3]. In general,
the choice of t
0
and the minimum length is heuristic and
must be determined on a case by case basis [15].
Cumulative GC profile
z
n
is defined as
z
n
¼ðA
n
þ T
n
ÞÀðC
n
þ G
n
Þ;n ¼ 0; 1;2; :::; N;z
n
2½ÀN; N; ð4Þ
where A
n
, C
n
, G
n
, and T
n
are the cumulative numbers of
the bases A, C, G and T, respectively, occurring in the
subsequence from the first base to the n-th base in the
DNA sequence inspected. Here, z
n
is one of the compo-
nents of the Z-curve, which is a three dimensional curve
that uniquely represents a DNA sequence [34,35]. Usu-
ally, for an AT-rich (GC-rich) genome, z
n
is approxi-
mately a monotonously increasing (decreasing) linear
function of n. To amplify the deviations of z
n
, the curve
of z
n
$ n is fitted by a straight line using the least
squares technique,
Isochores in the chicken genome F. Gao and C T. Zhang
1646 FEBS Journal 273 (2006) 1637–1648 ª 2006 The Authors Journal compilation ª 2006 FEBS
z ¼ kn ð5Þ
where (z, n) is the coordinate of a point on the straight line
fitted and k is its slope. Instead of using the curve of
z
n
$ n, we will use the z’ curve, or cumulative GC profile,
hereafter, where
z
0
n
¼ z
n
À kn: ð6Þ
If we let
G þ C denote the average G + C content within a
region Dn in a sequence, we find, from Eqns 4, 5 and 6:
G þ C ¼
1
2
1 À k À
Dz
0
n
Dn
1
2
ð1 À k À k
0
Þ; ð7Þ
where k
0
¼ Dz
0
n
=Dn is the average slope of the z’ curve
within the region Dn. The region Dn is usually chosen to be
a fragment of a natural DNA sequence, e.g. an isochore.
The method above, used to calculate G + C content, is
called a windowless technique [36]. The cumulative GC
profile can also provide a qualitative view of genome
organization in an intuitive manner, by which isochores or
genomic islands can be identified directly by eye [16,28].
Consequently, the cumulative GC profiles were plotted for
24 chromosomes of the chicken genome, respectively
(Fig. 1). Note that the cumulative GC profile is not the
G + C content itself, rather, the derivative of the cumula-
tive GC profile with respect to the base position n is
negatively proportional to the G + C content at the
given position, i.e. G + C µ ) dz¢⁄dn. Therefore, the
average slope of the cumulative GC profile within a region
reflects the average G + C content of the sequence within
this region.
We should point out that the method of cumulative GC
profile (z¢-curve method) shares some basic features with
the cusum method, that is, both are based on the cumula-
tive calculation. However, there are still some differences
between the two methods, as reflected by the fact that the
former is only designed for genome analysis, whereas the
latter is a general one, suitable for econometrics and time-
series analysis, etc.
Acknowledgements
We are grateful to the referees for their constructive
comments, which were very important in strengthening
the presentation of the paper. We would like also to
thank Drs. R. Zhang and L L. Chen for invaluable
assistance. Suggestions for writing the manuscript from
Feng-Biao Guo and Wen-Xin Zheng are gratefully
acknowledged. The present work was supported in
part by National Natural Science Foundation of China
Grant no. 90408028.
References
1 Hillier LW, Miller W, Birney E, Warren W, Hardison
RC, Ponting CP, Bork P, Burt DW, Groenen MA,
Delany ME et al. (2004) Sequence and comparative
analysis of the chicken genome provide unique
perspectives on vertebrate evolution. Nature 432, 695–
716.
2 Bernardi G (1995) The human genome: organization
and evolutionary history. Annu Rev Genet 29, 445–
476.
3 Bernardi G (2000) Isochores and the evolutionary
genomics of vertebrates. Gene 241, 3–17.
4 Eyre-Walker A & Hurst LD (2001) The evolution of
isochores. Nat Rev Genet 2, 549–555.
5 Zoubak S, Clay O & Bernardi G (1996) The gene distri-
bution of the human genome. Gene 174, 95–102.
Fig. 7. Cumulative frequency distribution of halting parameter esti-
mated from 100 000 random sequences. The distribution of the
halting parameter for the first point occurring during the course of
segmentation was estimated based on 100 000 random sequences
with a length of 1 Mb. Cumulative frequency and counts are plot-
ted against halting parameter, respectively. The X-axis shows var-
ious intervals of halting parameter values. The Y-axis in the upper
panel shows the cumulative percentage of the values at or below
each interval. The Y-axis in the lower panel shows the number of
sequences scoring within the interval. Consequently, segmentation
procedure can be halted at different significance levels. For exam-
ple, if a significance level of 5% is adopted, t
0
should be equal to
6.194, as indicated in the figure.
F. Gao and C T. Zhang Isochores in the chicken genome
FEBS Journal 273 (2006) 1637–1648 ª 2006 The Authors Journal compilation ª 2006 FEBS 1647
6 Saccone S, De Sario A, Della Valle G & Bernardi G
(1992) The highest gene concentrations in the human
genome are in telomeric bands of metaphase chromo-
somes. Proc Natl Acad Sci USA 89, 4913–4917.
7 Saccone S, De Sario A, Wiegant J, Raap AK, Della
Valle G & Bernardi G (1993) Correlations between iso-
chores and chromosomal bands in the human genome.
Proc Natl Acad Sci USA 90, 11929–11933.
8 Sharp PM, Averof M, Lloyd AT, Matassi G & Peden JF
(1995) DNA sequence evolution: the sounds of silence.
Philos Trans R Soc Lond B Biol Sci 349, 241–247.
9 Duret L, Mouchiroud D & Gautier C (1995) Statistical
analysis of vertebrate sequences reveals that long genes
are scarce in GC-rich isochores. J Mol Evol 40, 308–317.
10 Tenzen T, Yamagata T, Fukagawa T, Sugaya K, Ando
A, Inoko H, Gojobori T, Fujiyama A, Okumura K &
Ikemura T (1997) Precise switching of DNA replication
timing in the GC content transition area in the human
major histocompatibility complex. Mol Cell Biol 17,
4043–4050.
11 Eisenbarth I, Vogel G, Krone W, Vogel W & Assum G
(2000) An isochore transition in the NF1 gene region
coincides with a switch in the extent of linkage disequili-
brium. Am J Hum Genet 67, 873–880.
12 Fullerton SM, Bernardo Carvalho A & Clark AG
(2001) Local rates of recombination are positively corre-
lated with GC content in the human genome. Mol Biol
Evol 18, 1139–1142.
13 Smit AF (1999) Interspersed repeats and other memen-
tos of transposable elements in mammalian genomes.
Curr Opin Genet Dev 9, 657–663.
14 Andreozzi L, Federico C, Motta S, Saccone S, Sazano-
va AL, Sazanov AA, Smirnov AF, Galkina SA, Lukina
NA, Rodionov AV et al. (2001) Compositional mapping
of chicken chromosomes and identification of the gene-
richest regions. Chromosome Res 9, 521–532.
15 Zhang CT, Gao F & Zhang R (2005) Segmentation
algorithm for DNA sequences. Phys Rev E 72, 041917.
16 Zhang CT & Zhang R (2004) Isochore structures in the
mouse genome. Genomics 83, 384–394.
17 Wicker T, Robertson JS, Schulze SR, Feltus FA,
Magrini V, Morrison JA, Mardis ER, Wilson RK,
Peterson DG, Paterson AH et al. (2005) The repetitive
landscape of the chicken genome. Genome Res 15,
126–136.
18 Curwen V, Eyras E, Andrews TD, Clarke L, Mongin E,
Searle SM & Clamp M (2004) The Ensembl automatic
gene annotation system. Genome Res 14, 942–950.
19 Flicek P, Keibler E, Hu P, Korf I & Brent MR (2003)
Leveraging the mouse genome for gene prediction in
human: from whole-genome shotgun reads to a global
synteny map. Genome Res 13, 46–54.
20 Parra G, Agarwal P, Abril JF, Wiehe T, Fickett JW &
Guigo R (2003) Comparative gene prediction in human
and mouse. Genome Res 13, 108–117.
21 Karolchik D, Baertsch R, Diekhans M, Furey TS, Hin-
richs A, Lu YT, Roskin KM, Schwartz M, Sugnet CW,
Thomas DJ et al. (2003) The UCSC Genome Browser
Database. Nucleic Acids Res 31, 51–54.
22 Nekrutenko A & Li WH (2000) Assessment of composi-
tional heterogeneity within and between eukaryotic gen-
omes. Genome Res 10, 1986–1995.
23 Oliver JL, Bernaola-Galvan P, Carpena P & Roman-
Roldan R (2001) Isochore chromosome maps of eukar-
yotic genomes. Gene 276, 47–56.
24 Li W, Bernaola-Galvan P, Haghighi F & Grosse I
(2002) Applications of recursive segmentation to the
analysis of DNA sequences. Comput Chem 26, 491–
510.
25 Churchill GA (1992) Hidden Markov chains and the
analysis of genome structure. Comput Chem 16, 107–
115.
26 Peshkin L & Gelfand MS (1999) Segmentation of yeast
DNA using hidden Markov models. Bioinformatics 15,
980–986.
27 Lio P & Vannucci M (2000) Finding pathogenicity
islands and gene transfer events in genome data. Bio-
informatics 16, 932–940.
28 Zhang R & Zhang CT (2004) A systematic method to
identify genomic islands and its applications in analyz-
ing the genomes of Corynebacterium glutamicum and
Vibrio vulnificus CMCP6 chromosome I. Bioinformatics
20, 612–622.
29 Zhang CT & Zhang R (2004) A nucleotide composition
constraint of genome sequences. Comput Biol Chem 28,
149–153.
30 Zhang CT & Wang J (2000) Recognition of protein
coding genes in the yeast genome at better than 95%
accuracy based on the Z curve. Nucleic Acids Res 28,
2804–2814.
31 Zhang CT, Zhang R & Ou HY (2003) The Z curve
database: a graphic representation of genome sequences.
Bioinformatics 19, 593–599.
32 Lobry JR (1996) A simple vectorial representation of
DNA sequences for the detection of replication origins
in bacteria. Biochimie 78, 323–326.
33 Zhang R & Zhang CT (2004) Identification of replica-
tion origins in archaeal genomes based on the Z-curve
method. Archaea 1, 335–346.
34 Zhang CT & Zhang R (1991) Analysis of distribution of
bases in the coding sequences by a diagrammatic techni-
que. Nucleic Acids Res 19, 6313–6317.
35 Zhang R & Zhang CT (1994) Z curves, an intuitive tool
for visualizing and analyzing the DNA sequences. J Bio-
mol Struct Dyn 11, 767–782.
36 Zhang CT, Wang J & Zhang R (2001) A novel method
to calculate the G + C content of genomic DNA
sequences. J Biomol Struct Dyn 19, 333–341.
Isochores in the chicken genome F. Gao and C T. Zhang
1648 FEBS Journal 273 (2006) 1637–1648 ª 2006 The Authors Journal compilation ª 2006 FEBS