task 1 line graph
Bạn đang xem bản rút gọn của tài liệu. Xem và tải ngay bản đầy đủ của tài liệu tại đây (68.24 KB, 2 trang )
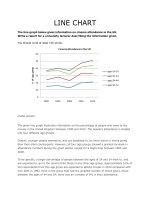
The bar chart illustrates the quantity of Asian elephants in nine different
countries over a period of 7 years.
It is clear that there was a slight decline in the number of Asian elephants
in all nations from 1997 to 2004. However, the figure for India and
Myanmar considerately increased and reached their peaks in the period
given.
Correction:
It is clear that although there was a slight decline in the number of Asian
elephants in all nations from 1997 to 2004, the figure for Cambodia in the
period given increased slightly.
In 1997, Asian elephants of India and Myanmar witnessed a significant
increase with the number of Indian elephants twice as many as that of
Myanmar, 10000 and 5000 respectively. Moreover, elephants in Thailand
stood at around 4000 while there were merely 3000 elephants for both of
Malaysia and Sri Lanka. In seven years later, those figures declined
moderately to 7500 for India and 4500 for Myanmar. Also, Sri Lanka still
remained unchanged about the number of elephants.
In term of the rest, Vietnam, Cambodia, Laos and China had 1000
elephants in 1997 while, after seven years, there were unstable changes
the figures for those countries, in which Vietnam and Laos remained
unchangeable. Otherwise, China hit a low of approximately 500 elephants
in the same period.


