Tài liệu Báo cáo khóa học: Numerical calculations of the pH of maximal protein stability pptx
Bạn đang xem bản rút gọn của tài liệu. Xem và tải ngay bản đầy đủ của tài liệu tại đây (560.19 KB, 13 trang )
Numerical calculations of the pH of maximal protein stability
The effect of the sequence composition and three-dimensional structure
Emil Alexov
Howard Hughes Medical Institute and Columbia University, Biochemistry Department, New York, USA
A large number of proteins, found experimentally to have
different optimum pH of maximal stability, were studied to
reveal the basic principles of their preferenence for a par-
ticular pH. The pH-dependent free energy of folding was
modeled numerically as a function of pH as well as the net
charge of the protein. The optimum pH was determined in
the numerical calculations as the pH of the minimum free
energy of folding. The experimental data for the pH of
maximal stability (experimental optimum pH) was repro-
ducible (rmsd ¼ 0.73). It was shown that the optimum pH
results from two factors – amino acid composition and the
organization of the titratable groups with the 3D structure.
It was demonstrated that the optimum pH and isoelectric
point could be quite different. In many cases, the optimum
pH was found at a pH corresponding to a large net charge of
the protein. At the same time, there was a tendency for
proteins having acidic optimum pHs to have a base/acid
ratio smaller than one and vice versa. The correlation
between the optimum pH and base/acid ratio is significant if
only buried groups are taken into account. It was shown that
a protein that provides a favorable electrostatic environment
for acids and disfavors the bases tends to have high optimum
pH and vice versa.
Keywords: electrostatics; pH stability; pK
a
; optimum pH.
The concentration of hydrogen ions (pH) is an important
factor that affects protein function and stability in different
locations in the cell and in the body [1]. Physiological pH
varies in different organs in human body: the pH in the
digestive tract ranges from 1.5 to 7.0, in the kidney it ranges
from 4.5 to 8.0, and body liquids have a pH of 7.2–7.4 [2]. It
was shown that the interstitial fluid of solid tumors have
pH ¼ 6.5–6.8, which differs from the physiological pH of
normal tissue and thus can be used for the design of pH
selective drugs [3].
The structure and function of most macromolecules are
influenced by pH, and most proteins operate optimally at a
particular pH (optimum pH) [4]. On the basis of indirect
measurements, it has been found that the intracellular pH
usually ranges between 4.5 and 7.4 in different cells [5]. The
organelles’ pH affects protein function and variation of pH
away from normal could be responsible for drug resistance
[6]. Lysosomal enzymes function best at the low pH of 5
found in lysosomes, whereas cytosolic enzymes function
best at the close to neutral pH of 7.2 [1].
Experimental studies of pH-dependent properties [7–11]
such as stability, solubility and activity, provide the benchmarks
for numerical simulation. Experiments revealed that altho-
ugh the net charge of ribonuclease Sa does affect the
solubility, it does not affect the pH of maximal stability or
activity [12]. Another experimental technique as acidic or
basic denaturation [13–15] demonstrates the importance of
electrostatic interactions on protein stability.
pH-dependent phenomena have been extensively mode-
led using numerical approaches [16–19]. A typical task is to
compute the pK
a
s of ionizable groups [20–26], the isoelectric
point [27,28] or the electrostatic potential distribution
around the active site [29]. It was shown that activity of
nine lipases correlates with the pH dependence of the
electrostatic potential mapped on the molecular surface of
the molecules [29]. pH dependence of unfolding energy was
modeled extensively and the models reproduced reasonable
the experimental denaturation free energy as a function of
pH [19,30–36].
The success of the numerical protocol to compute the
pH dependence of the free energy depends on the model
of the unfolded state, the model of folded state and thus
on the calculated pK
a
s. It is well recognized that the
unfolded state is compact and native-like, but the magni-
tude of the residual pairwise interactions and the desol-
vation energies has been debated. Some of the studies
found that any residual structure of the unfolded state has
negligible effect on the calculated pH dependence of
unfolding free energy [31], while others found the opposite
[33–36]. It was estimated that the pK
a
s of the acidic
groups in unfolded state are shifted by – 0.3 pK units in
respect to the pK
a
s of model compounds. Although
including the measured and simulated pK shifts into the
model of unfolded state changes the pH dependence of
the unfolding free energy, it most of the cases it does not
change the pH of maximal stability [33–36]. Much more
Correspondence to E. Alexov, Howard Hughes Medical Institute and
Columbia University, Biochemistry Department, 630 W 168 Street,
New York, NY 10032, USA.
Fax: + 1 212 305 6926, Tel.: + 1 212 305 0265,
E-mail:
Abbreviations: MCCE, multi-conformation continuum electrostatic;
SAS, solvent accessible surface.
(Received 15 September 2003, accepted 11 November 2003)
Eur. J. Biochem. 271, 173–185 (2004) Ó FEBS 2003 doi:10.1046/j.1432-1033.2003.03917.x
important is the modeling of the folded state, where the
errors of computing pK
a
s could be significantly larger
than 0.3 units. Over the years it has been a continuous
effort to develop methods for accurate pK
a
predictions
[20,21]. These include empirical methods [37], macroscopic
methods [38–41], finite difference Poisson–Boltzmann
(FDPB)-based methods [20–22,42], FDPB and molecular
dynamics [43–45], FDPB and molecular mechanics
[25,46,47] and Warshel’s microscopic methods (e.g.,
[16,17]). The predicted pK
a
s were benchmarked against
the experimental data and the average rmsd were found to
vary from the best value of 0.5pK [38], to 0.7pK [48], to
0.83pK [25] and to 0.89 [22]. Multi-Conformation Con-
tinuum Electrostatics (MCCE) [25] method was shown to
be among the best pK
a
s predictors and it will be
employed in this work.
In the present work we compute the pH dependence of
the free energy of folding and the net charge. The optimum
pH was identified as the pH at which the free energy of
folding has minimum. A large number of proteins having
different optimum pH [49] were studied to find the effect of
the amino acid composition and 3D structure on the
optimum pH.
Experimental procedures
Methods
Calculations were carried out using available 3D structures
of selected proteins. A text search was performed on
BRENDA database [49] in the field of ÔpH of stabilityÕ.Fol-
lowing search strings were used: Ômaximal stabilityÕ, Ômaxi-
mum stabilityÕ, Ôoptimal stabilityÕ, Ôoptimum stabilityÕ, Ôbest
stabilityÕ, Ôhighest stabilityÕ and Ôgreatest stabilityÕ.This
revealed 168 proteins with experimentally determined pHs
of maximal stability. Then a search of the Protein Data Base
(PDB) was performed to find available structures for these
proteins. An attempt was made to select PDB structures of
proteins from the same species as those used in the
experiment (43 structures). Structures with missing residues
were omitted as well as the structures of proteins participa-
ting in large complexes resulting in the final set of 28 protein
structures. The protein names, the PDB file names and the
experimental pH of maximal stability are provided in
Table 1. The source of the data is BRENDA database and
thus the present study is limited to the proteins listed there.
There will always be proteins with experimentally determined
Table 1. Proteins and corresponding PDB [57] files used in the paper. The experimental optimum pH (pH of optimal stability) is taken from
BRENDA website [49]. The calculated optimum pH (the pH of the minimum of free energy of folding) is given in the forth column. The difference is
the calculated optimum pH minus the experimental number (fifth column). Bases/acid ratio for all ionizable groups is in sixth column, while the
seventh shows the bases/acids ratio for 66% buried groups. The last three columns show the averaged intrinsic pK shift, the averaged pK
a
shift and
the net charge of the folded protein at pH optimum, respectively.
Protein pdb code
Experimental
optimum
pH
Calculated
optimum
pH Difference
Base/acid
ratio
Buried
base/acid
ratio
Averaged
intrinsic
pK shift
Averaged
pK
a
shift
Net charge at
optimum pH
Dioxygenase 1b4u 8.0 8.0 0.0 0.94 1.33 0.08 ) 0.51 ) 3.0
Transferase 1f8x 6.5 5.0 ) 1.5 0.72 0.28 0.40 0.34 ) 5.5
Glutathione synthetase 1sga 8.0 7.5 ) 0.5 0.87 0.88 0.41 ) 0.58 ) 10.0
Isomerase 1b0z 6.0 6.0 0.0 1.02 0.90 0.05 ) 0.48 2.1
Coenzyme A 1bdo 6.5 7.0 0.5 0.67 1.50 0.22 0.03 ) 4.1
Dienelactone hydrolase 1din 7.0 6.5 ) 0.5 1.04 1.17 0.26 ) 0.36 ) 2.7
Dehydrogenase 1dpg 6.2 6.0 ) 0.2 0.79 1.05 0.38 ) 0.41 ) 13.0
Endothiapepsin 1gvx 4.15 4.0 ) 0.15 0.52 0.07 1.45 2.06 6.5
Dehydratase 1aw5 9.0 9.0 0.0 1.07 0.85 0.17 ) 0.48 ) 6.8
Cathepsin B 1huc 5.15 5.0 ) 0.15 0.90 0.73 1.28 0.11 5.8
Alginate lyase 1hv6 7.0 7.0 0.0 1.17 0.93 0.63 ) 0.72 2.7
Xylanase 1igo 5.5 6.5 1.0 1.41 1.00 0.60 ) 0.74 7.3
Hydrolase 1iun 7.5 7.0 ) 0.0 0.86 1.50 0.11 ) 1.15 ) 1.1
Aspartic protease 1j71 4.15 3.0 ) 1.15 0.54 0.33 0.98 1.32 9.4
Aldolase 1jcj 8.5 8.5 0.0 0.97 0.54 0.55 ) 0.19 ) 5.1
L
-Asparaginase 1jsl 8.5 7.0 ) 1.5 1.17 1.85 ) 0.12 ) 0.83 ) 0.1
Amylase 1lop 5.9 6.0 0.1 0.81 1.00 0.33 ) 0.42 ) 8.2
c-Glutamil hydrolase 1l9x 7.0 7.5 0.5 1.19 0.77 0.45 ) 0.02 2.8
Mutase 1m1b 7.0 6.0 ) 1.0 0.95 0.86 0.25 0.13 ) 3.2
Methapyrogatechase 1mpy 7.7 7.0 ) 0.7 1.0 1.33 0.11 ) 1.35 ) 12.0
Pyrovate oxidase 1pow 5.7 6.0 0.3 0.91 0.78 0.60 ) 0.51 ) 2.0
Chitosanase 1qgi 6.0 6.5 0.5 1.09 0.54 0.29 ) 0.31 5.0
Xylose isomerase 1qt1 8.0 8.0 0.0 0.84 1.50 0.24 ) 0.30 ) 16.0
Pyruvate decarboxylase 1zpd 6.0 7.0 1.0 1.02 0.83 0.47 ) 0.24 3.8
Acid a-amylase 2aaa 4.9 4.0 ) 0.90 0.51 0.64 1.53 1.48 ) 1.7
Formate dehydrogenase 2nac 5.6 7.0 1.40 1.11 1.42 0.06 ) 1.1 2.4
Phosphorylase 2tpt 6.0 5.0 ) 1.0 0.91 0.93 0.38 ) 0.34 ) 3.8
b-Amylase 5bca 5.5 5.0 ) 0.5 1.07 0.91 0.19 ) 0.13 15.1
174 E. Alexov (Eur. J. Biochem. 271) Ó FEBS 2003
optimum pH that were not in the database, and therefore are
not modeled in the paper. However, an additional four well
studied proteins were used to benchmark the method in
broad pH range and to compare the effect of mutations.
Free energy and net charge of unfolded state
The unfolded state is modeled as a chain of noninteracting
amino acids (the possibility of residual interactions in the
unfolded state is discussed at the end of the discussion
section). Thus, the free energy of ionizable groups (pH-
dependent free energy) is calculated as [31]:
DG
unf
¼ÀkT lnðZ
unf
Þ
¼ÀkT
X
N
iÀ1
lnf1 þ exp½À2:3cðiÞðpH À pK
sol
ðiÞÞg
ð1Þ
where k is the Boltzmann constant, T is the temperature in
Kelvin degrees, N is the number of ionizable groups, c(i)is1
for bases, )1foracids,pK
sol
(i) is the standard pK
a
value in
solution of group ÔiÕ (e.g., [47]), pH is the pH of the solution
and N is the number of ionizable residues. Z
unf
is the
partition function of unfolded state and DG
unf
is the free
energy of unfolded state. The reference state of zero free
energy is defined as state of all groups in their neutral forms
[31].
The net charge is calculated using the standard formula
that comes from Henderson–Hasselbalch equation:
q
unf
¼
X
N
i¼1
10
ÀcðiÞðpHÀpK
sol
ðiÞÞ
1 þ 10
ÀcðiÞðpHÀpK
sol
ðiÞÞ
cðiÞð2Þ
where c(i) ¼ )1 or +1 in the case of acid or base,
respectively.
Free energy and net charge of the folded state
The pH-dependent free energy of the folded state is
calculated using the 3D structure of proteins listed in
Table 1. The 3D structure comprises N ionizable groups
(the same number as in the unfolded state) and L polar
groups. Each of them might have several alternative side-
chain rotamers [50], or alternative polar proton positions
[47]. In addition, ionizable groups are either ionized or
neutral. All these alternatives are called ÔconformersÕ,being
ionizational and positional conformers. There is no apriori
information to indicate which conformer is most likely to
exist at certain conditions of, for example, pH and salt
concentration. Each microstate is comprised of one con-
former per residue. The Monte Carlo method was used to
estimate the probability of microstates. This procedure
is called multi-conformation continuum electrostatics (MC
CE) and it is described in more details elsewhere [25,47,50]. A
brief summary of the MCCE method is provided in a later
section.
To find the free energy one should calculate the
partition function for each of the proteins. Thus, one
should construct all possible combinations of conformers.
Because of the very large number of conformers (most of
the cases more than 1000), the Monte Carlo method
(Metropolis algorithm [51]) is used to find the probability
of the microstates [20,47,50,52]. However, to construct the
partition function one should know all microstate energies
and to sum them up as exponents. Each microstate
energy should be taken only once, which induces extra
level of complexity. A special procedure is designed that
collects the lowest microstate energies and that assures
that each microstate is taken only once [50]. A microstate
was considered to be unique if its energy differs by more
than 0.001 kT from the energies of all previously
generated states. A much more stringent procedure that
compares the microstate composition would require
significant computation time and therefore was not
implemented. This results in a function that estimates
the partition function. This effective partition function
will not have the states with high energy (they are rejected
by the Metropolis algorithm), but they have negligible
effect [53]. In addition, the constructed partition function
may not have all low energy microstates, because given
microstate may not be generated in the Monte Carlo
sampling or because two or more distinctive microstates
may have identical or very similar energies. Bearing in
mind all these possibilities, the effective partition function
(Z
fol
)iscalculatedas[50]:
Z
fol
¼
X
X
fol
n¼1
expðÀDG
fol
n
=kTÞð3Þ
where DG
fol
n
is the energy of the microstate ÔnÕ and X
fol
is the
number of microstates collected in Monte Carlo procedure.
Then the free energy of ionizable and polar groups in folded
state is:
DG
fol
¼ÀkT lnðZ
fol
Þð4Þ
The occupancy of each conformer (q
fol
i
) [52] is calculated
in the Metropolis algorithm and then used to calculate the
net charge of the folded state:
q
fol
¼
X
M
i¼1
q
fol
i
cðiÞð5Þ
M is the total number of conformers. [Note that c(i)¼ 0 for
non ionizable conformers.]
Free energy of folding
The pH-dependent free energy of folding is calculated as a
difference between the free energy of folded and unfolded
states:
DDG
folding
¼ DG
fol
À DG
unf
ð6Þ
An alternative formula of calculating the pH dependence
of the free energy of folding is [19,31,54,55]:
DDG
folding
¼ 2:3kT
Z
pH
2
pH
1
DqdpH ð7Þ
where, pH
1
and pH
2
determine the pH interval and Dq is the
change of the net charge of the protein from unfolded to
folded state.
Ó FEBS 2003 Calculating pH of maximal protein stability (Eur. J. Biochem. 271) 175
Computational method: MCCE method
The basic principles of the method have been described
elsewhere [47,50]. The MCCE [25] method allows us to find
the equilibrated conformation and ionization states of
protein side chains, buried waters, ions, and ligands. The
method uses multiple preselected choices for atomic posi-
tions and ionization states for many selected side chains and
ligands. Then, electrostatic and nonelectrostatic energies
are calculated, providing look-up tables of conformer self-
energies and conformer–conformer pairwise interactions.
Protein microstates are then constructed by choosing one
conformer for each side chain and ligand. Monte Carlo
sampling then uses each microstate energy to find each
conformer’s probability.
Thus, the MCCE procedure is divided into three stages:
(a) selection of residues and generation of conformers; (b)
calculation of energies and (c) Monte Carlo sampling.
Selection of residues. The amino acids that are involved in
strong electrostatic interactions (magnitude > 3.5 kT) are
selected. They will be provided with extra side-chain
rotamers to reduce the effects of possible imperfections of
crystal structures. The reason is that a small change in their
position might cause a significant change in the pairwise
interactions [56]. The threshold of 3.5 kT is chosen based on
extensive modeling of structures and fitting to experiment-
ally determined quantities [25]. The selection is made by
calculating the electrostatic interactions using the ori-
ginal PDB [57] structure. The alternative side chains for
these selected residues are built using a standard library of
rotamers [58] and by adding an extra side chain position
using a procedure developed in the Honig’s laboratory [59].
The backbone is kept rigid. Then the original structure and
alternative side chains were provided with hydrogen atoms.
Polar protons of the side chains are assigned by satisfying all
hydrogen acceptors and avoiding all hydrogen donors [25].
Thus, every polar side chain and neutral forms of acids have
alternative polar proton positions.
Calculation of energies. The alternative side chains and
polar proton positions determine the conformational
space for a particular structure, and they are called
ÔconformersÕ. The next step is to compute the energies of
each conformer and to store them into look-up tables.
Because of conformation flexibility, the energy is no
longer only electrostatic in origin, but also has nonelec-
trostatic component [47,50].
Electrostatic energies are calculated by DelPhi [60,61],
using the PARSE [62] charge and radii set. Internal
dielectric constant is 4 [63], while the solution dielectric
constant is taken to be 80. The molecular surface is
generated with a water probe of radius 1.4 A
˚
[64]. Ionic
strength is 0.15
M
and the linear Poisson–Boltzmann
equation is used. Focusing technique [65] was employed to
achieve a grid resolution of about two grids per A
˚
ngstrom.
The M calculations, where M is the number of conformers,
produce a vector of length M for reaction field energy
DG
rxn,i
and an MxM array of the pairwise interactions
between all possible conformers DG
ij
el
. In addition, each
conformer has pairwise electrostatic interactions with the
backbone resulting in a vector of length M DG
pol,i
.The
magnitude of the strong pairwise and backbone interactions
is altered as described in [56]. Such a correction was
shown to improve significantly the accuracy of the calcu-
lated pK
a
s[25].
Having alternative side chains and polar hydrogen
positions requires nonelectrostatic energy to be taken into
account too. This energy is a constant in calculations that
use a ÔrigidÕ protein structure (and therefore should not be
calculated), but in MCCE plays important role discrim-
inating alternative positional conformers. The non-
electrostatic interactions for each conformer are the
torsion energy, a self-energy term which is independent
of the position of all other residues in the protein, and
the pairwise Lennard–Jones interactions, both with por-
tions of the protein that are held rigid, and with
conformers of side chains that have different allowed posi-
tions [25,47,50].
Thus, the microstate ÔnÕ pH-dependent free energy of
folded state is [20,21,47,50]:
DG
fol
n
¼
X
M
i¼1
2:3kTd
n
ðiÞ½cðiÞðpH À pK
sol
ðiÞÞ þ DpK
int
ÞðiÞ
þ
X
M
j¼iþ1
d
n
ðiÞd
n
ðjÞðG
ij
el
þ G
ij
nonel
Þ
;
DpK
int
ðiÞ¼DpK
solv
ðiÞþDpK
dip
ðiÞþDpK
nonel
ðiÞ
ð8Þ
where d
n
(i)is1ifith conformer is present in the nth
microstate, M is the total number of conformers, DpK
int
(i)
is the electrostatic and non electrostatic permanent energy
contribution to the energy of conformer ÔiÕ (note that it does
not contain interactions with polar groups), c(i)is1for
bases, )1 for acids, and 0 for neutral groups, DpK
solv
(i)isthe
change of solvation energy of group ÔiÕ, DpK
dip
(i)isthe
electrostatic interactions with permanent charges,
DpK
nonel
(i) is the nonelectrostatic energy with the rigid part
of protein, G
ij
el
and G
ij
nonel
are the pairwise electrostatic and
non electrostatic interactions, respectively, between con-
former ÔiÕ and ÔjÕ.
Monte Carlo sampling. TheMonteCarloalgorithmis
used to estimate the occupancy (the probability) of each
conformer at given pH. The convergence is considered
successful if the average fluctuation of the occupancy is
smaller than 0.01 [25]. The pH where the net charge of given
titratable group is 0.5 is pK
½
. To adopt a common
nomenclature, pK
½
will be referred as pK
a
throughout the
text.
Optimum pH, isoelectric point (pI) and bases/acids ratio
The experimental pH of maximal stability for each of the
proteins listed in Table 1 is taken from the website
BRENDA [49]. The database does not always provide a
single number for the optimum pH. If given protein is
reported to be stable in a range of pHs, then the optimum
pH is taken to be the middle of the pH range.
The optimum pH in the numerical calculation is deter-
mined as pH at which the free energy of folding has
minimum. In the case that the free energy of folding has a
176 E. Alexov (Eur. J. Biochem. 271) Ó FEBS 2003
minimum in a pH interval, the optimum pH is the middle of
the interval. The calculations were carried out in steps of
DpH ¼ 1. Thus, the computational resolution of determin-
ing the pH optimum was 0.5 pH units.
The calculated and experimental pH intervals were not
compared, because in many cases BRENDA database
provides only the pH of optimal stability. In addition, in
most cases the experimental pH interval of stability given in
the BRENDA database does not provide information for
the free energy change that the protein can tolerate and still
be stable. Therefore it cannot be compared with the
numerical results which provide only the pH dependence
of the folding free energy. Some proteins may tolerate a
free energy change of 10 kcalÆmol
)1
and still be stable, while
others became unstable upon a change of only a few
kcalÆmol
)1
.
The calculated isoelectric point (pI) is the pH at which
the net charge of folded state is equal to zero. There is
practically no experimental data for the pI of the proteins
listed in Table 1. The net charge at optimum pH is the
calculated net charge of the folded protein at pH
optimum. Base/acid ratio was calculated by counting all
Asp and Glu residues as acids and all Arg, Lys and His
residues as bases. In some cases, one or more acidic and/
or His residues was calculated to be neutral at a particular
pH optimum, but they were still counted. The reason for
this was to avoid the bias of the 3D structure and to
calculate the base/acid ratio purely from the sequence.
The given residue is counted as 66% buried if its
solvent accessible surface (SAS) is one-third of the SAS
in solution. Averaged intrinsic pK shifts were calculated
as
1
N
X
N
i¼1
ðpK
int
ðiÞÀpK
sol
ðiÞÞ
and the averaged pK
a
sshiftas
1
N
X
N
i¼1
ðpK
a
ðiÞÀpK
sol
ðiÞÞ
Thus, a negative pK shift corresponds to conditions such
that the protein stabilizes acids and destabilizes bases and
vice versa. Arginines were not included in the calculations
because their pK
a
s are calculated in many cases to be
outside the calculated pH range.
Results
Origin of optimum pH
The paper reports the pH dependence of the free energy of
folding. Despite the differences among the calculated
proteins, the results show that the pH-dependence profile
of the free energy of folding is approximately bell-shaped
and has a minimum at a certain pH, referred to through the
paper as the optimum pH.
To better understand the origin of the optimum pH, a
particular case will be considered in details. Figure 1A
shows the free energies of cathepsin B calculated in pH
range 0–14. Three energies were computed: the free energy
of the unfolded state (bottom line), the free energy of the
folded state (middle line) and the free energy of folding (top
curve). For the sake of convenience the free energies of the
folded state and folding are scaled by an additive constants
so to have the same magnitude as the free energy of the
unfolded state at the pH of the extreme value (in this case
pH ¼ 5). It improves the resolution of the graph without
changing its interpretation, because the energies contain an
undetermined constant (hydrophobic interactions, entropy
change, van der Waals interactions and other pH-inde-
pendent energies).
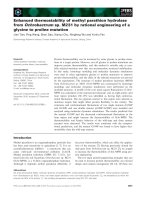
Free energy of unfolded state. It can be seen (Fig. 1A) that
the free energy of the unfolded state has a maximum value
at pH ¼ 5 and it rapidly decreases at low and high pHs.
Such a behavior can be easily understood given equation 1.
At low pH, the pK
sol
of all acidic groups is higher than the
current pH and thus they contribute negligible to the
partition function. In contrast, all basic groups contribute
significantly to the partition function. As the pH decreases,
their contribution increases, making the free energy more
negative. At medium pHs, all ionizable groups are ionized
(except His and Tyr), but their effect on the free energy is
quite small, because their pK
sol
areclosetothepH.This
results in a maximum of the free energy corresponding to
the least favorable state. At high pHs, the situation is
reversed: all acidic groups have a major contribution to the
partition function, while bases add very little. Thus, the free
energy profile of the unfolded state is always a smooth curve
(bell-shaped) with a maximum at a certain pH. The shape of
the curve and the position of the maximum depend entirely
upon the amino acid composition.
Fig. 1. Cathepsin B pH-dependent properties.
(A) Free energy; (B) net charge.
Ó FEBS 2003 Calculating pH of maximal protein stability (Eur. J. Biochem. 271) 177
Free energy of folded state. Thefreeenergyofthefolded
state behaves in a similar manner, but it changes less with
the pH (Fig. 1A). Note that it has maximum at pH ¼ 6.
The major difference occurs at low and high pHs where free
energy of the folded state does not decrease as fast as for the
unfolded state. The 3D structure adds to the microstate
energy (Eqn 8) and to the partition function several new
energy terms )DpK
int
(i) (that originates in part from the
desolvation energy) and pairwise interactions G
ij
(a detailed
discussion on the effect of desolvation and pairwise energies
on the stability is given in [31]). If these two terms
compensate each other, then Eqn 8 might be thought to
reassemble the microstate energy formula of the unfolded
state, Eqn 1. But there is an important difference: the amino
acids are coupled through the pairwise interactions. The
pairwise energies are a function of the ionization states.
Thus, the de-ionization of a given group will cancel its
pairwise interaction energies with the rest of the protein.
The effect of the coupling can be easily understood at the
extremes of pH. Consider a very low pH such that the pK
a
s
of all acidic groups are higher than the current pH. At such
pH all acids will be fully protonated and thus the bases
(having their own desolvation penalty) will be left without
favorable interactions. Thus the energy of the folded state
will be less favorable (because of the desolvation energy and
the lack on favorable interactions) than the energy of
unfolded state.
Free energy of folding. The pH dependence of the free
energy of folding results from the difference of the above
free energies (Fig. 1A). It always will have a minimum at
certain pH (in principle it might have more than one
minimum). This minimum may or may not coincide with
the pH where the unfolded free energy has maximum. The
folding free energy always has a bell shape, and it is
unfavorable at low and high pHs as compared to the free
energy at optimum pH.
Net charge. An alternative way of addressing the same
question is to compute the net charge of the protein
(Fig. 1B). One can see that at the extremes of pH, the
protein is highly charged. At low pH it has a huge net
positive charge and at high pH a huge net negative charge.
A straightforward conclusion could be made that acidic/
basic denaturation is caused by the repulsion forces among
charges with the same type. However all these positive
chargesatlowpHexistalsoatmediumpH,wherethe
proteins are stable. The thing that is missing at low pH and
causes acid denaturation is the favorable interactions with
negatively charged groups. At low pH, bases are left without
the support of acids, and they have to pay an energy penalty
for their desolvation and unfavorable pairwise energies
among themselves.
Equation 7 provides an additional tool for determining
the optimum pH. At the optimum pH, the curve of folding
free energy must have an extremum, i.e. the curve must
invert its pH behavior. At pH lower than the optimum pH,
the free energy of folding should decrease with increasing
the pH, then it should have a minimum at pH equal to the
optimum pH, and then it should increase with further
increase of the pH. Such behavior corresponds to a negative
net charge difference between the folded and unfolded state
at pH smaller than the optimum pH. As pH increases, the
net charge difference should get smaller, and at the optimum
pH, it should be zero. Further increase of the pH (above the
optimum pH) should make the net charge difference a
positive number. One can see in Fig. 1B that the net charge
of folding follows such pattern and is zero at pH ¼ 5, where
the free energy of folding has a minimum.
General analysis of the optimum pH
Comparison to experimental data. Although this paper
focuses on the pH of maximal stability, it is useful to
compare the calculated pH dependence of the folding free
energy on a set of proteins subjected to extensive experi-
mental measurements. Figure 2 plots the calculated and
experimental pH dependence of the free energy of folding.
The experimental data is taken from Fersht [66,67],
Robertson [68] and Pace [10]. One can see that the
calculated pH-dependent free energy agrees well with
the experimental data. The most important conclusion for
the aims of the paper is that the calculated pH dependence
profile of the free energy of folding is similar to that of the
experiment. The only exception is ribonuclease A where
the calculated pH optimum is 8 while the experiment finds
the best stability at pH ¼ 6. It should be noted that the
calculated results are similar to the results reported by
Elcock [33] and Zhou [36] in cases of idealized unfolded
state. From the works of the above authors, as well as from
Karshikoff laboratory [34], one can see that the residual
interactions in unfolded state do not affect the pH optimum
in majority of the studied cases.
An additional possibility for comparison is offered by the
mutant data. Table 2 shows the stability change of barnase
caused by mutations of charged residues. The calculated
numbers are the pK
a
shifts (in respect to the standard pK
sol
)
of each of these ionizable residues. Thus, the energy of the
mutant residue is not taken into account in the numerical
calculations. Even under such simplification, the calculated
numbers are 0.84 kcalÆmol
)1
rmsd from the experiment.
Figure 3 compares the calculated optimum pH vs.
experimental optimum pH for 28 proteins listed in Table 1.
One can see that calculated values are in good agreement
with experimental data. The slope of the fitting line is 0.93
and Pearson correlation coefficient is 0.86. The rmsd
between calculated and experimentally determined opti-
mum pHs is 0.73. The optimum pH ranges from 2 to 9 (4–9
experimentally) which provides a broad range of pHs to be
compared.
The origin of the optimum pH. The position of the
optimum pH depends on the amino acid composition and
on the organization of the amino acids within the 3D
structure. To find which of these two factors dominates we
plotted the calculated optimum pH of the free energy of
folding vs. the pH at which the free energy of unfolded state
has maximum (Fig. 4). The free energy of folding results
from the difference of the free energy of folded and unfolded
states. Thus, if the last two energies have the same pH
dependence, the free energy of folding will be pH independ-
ent. If both the free energy of unfolded and of folded state
have similar shape and maximum at the same pH, then most
likely the optimum pH will also be at this pH. If the curve of
178 E. Alexov (Eur. J. Biochem. 271) Ó FEBS 2003
the free energy of the folded state is steeper at basic pHs (or
flatter at acidic pHs) compared to the free energy of the
unfolded state, then the difference, i.e. the free energy of
folding will have optimum pH shifted to the right pH scale.
Such a phenomenon will occur if the protein stabilizes acids.
Then the optimum pH will be higher than the pH of
maximal free energy of unfolded state (points above the
Table 2. Experimental and calculated effect of single mutants on the
stability of barnase.
Mutant Experiment (kcalÆmol
)1
) Calculation (kcalÆmol
)1
)
D12A ) 0.95 ) 1.83
R69S, R69M ) 2.67, ) 2.24 ) 1.9
D75N ) 4.51 ) 2.92
R83Q ) 2.23 ) 4.07
D93N ) 4.17 ) 4.27
R110A ) 0.45 ) 2.17
Fig. 2. The calculated pH dependence of the
free energy of folding (solid line) and experi-
mental data (d). The ionic strength was
selected to match experimental conditions:
barnase (I ¼ 50 m
M
), OMKTY3
(I ¼ 10 m
M
), CI2 (I ¼ 50 m
M
) and ribonuc-
lease A (I ¼ 30 m
M
).
Fig. 3. The calculated optimum pH vs. the experimental optimum pH.
The figure shows only 27 data points, because the calculated and
experimental data for 1b4u and 1qt1 overlap.
Fig. 4. The calculated optimum pH vs. the pH of maximal free energy of
unfolded state. Only 19 points can be seen in the figure, because of an
overlap, but all 28 points are taken into account in the calculation of
the correlation coefficient.
Ó FEBS 2003 Calculating pH of maximal protein stability (Eur. J. Biochem. 271) 179
diagonal). If the protein stabilizes bases (or destabilizes
acids), then the optimum pH is lower than the pH of
maximum of the free energy of unfolded state (point below
the diagonal). The points lying on the diagonal represent
cases for which the amino acid sequence dominates in
determining the optimum pH. The points below the
diagonal show proteins with pH optimum lower than the
pH of maximum of the free energy of unfolded state. The
points offset from the diagonal manifest the importance of
the 3D structure. In each case where the 3D structure causes
a shift of the solution pK
a
of ionizable groups, the stability
changes [31,69]. If protein favors the charges, then the
stability increases. From 28 proteins studied in the paper,
nine lie on the main diagonal (tolerance 0.5pK units), while
19 are offset by more than of 0.5pK units. Thus, in 32% of
the cases the amino acid composition is the dominant factor
determining the optimum pH and in 68% of the cases, the
3D structure does.
To check for possible correlation between the optimum
pH and the pK shifts in respect to the standard pK
sol
,they
were plotted in Fig. 5. Two pK shifts were calculated:
intrinsic pK which does not account for the interactions
with ionizable and polar groups, and pK
a
shift which
reflects the total energy change from solution to the protein
for each ionizable group. In both cases the correlation with
pH optimum exists, although the correlation coefficients are
not very good. A positive pK shift corresponds to pK of
acids and bases bigger that of model compounds and thus to
electrostatic environment that disfavors acids and favors
bases. The most acidic enzymes were found to use this
strategy to lower their optimum pH (see the most right hand
side of the Fig. 5). The most basic enzymes induce slight
positive shift of the intrinsic pK, but adding the pairwise
interactions turns the pK shift to a negative number. The
enzymes between these two extremes do not induce large pK
shift on average.
It is well known that the pH dependence of the free
energy is an integral of the net charge difference between
folded and unfolded states over a particular pH interval
(Equation 7) [31,55,70]. A negative net charge difference
corresponds to a negative change of the free energy (the free
energy gets more favorable as pH increases). Thus, if an acid
has a pK
a
lower than the standard pK
sol
, it will titrate at
lower pH in the folded state compared to unfolded. As a
result, such a group will contribute to the net charge
difference by a negative number. Conversely, a positive net
charge difference corresponds to a positive free energy
change, i.e. to a less favorable free energy of folding. This
corresponds to pK
a
s higher than the standard pK
sol
.At
optimum pH the net charge difference should be zero. At
very low and at very high pHs, the free energy of folding is
unfavorable, because either bases or acids are left without
the support of the contra partners. Between these two
extremes, the free energy of folding must have a minimum.
Starting from very low pH to high pH, the first several
ionization events will be the deprotonation of acids. Because
these few acids are in the environment of the positive
potential of bases, they have pK
a
s lower than of unfolded
state and thus, the net charge difference between folded and
unfolded states will be negative. Thus, the free energy of
folding will decrease. If the protein does not support the
acids, then the rest of acids will have pK
a
s higher than that
of the unfolded state. This results to a positive net charge
difference between the folded and unfolded state and
increases the free energy of folding. Thus, the optimum
pH will be at low pH. Conversely, if the protein favors the
acids, then most of them will have pK
a
s lower than of
unfolded state and the net charge difference between folded
and unfolded states will be negative. Thus, the free energy of
folding will keep decreasing with increasing pH. This will
result in optimum pH shifted to higher pHs.
The optimum pH is not uniquely determined by the ratio
of basic to acidic groups. Figure 6A demonstrates that
enzymes with quite different bases to acids ratio have similar
optimum pH and that proteins with similar bases to acids
ratio function at completely different pHs. At the same time,
the trend is clearly seen. The proteins that function at low
pH have fewer bases (low base to acid ratio), while the
enzyme working at high pH have more bases than acids (see
also Table 2). The Pearson correlation coefficient is less
than 0.4, which demonstrates that the base/acid ratio is not
the most important factor in determining the optimum pH.
However, restricting the counting to buried amino acids
only, one finds much better correlation (Fig. 6B). This
improvement suggests that the pH optimum is mostly
determined by the buried charged groups, but the correla-
tion is still weak.
The effect of the net charge on the stability of the
proteins is demonstrated in Fig. 7A,B, where the optimum
pH is plotted against the calculated isoelectric point (pI)
and the net charge at optimum pH. At the isoelectric
point the net charge of the protein is zero, i.e. there are
equal number negative and positive charges. The graph
shows that there is no correlation (Pearson coeffi-
cient ¼ 0.09) between the isoelectric point and the opti-
mumpH.Atthesametime,thecorrelationbetweenthe
Fig. 5. The experimental optimum pH vs. the
averaged pK shifts. (A) Averaged intrinsic pK
a
;
(B) averaged pK
a
s shift.
180 E. Alexov (Eur. J. Biochem. 271) Ó FEBS 2003
optimum pH and the net charge of folded state is not
neglectable. The signal is weak, but there is a clear
tendency for proteins with acidic optimum pH to be
positively charged and for proteins with basic optimum
pH to carry negative net charge. There are only a few
proteins which do not have net charge at optimum pH.
Discussion
The study has shown that the pH of maximal stability can
be calculated using the 3D structure of proteins. Twenty-
eight different proteins were studied, most of them with
undetectable sequence and structural similarity. The opti-
mum pH varies from very acidic pH to very basic pH. Such
a diversity provided a good test for the computational
method (MCCE) used in the study. Relatively good
agreement with the experimental data was achieved result-
ing to correlation of 0.85 and rmsd ¼ 0.73. At the same
time, as indicated in Fig. 3, there are three proteins with
calculated optimum pH of about 1.5 pK units offset from
the experimental value (see Table 1). The reason for such a
discrepancy could be conformation changes that are not
included in the model. In addition, all calculations were
carried out at physiological salt concentration (I ¼ 0.15
M
),
while the experimental conditions of measuring the opti-
mum pH in many cases are not available. This may or may
not be a source of significant error, because although the salt
concentration strongly affects the pK
a
values in proteins
[71,72] and in model compounds [73], it may not necessary
affect the optimum pH [74]. At the same time, it is
interesting to point out that the average rmsd of calculated
to experimental pH optimum is 0.73, which is similar and
slightly better than the average rmsd of pK
a
s calculations
[25].
Two major factors determine the optimum pH, amino
acid composition and 3D structure of the proteins. The
relative importance of these two factors varies among the
proteins. To test our conclusions, two proteins that have
different optimum pH (acidic and basic) and are structurally
superimposable will be discussed below.
Figure 8A shows a structural alignment of acid
a-amylase (pdb code 2aaa) and xylose isomerase (pdb code
1qt1). The first protein has acidic optimum pH (calculated
optimum pH ¼ 4, experimental optimum pH ¼ 4.9), while
the second has basic optimum pH (calculated and experi-
mental optimum pH ¼ 8). The core structures of the
proteins are well aligned (rmsd ¼ 5.0 A
˚
and PSD ¼ 1.47
[75]). The part of the sequence alignment generated from the
structural superimposition is shown in Fig. 8B. The posi-
tions that correspond to Arg or Lys residues in the xylose
isomerase sequence and are aligned to nonbasic groups in
acid a-amylase sequence are highlighted. One can see that
31 basic groups of xylose isomerase sequence are replaced
by negative, polar or neutral groups in acid a-amylase
sequence. There are only a few examples of the opposite
case that are not shown in the figure. This results to base/
acid ratio of 0.51 for acid a-amylase and 0.84 for xylose
isomerase. This difference in the amino acid composition
results in a different pH dependence of the free energy of the
unfolded state and thus demonstrates the effect of the amino
acid composition on the optimum pH. From a structural
point of view it is interesting to mention that most of the
Fig. 7. The experimental optimum pH vs. the
calculated isoelectric point (A) and the net
charge at pH optimum (B).
Fig. 6. The experimental optimum pH vs. the
ratio of bases/acids. Twenty-seven data points
can be seen, because of the overlap between
1qtl and 1b4u. (A) All amino acids; (B) buried
amino acids.
Ó FEBS 2003 Calculating pH of maximal protein stability (Eur. J. Biochem. 271) 181
extra basic groups within the xylose isomerase structure are
not within the extra loop regions, but rather within the core
structure (see Fig. 8A). This confirms the observation
(Fig. 7B) that buried groups affect the optimum pH and
an enzyme that has acidic optimum pH has low acid/base
ratio. It remains to be shown that this is a general behavior
of all enzymes operating at low pH.
Three-dimensional structure of the protein plays an even
more significant role than the sequence composition on the
optimum pH (68% of the cases in this work). The ability of
Fig. 8. Alignment of acid alpha-amylase
(2aaa.pdb) and xylose isomerase (1qt1.pdb).
(A) Structural and sequence alignments are
carried out with
GRASP
2 [79]. Structural
alignment in ribbon representation: acid
amylase backbone is shown in green and
xylose isomerase in blue. The red patches
show the positions of substitution of Arg/Lys
to negative, polar or neutral groups from
xylose isomerase to acid amylase (see Fig. 8B).
(B) Sequence alignment from the structural
superimposition: highlighted are the positions
at which Arg/Lys in the xylose isomerase
sequence are aligned to acid, polar or neutral
groupinacida-amylase sequence.
182 E. Alexov (Eur. J. Biochem. 271) Ó FEBS 2003
the proteins to reduce the bias of the amino acid sequence
composition was shown by comparing the isoelectric point,
the net charge and the optimum pH. It was shown that for
most proteins the optimum pH does not coincide with the pI
and that the protein is most stable when it caries net charge.
This was demonstrated experimentally by engineering the
surface charges of ribonuclease Sa [12]. Increasing the net
charge of the molecule does not change its pH of maximal
stability, but changes the isoelectric point and increases
solubility [12].
Another strategy used to reduce the bias from the amino
acid composition is to change pK
a
s of ionizable groups in
the protein. If protein favors the negative charges on acidic
groups, then the optimum pH is shifted towards high pH as
compared to the pH at which unfolded free energy has
maximum and vice versa (Fig. 5). The same is valid for basic
groups but the effect is less noticeable simply because their
pK
a
s are too high (except for histidines). It should be
emphasized that one should distinguish between the ampli-
tude of the free energy of folding and optimum pH. As
discussed in previous papers [31,69], the stabilization of
ionizable groups by the protein always increases protein
stability.
It should be emphasized that this paper does not make
an attempt to calculate the all of the details of pH
dependence of the free energy of denaturation. This will
require an appropriate model of the unfolded state [7,66],
which is believed to be compact and native-like. (In
addition, the denaturated state may not be the same in
thermal, urea or guanidine denaturation experiments [10].)
The modeling of the unfolded state would eventually
require molecular dynamic runs [33] or some assumptions
of the organization of the amino acids in unfolded state
[34,36] or even an experimental determination of the pK
a
s
in model compounds [35,73]. Our goal was to compute
the pH at which the free energy of folding has minimum.
It was shown in the literature that while the shape of the
pH-dependence curve is sensitive to the model of the
unfolded state, the optimum pH does not depend
significantly on it [33–36].
The success of the modeling of the pH dependent free
energy of folding critically depends of the accuracy of the
calculated pKas of the ionizable groups. Recent bench-
marks of MCCE on 166 titratable groups resulted to an
rmsd 0.83 pK as compared to the experimentally deter-
mined pK
a
s [25]. It was demonstrated that increasing the
internal dielectric constant to 20 makes the results slightly
worse, because a significant part of the protein dielectric
response is captured explicitly in the MCCE methodology.
Using a high dielectric constant and allowing explicit rear-
rangement of protein dipoles would result to a double
counting of the same effect. Thus, MCCE employs a low
internal dielectric constant of 4 and no attempts were made
to study the sensitivity of the results against different values
of the dielectric constant. Other parameters that were not
tested include the charge set [76], the choice of molecular
surface (van der Waals surface vs. molecular surface)
[56,77,78] and the effect of energy minimization of PDB
structures [26]. These will require a separate study. In
addition, it should be noted that the relatively popular ÔnullÕ
method (a method that assumes that pK
a
s of the protein as
the same as in model compounds) will not work in this case,
because it will result in pH-independent free energy of
folding.
Despite of several failures, the presented methodology
can predict the optimum pH with reasonable accuracy. This
information can be used to identify a possible cellular
compartment or body organ where the protein may
function. Obviously a protein with a very basic optimum
pH cannot be stable in the stomach or in the liposome. One
can combine such information with information from other
sources to achieve better functional prediction. In the
postgenomic era, when many proteins are crystallized and
their structures determined, the challenge is to find their
putative function. In such a task, any seed of information is
valuable.
Acknowledgements
The author thanks Barry Honig for many inspirational discussions and
for the support during the work. We thank Trevor Siggers and Therese
Mitros for reading the manuscript and for the useful suggestions. This
work was supported by NIH grant GM-30518.
References
1. Alberts, B., Bray, D., Lewis, J., Raff, M., Roberts, K. &
Watson, J. (1994) Molecular Biology of the Cell, 3rd edn. Garland
Publishing, New York.
2. Davenport, H.W. (1966) Physiology of the Digestive Tract.Med-
ical Publishers Incorporated, Chicago, IL.
3. Burger, A.M., Steidle, C., Fiebig, H.H., Frick, E., Scholmerich, J.
& Kreutz, W. (1999) Activity of pH-sensitive salicylic acid deri-
vatives against human tumors in vivo. Clin. Cancer Res. 5,1078.
4. Boyer, P. (1971) Hydrolysis: Peptide Bonds,Vol.III.Academic
Press, New York.
5. Guiton, A. (1976) Textbook of Medical Physiology.W.B.Saun-
ders Company, Philadelphia.
6. Simon, S. (1999) Role of organelle pH in tumor cell biology and
drug resistance. Drug Discovery Today 4, 32–38.
7. Whitten, S. & Garcia-Moreno, B. (2000) pH dependence of sta-
bility of staphyloccocal nuclease: evidence of substantial electro-
static interactions in the denaturated state. Biochemistry 39,
14292–14304.
8. Pots,A.,Jongh,H.,Gruppen,H.,Hessing,M.&Voragen,A.
(1998) The pH dependence of the structural stability of patatin.
J. Agric. Food Chem. 46, 2546–2553.
9. Khurana, R., Hate, A., Nath, U. & Udgaonkar, B. (1995) pH
dependence of the stability of barstar to chemical and thermal
denaturation. Protein Sci. 4, 1133–1144.
10. Pace, C.N., Laurents, D.V. & Thomson, J.A. (1990) pH depen-
dence of the urea and guanidine hydrochloride denaturation of
ribonuclease A and ribonuclease T1. Biochemistry 29, 2564–2572.
11. Pace,C.N.,Laurents,D.V.&Erickson,R.E.(1992)Ureadena-
turation of barnase: pH dependence and characterization of the
unfolded state. Biochemistry 31, 2728–2734.
12. Shaw, K., Grimsley, G., Yakovlev, G., Makarov, A. & Pace, N.
(2001) The effect of the net charge on the solubility, activity, and
stability of ribonuclease Sa. Protein Sci. 10, 1206–1215.
13. Acampora, G. & Hermans, J. (1967) Reversible denaturation of
sperm whale myoglobin. I. dependence on temperature, pH, and
composition. J. Am. Chem. Soc. 89, 1543–1547.
14. Anderson, D.E., Becktel, W.J. & Dahlquist, F.W. (1990) pH-
induced denaturation of proteins: a single salt bridges contributes
3–5 kcal/mol to the free energy of folding of T4-lysozyme.
Biochemistry 29, 2403–2408.
Ó FEBS 2003 Calculating pH of maximal protein stability (Eur. J. Biochem. 271) 183
15. Alonso, D., Dill, K. & Stigter, D. (1991) The three states of
globular proteins: acid denaturation. Biopolymers 31, 1631–1649.
16. Warshel, A. (1981) Calculations of enyzmatic reactions: calcula-
tions of pK
a
, proton transfer reactions, and general acid catalysis
reactions in enzymes. Biochemistry 20, 3167–3177.
17. Warshel, A. & Russell, S. (1984) Calculations of electrostatic
interactions in biological systems and in solutions. Quart. Rev.
Biophys. 17, 283–422.
18. Honig, B. & Nicholls, A. (1995) Classical electrostatics in biology
and chemistry. Science 268, 1144–1149.
19. Schaefer, M., Sommer, M. & Karplus, M. (1997) pH-dependence
of protein stability: absolute electrostatic free energy difference
between conformations. J. Phys. Chem. 101, 1663–1683.
20. Yang, A S., Gunner, M.R., Sampogna, R., Sharp, K. & Honig, B.
(1993) On the calculation of pK
a
s in proteins. Proteins 15,
252–265.
21. Bashford, D. & Karplus, M. (1990) pK
a
s of ionizable groups in
proteins: atomic detail from a continuum electrostatic model.
Biochemistry 29, 10219–10225.
22. Antosiewicz, J., McCammon, J. & Gilson, M. (1994) Prediction of
pH dependent properties of proteins. J. Mol. Biol. 238,
415–436.
23. Nielsen, J. & Vriend, G. (2001) Optimizing the hydrogen-Bond
network in Poisson–Boltzmann equation-based pK
a
calculations.
Proteins 43, 403–412.
24. Sham, Y., Chu, Z. & Warshel, A. (1997) Consistent calculations of
pK
a
’s of ionizable residues in proteins: semi-microscopic and
microscopic approaches. J. Phys. Chem. 101, 4458–4472.
25. Georgescu, R., Alexov, E. & Gunner, M. (2002) Combining
conformational flexibility and continuum electrostatics for
calculating residue pK
a
’s in proteins. Biophys. J. 83, 1731–1748.
26. Nielsen, J. & McCammon, A. (2003) On the evaluation and
optimization of protein X-ray structures for pK
a
calculations.
Protein Sci. 12, 313–326.
27.Patrickios,C.&Yamasaki,E.(1995)Polypeptideaminoacid
composition and isoelectric point 1. A closed-form approxima-
tion. J. Coll. Inter. Sci. 175, 256–260.
28.Patrickiok,C.&Yamasaki,E.(1995)Polypeptideaminoacid
composition and iisoelectric point analytical. Biochemistry 231,
82–91.
29. Petersen, M., Fojan, P. & Peterson, S. (2001) How do lipases and
esterases work: the electrostatic contribution. J. Biotechnol. 85,
115–147.
30. Yang, A S. & Honig, B. (1992) Electrostatic effects on protein
stability. Curr. Opin. Struct. Biol. 2, 40–45.
31. Yang, A S. & Honig, B. (1993) On the pH dependence of protein
stability. J. Mol. Biol. 231, 459–474.
32. Honig, B. & Yang, A S. (1995) The free energy balance in protein
folding. Adv. Protein Chem. 46, 27–58.
33. Elcock, A. (1999) Realistic modeling of the denaturated states of
proteins allows accurate calculations of the pH dependence of
protein stability. J. Mol. Biol. 294, 1051–1062.
34. Kundrotas, P. & Karshikoff, A. (2002) Modeling of denaturated
state for calculation of the electrostatic contribution to protein
stability. Prot. Sci. 11, 1681–1686.
35. Tollinger, M., Crowhurst, K., Kay, L. & Forman-Kay, J. (2003)
Site-specific contributions to the pH dependence of protein sta-
bility. Proc.NatlAcad.Sci.USA100, 4545–4550.
36. Zhou, H. (2002) A Gaussian-chain model for treating residual
charge–charge interactions in the unfolded state of proteins Proc.
NatlAcad.Sci.USA99, 3569–3574.
37. Forsyth, W., Antosiewicz, J. & Robertson, A. (2002) Empirical
relationships between protein structure and carboxyl pK
a
values in
proteins. Proteins 48, 388–403.
38. Mehler, E. & Guarnieri, F. (1999) A self-consistent,
microenvironment modulated screened coulomb potential
approximation to calculate pH-dependent electrostatic effects in
proteins. Biophys. J. 75, 3–22.
39. Mehler, E., Fuxreiter, M., Simon, I. & Garcia-Moreno, B. (2002)
The role of hydrophobic microenvironment in modulating pK
a
shifts in proteins. Proteins 48, 282–292.
40. Tanford, C. & Kirkwood, J.G. (1957) Theory of protein titration
curves I. General equations for impenetrable spheres. J. Am.
Chem. Soc. 79, 5333–5339.
41. Havranek, J. & Harbury, P. (1999) Tanford–Kirkwood electro-
statics for protein modelling. Proc. Natl Acad. Sci. USA 96,
11145–11150.
42. Nielsen, J., Andersen, K., Honig, B., Hooft, R., Klebe, G., Vriend, G.
& Wade, R. (1999) Improving macromolecular electrostatic cal-
culations. Protein Eng. 12, 657–662.
43. Vlijmen, H., Schaefer, M. & Karplus, M. (1998) Improving the
accuracy of protein pK
a
calculations: conformational averaging
versus the average structure. Proteins 33, 145–158.
44. Koumanov,A.,Karshikoff,A.,Friis,E.&Borchert,T.(2001)
Conformational averaging in pK calculations: improvement and
limitation in prediction of ionization properties of proteins.
J. Phys. Chem. 105, 9339–9344.
45. Gofre,A.,Ferrara,P.,Caflisch,A.,Marti,D.,Bosshard,H.&
Jelesarov, I. (2002) Calculation of protein ionization equilibria
with conformational sampling: pK
a
of a model leucine zipper,
GCN4 and barnase. Proteins 46, 41–60.
46. You, T. & Bashford, D. (1995) Conformation and hydrogen ion
titration of proteins: a continuum electrostatic model with con-
formational flexibility. Biophys. J. 69, 1721–1733.
47. Alexov, E. & Gunner, M. (1997) Incorporating protein con-
formation flexibility into the calculation of pH-dependent protein
properties. Biophys. J. 74, 2075–2093.
48. Demchuk, E. & Wade, R. (1996) Improving the continuum
dielectric approach to calculating pK
a
’s of ionizable groups in
proteins. J. Phys. Chem. 100, 17373–17387.
49. Schomburg, I., Chang, A., Hofmann, O., Ebeling, C., Ehrentreich,
F. & Schomburg, D. (2002) BRENDA: a resource for enzyme
data and metabolic information. Trends in Biochem. Sci. 27,
54–56.
50. Alexov, E. & Gunner, M. (1999) Calculated protein and proton
motions coupled to electron transfer: electron transfer from
QA-to QB in bacterial photosynthetic reaction centers. Biochem-
istry 38, 8253–8270.
51. Valleau, J.P. & Torrie, G.M. (1977) In Modern Theoretical
Chemistry (Berne, B.J., eds), Vol. 5, pp. 169. Plenum, New York.
52. Beroza,P.,Fredkin,D.R.,Okamura,M.Y.&Feher,G.(1991)
Protonation of interacting residues in a protein by a Monte Carlo
method: application to lysozyme and the photosynthetic reaction
center of Rhodobacter sphaeroides Proc.NatlAcad.Sci.USA88,
5804–5808.
53. Gilson, M., Given, J. & Head, M. (1997) ÔMinin minimaÕ:Direct
computation of conformational free energy. J. Phys. Chem. 101,
1609–1618.
54. Tanford, C. (1970) Protein denaturation, Part C. Adv. Protein
Chem. 24, 1–95.
55. Schellman, J.A. (1975) Macromolecular Binding. Biopolymers 14,
999–1018.
56. Alexov, E. (2003) The role of the protein side chain fluctuations on
the strength of pair wise electrostatic interactions. Comparing
experimental with computed pK
a
’s. Proteins 50, 94–103.
57. Bernstein, F.C., Koetzle, T.F., Williams, G.J., Meyer, E.F., Brice,
M.D.,Rodgers,J.R.,Kennard,O.,Shimanouchi,T.&Tasumi,M.
(1977) The Protein Data Bank: a computer-based archival file for
macromolecular structures. J. Mol. Biol. 112, 535–542.
58. Roussel, A. & Cambillian, C. (1991) Turbo-Frodo in Silicon Gra-
phics Geometry, Partners Directory. Silicon Graphics, Mountain
View, CA.
184 E. Alexov (Eur. J. Biochem. 271) Ó FEBS 2003
59. Xiang, Z. & Honig, B. (2001) Extending the accuracy limits
of prediction for side-chain conformations. J. Mol. Biol. 311,
421–430.
60. Nicholls, A. & Honig, B. (1991) A rapid finite difference algorithm
utilizing successive over-relaxation to solve the Poisson–Boltz-
mann equation. J. Comp. Chem. 12, 435–445.
61. Rocchia, W., Alexov, E. & Honig, B. (2001) Extending the
applicability of the nonlinear Poisson–Boltzmann equation: mul-
tiple dielectric constants and multivalent ions. J. Phys. Chem. 105,
6507–6514.
62. Sitkoff, D., Sharp, K.A. & Honig, B. (1994) Accurate calculation
of hydration free energies using macroscopic solvent models.
J. Phys. Chem. 98, 1978–1988.
63. Gilson, M. & Honig, B. (1986) The dielectric constant of a folded
protein. Biopolymers 25, 2097–2119.
64. Rocchia, W., Sridharan, S., Nicholls, A., Alexov, E., Chiabrera, A.
& Honig, B. (2002) Rapid grid-based construction of the molecular
surface and the use of induced surface charges to calculate reaction
field energies: applications to the molecular systems and geome-
trical objects. J. Comp. Chem. 23, 128–137.
65. Gilson, M., Sharp, K.A. & Honig, B. (1987) Calculating the
electrostatic potential of molecules in solution: method and error
assessment. J. Comp. Chem. 9, 327–335.
66. Oliverberg, M., Arcus, V. & Fersht, A. (1995) pK
a
values of
carboxyl groups in the native and denaturated states of
barnase: the pK
a
of the denaturated state are on average 0.4 units
lower than those of model compounds. Biochemistry 34, 9424–
9433.
67. Tan, Y., Oliverberg, M., Davis, B. & Fersht, A. (1995) Perturbed
pK
a
-values in the denaturated states of proteins. J. Mol. Biol. 254,
980–992.
68. Swint-Kruse, L. & Robertson, A. (1995) Hydrogen bonds and the
pH dependence of ovomucoid third domain stability. Biochemistry
34, 4724–4732.
69. Yang, A S. & Honig, B. (1994) Structural origins of pH and ionic
strength effects on protein stability: acid denaturation of sperm
whale apomyoglobin. J. Mol. Biol. 237, 602–614.
70. Tanford, C. (1970) Protein denaturation, Part C. Adv. Protein
Chem. 25, 1–95.
71. Lee, K., Fitch, C. & Garcia-Moreno, B. (2002) Distance depen-
dence and salt sensitivity of pair wise coulombic interactions in a
protein. Prot. Sci. 11, 1004–1016.
72. Huyghues-Despointes, B., Thurlkill, R., Daily, M., Schell, D.,
Briggs, J., Antosiewicz, J., Pace, N. & Scholtz, J. (2003) pK values
of histidine residues in ribonuclease Sa: effect of salt and net
charge. J. Mol. Biol. 325, 1093–1105.
73. Lee, K., Fitch, C., Lecomte, J. & Garcia-Moreno, B. (2002)
Electrostatic effects in highly charged proteins: salt sensitivity of
pK
a
values of histidines in Staphylococcal nuclease. Biochemistry
41, 5656–5667.
74. Oliverberg, M. & Fersht, A. (1996) Formation of electrostatic
interactions on the protein-folding pathway. Biochemistry 35,
2726–2737.
75. Yang, A. & Honig, B. (2000) An integrated approach to the
analysis and modeling of protein sequences and structures. I.
protein structural alignment and a qualitative measure for protein
structural distance. J. Mol. Biol. 301, 665–678.
76. Hendsch, Z.S., Sindelar, C.V. & Tidor, B. (1998) Parameter
dependence in continuum electrostatic calculations: a study using
protein salt bridges. J. Phys. Chem. 102, 4404–4410.
77. Vijayakumar, M. & Zhou, H. (2001) Salt bridges stabilize the
folded state of barnase. J. Phys. Chem. 105, 7334–7340.
78. Dong, F. & Zhou, H. (2002) Electrostatic contributions to T4
lysozyme stability: solvent-exposed charges versus semi-buried salt
bridges. Biophys. J. 83, 1341–1347.
79. Petrey, D. & Honig, B. (2002) ‘GRASP2: visualization, surface
properties and electrostatic of macromolecular structures. Meth-
ods Enzymol., in press.
Ó FEBS 2003 Calculating pH of maximal protein stability (Eur. J. Biochem. 271) 185