Tài liệu Báo cáo khóa học: Non-specific depolymerization of chitosan by pronase and characterization of the resultant products pptx
Bạn đang xem bản rút gọn của tài liệu. Xem và tải ngay bản đầy đủ của tài liệu tại đây (801.22 KB, 11 trang )
Non-specific depolymerization of chitosan by pronase
and characterization of the resultant products
Acharya B. Vishu Kumar
1
, Lalitha R. Gowda
2
and Rudrapatnam N. Tharanathan
1
1
Department of Biochemistry and Nutrition,
2
Department of Protein Chemistry and Technology, Central Food Technological
Research Institute, Mysore, India
Pronase (type XXV serine protease from Streptomyces
griseus) efficiently depolymerizes chitosan, a linear bfi1,4-
linked polysaccharide of 2-amino-deoxyglucose and
2-amino-2-N-acetylamino-
D
-glucose, to low-molecular
weight chitosans (LMWC), chito-oligomers (degree of poly-
merization, 2–6) and monomer. The maximum depolymeri-
zation occurred at pH 3.5 and 37 °C, and the reaction obeyed
Michaelis–Menten kinetics with a K
m
of 5.21 mgÆmL
)1
and
V
max
of 138.55 nmolesÆmin
)1
Æmg
)1
.Themolecularmassof
the major product, LMWC, varied between 9.0 ± 0.5 kDa
depending on the reaction time. Scanning electron
microscopy of LMWC showed an approximately eightfold
decrease in particle size and characterization by infrared
spectroscopy, circular dichroism, X-ray diffractometry and
13
C-NMR revealed them to possess a lower degree of acety-
lation, hydration and crystallinity compared to chitosan.
Chitosanolysis by pronase is an alternative and inexpensive
methodtoproduceavariety ofchitosandegradationproducts
that have wide and varied biofunctionalities.
Keywords: chitosan; chito-oligomers; low-molecular weight
chitosan; pronase; structure.
Chitosan is the de-N-acetylated derivative of chitin, a linear
polysaccharide of b1fi4-linked 2-deoxy-2-acetamido-
D
-glu-
cose units [1], that constitutes the exoskeleton of inverte-
brates and is one of the components of the cell walls of
fungi. It has wide and varied applications in medicine,
agriculture, pharmaceuticals and the food industry [1,2],
which is attributed to the biofunctionality of the amine
moiety that confers both cationic (polyelectrolyte) and
chelating properties. Despite being biocompatible, nontoxic
and multifunctional, the use of chitosan in vivo is hampered
by its high-molecular mass and high viscosity even at low
concentrations [2]. Therefore, a prerequisite for efficient
utilization of chitosan is its depolymerization to low-
molecular weight chitosans (LMWC), chito-oligomers and
monomer. The depolymerized products find additional
applications as hypo-cholesterolemic, antitumorigenic,
antimicrobial, immuno-enhancing agents, and also in the
treatment of osteoarthritis, gastritis, etc. [3–5]. A 9 kDa
LMWC suppressed Escherichia coli activity whereas that of
LMWC 5 kDa showed antihyperlipemic and hypocholes-
terolemic effects [2]. Chito-oligomers with a degree of
polymerization (DP) > 6 showed antitumor activity
towards Sarcoma-180 and Meth-A tumors, and caused
activation of defence responses in plants. Chitotriose
exhibited maximum inhibitory effect towards angiotensin
converting enzyme (ACE) [4].
Chitosan can be depolymerized by acid or enzymatic
hydrolysis. The former is harsh, time consuming, modifies
the products and forms a large quantity of monomers [6].
In contrast, enzymatic hydrolysis produces specific
products as the reaction can be precisely controlled.
Chitosanase, the enzyme of choice due to its specificity,
degrades chitosan to chito-oligomers, but is, however,
very expensive and unavailable in bulk for commercial
exploitation [7].
The earlier concept of a ratio of one enzyme to one
substrate/group of related substrates is no more a reality in
most of hydrolases as evidenced in recent literature. b1fi4
Glucanase, although specific for b1fi4-linked glucans, can
hydrolyze mannans and cellobiose [8]. Chitosanase from
Myxobacter A-1, Streptomyces griseus HUT 6037, Bacillus
sp.7-M and Bacillus megaterium degrades carboxymethyl-
cellulose. A b1fi3/1fi4 glucanase from Bacillus circulans
WL-12 depolymerizes chitosan to low-molecular mass
products [9–12]. Susceptibility of chitosan to various
nonspecific enzymes like wheat germ lipase, lysozyme,
papain, cellulase, hemicellulase, b-glucosidase, etc., has
been reported earlier, although enzyme purity was in doubt
and could be contaminated with chitosanase [13,14].
Recently, we have shown that a homogeneous isozyme of
Aspergillus niger pectinase could depolymerize chitosan
quantitatively to yield LMWC and chito-oligomers [15].
The objective of the present study was to demonstrate yet
another example of enzyme nonspecificity in catalyzing the
cleavage of completely unrelated substrates. An electropho-
retically pure pronase preparation was used to depolymerize
chitosan to LMWC, chito-oligomers and monomer, and
structural characterization of the depolymerized products is
presented herein.
Correspondence to R. N. Tharanathan, Department of Biochemistry
and Nutrition, Central Food Technological Research Institute,
Mysore ) 570 013, India.
Fax: + 91 821 2517233, Tel.: + 91 821 2514876,
E-mail:
Abbreviations: DP, degree of polymerization; LMWC, low-molecular
weight chitosan.
Enzyme: Pronase (type XXV serine protease from Streptomyces
griseus; EC 3.4.24.31)
(Received 30 October 2003, revised 12 December 2003,
accepted 22 December 2003)
Eur. J. Biochem. 271, 713–723 (2004) Ó FEBS 2004 doi:10.1111/j.1432-1033.2003.03975.x
Materials and methods
Materials
Chitosans (molecular mass, 150–600 kDa) and phenyl-
methylsulfonyl fluoride were obtained from Fluka Chemika
(Buchs, Switzerland). Pronase (type XXV protease from
Streptomyces griseus, EC 3.4.24.31), Sephadex G15 and
Celite were obtained from Sigma. Shrimp chitin was
obtained from the CFTRI Regional Center at Mangalore,
India. Other chemicals used were of highest purity available.
Preparation of chitosan
Shrimp chitin was subjected to heterogeneous N-deacety-
lation to obtain chitosan [16], which was further purified
by dissolving in 1% acetic acid, filtered through a plug of
glass-wool to remove suspended particles and finally
precipitated with 2% sodium carbonate. The precipitate
was water-washed, freeze-dried and stored at ambient
temperature until further use.
Criteria of enzyme homogeneity
To establish the purity, the stock pronase solution
(10 mgÆmL
)1
) was subjected to capillary electrophoresis
(Prince 550 system, Prince Technologies, Emmen, the
Netherlands) using fused silica capillary (80 cm
length · 75 lm i.d.) connected to an UV detector
(280 nm) and Tris/glycine buffer (pH 8.8) at 10 kV,
100 mbar, 26 ± 1 °C. The data acquisition and control
were performed using
DAX
software. The enzyme solution
after suitable dilution (30 lg) was subjected to SDS/
PAGE (12.5% T, 2.7% C using Tris/glycine buffer of
pH 8.8) according to the method of Laemmli followed by
Coomassie Brilliant Blue staining [17]. For further assay,
the stock solution was suitably diluted.
Enzyme assay
Proteolytic activity of pronase was evaluated using casein
(1%) as the substrate at optimum conditions (pH 7.5 and
37 °C) and estimating the trichloroacetic acid soluble
peptides released (specific activity, unit ¼ absorbance at
280 nm/reaction time · mg protein in the reaction mix-
ture). For chitosanolytic activity, 1% chitosan in 1%
aqueous acetic acid was treated with pronase in the ratio
100 : 1 (w/w), at optimum conditions (pH 3.5 and 37 °C).
To terminate the reaction, the mixture was heated for
5 min followed by the addition of an equal volume
of 2
M
NaOH and centrifugation (1000 g)ofthereaction
mixture. The supernatant was analyzed for reducing
groups (specific activity, unit ¼ lmoles of reducing equi-
valents released per minute per mg of protein at optimum
conditions) [18].
Energy of activation (E
a
) was determined by the slope
(–E
a
/2.3R, where R is the gas constant) of Arrhenius plots
obtained by plotting logarithm of maximum enzyme
velocity determined at different temperatures (20–37 °C)
under standard reaction conditions against the reciprocal of
absolute temperatures (T ¼ 273 + A, where A is the
temperature in °C) [19].
Kinetics of the chitosanolytic activity
The pH optimum was determined using chitosan solution
(1%) at a pH value between 1.5 and 6.0 (pH was
adjusted using 0.1
M
HCl/NaOH and above pH 6.5,
chitosan was insoluble) and 1% casein solution of
pH 4.0–11.0. The temperature optimum was determined
by carrying out the reaction between 20 and 60 °C. pH
and temperature stability measurements were carried out
by preincubating the enzyme at different pH values/
temperatures followed by determination of the residual
chitosanolytic activity (%) as described above by taking
the aliquots of the enzyme at regular intervals. The
Michaelis constants, K
m
and V
max
were evaluated from
the double reciprocal plot of the initial velocity versus
substrate concentrations.
Isolation of the products
Chitosan solution (1%, dissolved in 1% acetic acid with pH
adjusted to 3.5) was treated with pronase in the ratio,
100 : 1 (w/w), incubated for different periods at optimum
conditions followed by arresting the reaction using an equal
volume of 2
M
NaOH. The precipitate (LMWC) obtained
after centrifugation at 1000 g, was dialyzed against water
using a membrane with a molecular mass cut-off of 2 kDa
(Sigma Chemicals Co.) and freeze-dried.
The supernatant containing chito-oligomers and mono-
mer as well as the heat denatured enzyme, was passed
through a charcoal-Celite column. Unadsorbed saccha-
rides (GlcN, GlcN-rich oligomers), enzyme and excess
alkali added while arresting the reaction were collected by
eluting with distilled water (Fraction IA), and the
adsorbed saccharides (GlcNAc, GlcNAc-rich oligomers)
were recovered using 60% ethanol as the eluant (Fraction
II). Fraction IA was re-N-acetylated and subjected to a
second charcoal-Celite chromatography phase wherein the
water-washing removed the enzyme and alkali, and
elution with 60% ethanol resulted in the recovery of
re-N-acetylated GlcN and GlcN-rich oligomers (Fraction
I). The fractions were concentrated by flash treatment at
ambient temperature. Simultaneously, after neutralization,
the supernatant was passed through Sephadex G15
column (62 · 0.8 cm; bed volume, 78 mL) to remove salt
and denatured enzyme, and the fraction containing
reducing groups (chito-oligomers + monomer) were
pooled, followed by its freeze-drying.
Determination of the molecular mass of chitosan
and the depolymerization products
The molecular mass was measured using three techniques:
(a) viscometric measurements; (b) gel permeation chroma-
tography (GPC) and HPLC.
Viscometric measurements. The viscosity of chitosan and
LMWC dissolved in sodium acetate buffer (0.5
M
acetic
acid + 0.2
M
sodium acetate, pH 4.5) was measured using
an Ostwald viscometer [20]. The average molecular mass
was deduced using the Mark–Houwink’s equation
g ¼ K·(molecular mass)
a
where, g is the intrinsic visco-
sity, K ¼ 3.5 · 10
4
and a ¼ 0.76.
714 A. B. Vishu Kumar et al. (Eur. J. Biochem. 271) Ó FEBS 2004
Gel permeation chromatography. The molecular mass of
chitosan was determined by GPC on a Sepharose CL-4B
column (Sigma Chemicals Co; bed volume, 180 mL)
equilibrated in sodium acetate buffer (pH 4.5) [21]. The
column was precalibrated with dextrans (of known mole-
cularmass)and chitosanmolecularmassstandards.Fractions
I and II obtained after charcoal-Celite column chromatogra-
phy were subjected to GPC using a Biogel P2 column
(100 · 0.8 cm, Bio-Rad laboratories) equilibratedwith water
and calibrated with chito-oligomers and GlcNAc [18].
High performance liquid chromatography. The molecular
mass of LMWC was determined using E-linear and E-1000
columns in series. The mobile phase used was acetate buffer
(0.5
M
acetic acid + 0.2
M
sodium acetate, pH 4.5) at a flow
rate of 0.8 mLÆmin
)1
and the detection was performed
using an RI detector (Shimadzu Corp., Kyoto, Japan). The
columns were calibrated with dextran standards. The use of
acetate buffer minimized the interaction between the
column material and -NH
2
groups.
Fractions I and II were subjected to HPLC on an
aminopropyl column (3.9 · 300 mm, Waters Associates,
Ireland) using acetonitrile:water (70 : 30, v/v) as the mobile
phase at a flow rate of 1.0 mLÆmin
)1
and detected using an
RI detector. Chito-oligomers and GlcNAc were used as
standards.
Further characterization of chitosan and the
depolymerization products
Further characterization of chitosan and the depolymeriza-
tion products was performed using a variety of techniques
as detailed below.
Environmental scanning electron microscopy (ESEM).
Freeze dried samples were spread on a double sided
conducting adhesive tape pasted onto a metallic stub.
Samples were observed under SEM (LEO 435 VP, LEO
Electron Microscopy Ltd, Cambridge, UK) at 20 kV and
variable pressure.
Infrared (IR) spectroscopy. IR spectral studies were
performed on a Perkin Elmer 2000 spectrometer under dry
air at room temperature using KBr pellets. Chitosan,
LMWC and freeze-dried chito-oligomers + monomer
(4 mg samples) were mixed thoroughly with 200 mg KBr
and 40 mg of the mixture was pelletized. The reproducibility
of the spectra was verified on two preparations and the
degree of acetylation (DA) was determined using the formula
(A
1655
Æcm
)1
/A
3450
Æcm
)1
) · 100 / 1.33, where A is the absorb-
ance at these wavelengths, calculated from the baseline [22].
Potentiometric titration. Chitosan, LMWC and chito-
oligomers + monomer (200 mg) were dissolved in 25 mL
of 0.1
M
HCl and the volume was made up to 100 mL with
distilled water and the ionic strength was adjusted to 0.1
M
using KCl. 0.1
M
NaOH containing 0.1
M
KCl was used as
the titrant. Initially, the solution pH was brought to pH 2.0
by adding the titrant, after which it was added in stepwise
increments (0.5 mL, each time). The titration was termin-
ated when the solution pH reached 6.0. For each sample,
five replicates were performed. A graph of pH as a function
of the volume of titrant was plotted, which gave a titration
curve having two inflexion points, whose difference along
the abscissa corresponded to the amount of acid required
for the protonation of the amine groups of samples. The
number of equivalents of acid groups was calculated using
the formula: [NH
3
+
](mequiÆkg
)1
) ¼ 1000 · molarity
(moles/L) · volume of titrant (mL)/mass of sample (g)
and the level of deacetylation was calculated by comparison
between the number of free amino groups (per unit weight
of the sample) and the equivalent weight of GlcN [23].
Circular Dichroism (CD). CD spectra for native chitosan
and LMWC (5 mgÆmL
)1
in 0.1
M
perchloric acid; path
length, 1 cm) were recorded on a Jasco J-810 automatic
recording spectropolarimeter, continuously purged with N
2
before and during the experiment (Japan Spectroscopic,
Tokyo, Japan). Slits were programmed to yield 10 A
˚
band
width at each wavelength so that the resolution was more or
less constant. The spectra were recorded between 200 and
240 nm (far UV region) and baseline was obtained using
0.1
M
perchloric acid. After accumulation of scans, the
spectra were standardized to mean residual ellipticity
expressed as h in degree · cm
2
per residue using the mean
residual weight of GlcNAc [24].
X-ray diffractometry. X-ray diffraction studies were car-
ried out on an EG-7 G solid state germanium, liquid
nitrogen cooled detector Scintag XDS-2000 diffractometer
equipped with a h–h goniometer, 30 kV + 25 mA with
CuKa radiation at 1.5414 nm (Enraf Nonius Co., Bohemin,
NY). The relative intensity was recorded in a scattering
range (2h)of0–45°. The crystallinity index (CrI, %) was
determined using the formula (I
110
– I
am
) · 100/I
110
,where
I
110
is the maximum intensity at 20° and I
am
is the intensity
of amorphous diffraction at 16° [25].
Solid-state CP-MAS
13
C-NMR spectroscopy.
13
C-NMR
spectra were obtained with a Bruker dsx
300
spectrometer at
75 MHz. The cross polarization pulse sequence was utilized
for all samples, which were spun at the magic angle at
6.2 kHz for native chitosan and 7 kHz for LMWC and
chito-oligomers + monomer. A contact time of 1 ms and a
pulse repetition time of 5 ms were used, and more than 2000
scans were accumulated for each spectrum. Approximately
300 mg of freeze-dried samples were inserted into a 7 mm
ceramic rotor. The DA was calculated using the equation,
I
CH3
/(I
C1
+ I
C2
+ … I
C6
)/6, where I is the intensities of
C1–C6 as well as methyl carbons [26].
Liquid-state
13
C-NMR spectroscopy. Chitosan, LMWC
and freeze-dried chito-oligomers + monomer (50 mg each)
were dissolved in 1 mL solvent mixture of D
2
O-DCl
(0.98 + 0.02 mL, respectively). After ensuring complete
dissolution of the samples, the spectra were recorded with a
Bruker amx
400
spectrometer at 100 MHz and 27 °C.
Results and Discussion
Characterization of chitosan
The molecular mass of purified chitosan was 71 ± 2 kDa
as determined by both viscometry and GPC. The solid-state
Ó FEBS 2004 Chitosanolysis by pronase (Eur. J. Biochem. 271) 715
CP-MAS
13
C-NMR and IR spectra indicated chitosan to
have a b-conformation, as evidenced by the absence of
splitting of signals corresponding to C3-C5 carbons (Fig. 1)
and appearance of a single broad peak around 3371 cm
(Fig. 2), in contrast to the presence of two peaks in case of
a-conformation. The degree of acetylation (DA) determined
by IR and
13
C-NMR was in good agreement with each
other (Table 1). The crystallinity index (CrI) determined by
X-ray diffraction pattern was 70% (Table 1) and indicated
chemical homogeneity, and this was in close correspondence
with chitosans of Euphausia superba (68.4%) [27].
Effect of different solvents, molecular mass
and DA on chitosanolysis by pronase
Preliminary studies indicated that chitosan could be degra-
ded nonspecifically by proteases such as pepsin, papain,
protease, etc. It was observed that chitosanolysis by pronase
was dependent upon the solubility, molecular mass and DA
of chitosan. Muzzarelli et al. (1994) compared acetic acid
with lactic acid as a chitosan solvent during the nonspecific
chitosanolysis by papain and reported lactic acid to be a
better solvent owing to the hydrolyzing action of the former
[28]. Contrary to this, the specific activity of pronase
indicated that chitosan dissolved in aqueous acetic acid
(1%) and was the best solvent when compared to formic
and lactic acids. In acetic acid, being a weak acid (see pK
a
values, Table 2), chitosan was much less decomposed, [29]
thus, resulting in better enzymic depolymerization. Increase
in the molecular mass of chitosan from 71fi600 kDa and
DA from 15fi26% resulted in increased specific activity
(Table 2). Ibrahim et al. (2002) reported the effect of
molecular mass and DA on lipase loaded chitosan bead
characteristics, in which increases in molecular mass and
DA resulted in efficient loading and minimization of the
release of entrapped lipase [30]. The observed increase in
specific activity with increasing molecular mass suggests the
preference of pronase towards higher molecular mass
chitosans. Improved chitosanolysis with higher DA indica-
ted that the affinity of enzyme is more towards chitosan with
higher DA.
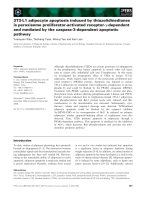
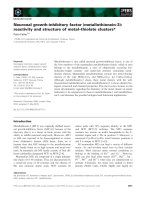
Homogeneity and specific activity of pronase
Capillary zone electrophoresis and SDS/PAGE of pronase
showed the presence of a single homogeneous protein
(Fig. 3 and the inset) of molecular mass 20 kDa as
determined using protein markers. The enzyme notably
showed a much higher specific activity towards proteolysis
of casein (4.14 U) as compared to 1.15 U towards chitosan
depolymerization. Although the specificity of pronase was
much lower ( 43-fold less) in comparison with that of
chitosanase (from Streptomyces griseus,50UÆmg
)1
,Sigma
Chemical Co.), the advantage of pronase catalyzed chitos-
anolysis was the production of LMWC in higher yields
(>70%), which was lacking in chitosanase as a result of its
specificity towards the formation of mono- and oligomers
(DP 2–3), rather than LMWC.
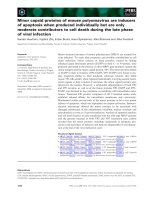
Enzyme kinetics
The pH optimum of pronase towards proteolysis and
chitosanolysis were 7.5 and 3.5, respectively, whereas the
temperature optimum towards chitosanolysis was 37 °C
(Fig. 4A,B). Investigation of the pH and temperature
stabilities indicated enzyme activation in the initial hour,
which could be due to prior attainment of an active
conformation by the enzyme, remaining stable up to
240 min (4 h) after which there was a decline (Fig. 4C,D),
indicating enzyme stability in the pH range 2.0–5.0 and
45–60 °C in the initial hours. The effect of varying chitosan
concentration on the initial velocity showed that chitosano-
lysis by pronase follows Michaelis–Menten kinetics. The use
of substrate concentration greater than 20 mgÆmL
)1
was
limited owing to increased viscosity of the solutions,
affecting the enzyme penetration. The K
m
and V
max
values
obtained from a double reciprocal plot were 5.21 mgÆmL
)1
and 138.55 nmolesÆmin
)1
Æmg
)1
, respectively. Activation
energy calculated for pronase towards proteolysis and
chitosanolysis were 15.5 and 5.12 kcalÆmol
)1
, respectively,
further supporting the fact that pronase prefers proteins
over chitosan as the substrate, which was in accordance with
the specific activities of pronase. The maximum chitosano-
lysis was observed at 240 min (4 h) beyond which there was
no further appreciable increase.
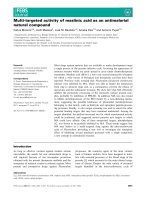
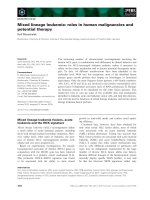
Fig. 1. Solid-state CP-MAS
13
C-NMR spectra of chitosan, LMWC
and freeze-dried chito-oligomers + monomer.
716 A. B. Vishu Kumar et al. (Eur. J. Biochem. 271) Ó FEBS 2004
Characterization of LMWC
Chitosan showed b-conformation as evidenced by both
13
C-
NMR spectra and IR (Figs 1 and 2, respectively) [27], and
accordingly was more susceptible to the hydrolytic proces-
ses, due to individual chains arranged in a parallel manner
[1], resulting in a weaker hydrogen-bonding network
between the chains and thus enabling enzyme penetration.
The percentage yield of LMWC, chito-oligomers and
monomer (GlcNAc) was dependent on the reaction time
(Table 1). There was approximately eightfold decrease in
the molecular mass following depolymerization, which
occurred in the initial hour beyond which the decrease
was not appreciable (Table 1). Unless stated otherwise,
further characterization was performed with the LMWC
obtained after 1 h reaction time.
Environmental scanning electron microscopy. Although
chitosan is a linear polymer, its freeze-drying results in the
aggregation of the chains by inter- and intrachain hydrogen
bonding network resulting in the formation of particle-
like structure [1]. ESEM of LMWC (obtained after 5 h
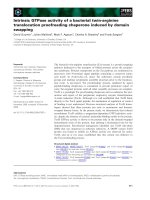
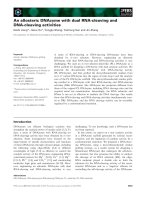
Fig. 2. Infrared (IR) spectra of chitosan
and LMWC.
Table 1. Characteristics of chitosan and low-molecular weight chitosan (LMWC), and the percentage yield of the depolymerization products.
Percentage yield is dependent on the incubation time (1–5 h) and is approximate.
Molecular mass
(kDa)
Degree of acetylation (DA; %)
Crystallinity index
(CrI; %)
Yield
(%)
IR
13
C-NMR
(solid state)
Chitosan
Native 71 ± 2 25.7 26.3 70 –
LMWC 8.5–9.5
a
19.0 18.6 62 74–80
Depolymerization products
Chito-oligomers – – – – 10–12
GlcNAc – – – – 6–8
a
Dependent on the incubation time (1–5 h) .
Ó FEBS 2004 Chitosanolysis by pronase (Eur. J. Biochem. 271) 717
incubation) indicated decreased particle size compared to
chitosan (Fig. 5) in accordance with the lower molecular
mass. The continuous fibrous/flat ribbon type appearance
of chitosan disappeared upon depolymerization and resul-
ted in the formation of discontinuous smaller pieces.
IR spectra. In both chitosan and LMWC, a well defined
band around 2922 cm
)1
due to the -CH vibration mode
represented a good internal reference for comparison of
band absorbance. Absence of a sharp and convoluted
spectral band around 3600–3000 cm
)1
in the spectra of both
chitosan and LMWC indicated the absence of free -OH
groups and the involvement of both -OH…3and
-CH
2
OH…6 in intra- and intermolecular hydrogen bonding
(Fig. 2) [31]. Line width and frequency position of the band
above 3000 cm
)1
corresponds to the intermolecular crystal
lattice of a molecule, which depends on the hydrogen
bonding network, and results in the incorporation of water
molecule into molecular structure. The latter promotes a
perfect crystal structure and increases CrI. In chitosan, this
band appeared at 3371 cm
)1
and there was a slight shifting
ofthesameinLMWC(3368cm
)1
), indicating a decrease in
the ordered structure. This is probably due to the decrease in
the DA (Table 1) of LMWC, which results in lower degree
of hydration of the molecule affecting the crystallinity index
and thus the orderliness. This was further confirmed by a
decrease in the peak height at 1320 cm
)1
in LMWC
compared to chitosan, which corresponds to the GlcNAc
residues [32]. The region between 1420 and 1435 cm
)1
,
considered to be polysaccharide conformation sensitive, is
assigned to -CH
2
bending, which depends on the confor-
mation of the primary -OH group (C6) in a favorable
orientation [33]. The shift of the same to 1458 cm
)1
in the
LMWC would probably indicate a change in the environ-
ment of primary -OH groups and thus the overall hydrogen-
bonding network.
Potentiometric titration. Potentiometric titration is a well-
known analytical tool for quantifying acidic functional
groups and is independent of sample molecular mass [23].
The DA (%) calculated by titration (graphs, not shown)
were found to be 26.3, 18.8 and 32.3, respectively, which
were in good agreement with that calculated using IR
spectra.
CD-Spectra. Compared to chitosan, in LMWC, there was
a decrease in the peak height near 211 nm (due to gfip*
transition) (Fig. 6) corresponding to the acetyl content,
which is independent of conformation, chain length, ionic
strength and pH [24]. This decrease in the peak height
continued with increased time of enzyme digestion.
X-ray diffractometry. The X-ray diffraction (Fig. 7) pat-
tern of chitosan was that of a typical hydrated form with a
peak in the range 9–11° and 020 reflection appearing at
10.32° (d-spacing, 8.571 A
˚
), characteristic of a ÔtendonÕ type
polymorph [34]. The LMWC showed a shift of the same to
9.94° (d-spacing, 8.898 A
˚
), which is probably due to larger
d-spacing as a result of increase in the unit cell dimension
that results in the incorporation of fewer water molecules.
Decrease in the intensity of 020 reflections in LMWC was
also indicative of a decrease in the acetamido group [33,34].
The observed decrease in CrI (Table 1) was in good
agreement with the fact that decreased DA results in less
hydrated crystals that affects the CrI.
Solid-state CP-MAS 13C-NMR. This technique is known
to be very sensitive to changes in the local order structure.
Chitosan showed higher crystalline nature as evidenced by
narrow line width of the peaks (Fig. 1). Peak broadening in
LMWC indicates decrease in crystalline nature (Fig. 7), in
support of its low CrI. The splitting of peaks corresponding
to C1, 3, 4 and 5 ring carbons supports a rather different
hydrogen-bonding network and thus the existence of
multiple conformations in LMWC. Chemical shift values
for ring and methyl carbon atoms are given in Table 3. The
observed difference in chemical shift values of C1 and C4
indicated a conformational change of the glycosidic linkage
in LMWC. Multiplicity of the peak corresponding to C4
is independent of DA and is associated with deacetylation
Table 2. Effect of acids, molecular mass and DA on the chitosanolytic
activity of pronase.
Effect pH
Activity (l
M
reducing sugar
releasedÆmin
)1
Æmg
)1
)
Effect of different acids (1%) as the solvent
Acetic acid (pK
a
, 4.76) 3.4 1.10
3.0 0.89
Formic acid (pK
a
, 3.74) 3.4 1.08
Lactic acid (pK
a
, 3.73) 3.0 0.59
Effect of chitosans of different molecular mass (DA, 23–26%)
71 (kDa) – 1.15
150 (kDa) – 1.60
400 (kDa) – 1.67
600 (kDa) – 1.76
Effect of DA (%) on chitosanolysis by pronase
15 (83 kDa) – 0.70
19 (75 kDa) – 0.86
25 (71 kDa) – 1.15
Fig. 3. Capillary electropherogram of pronase in Tris/glycine buffer.
pH 8.3 detected at 280 nm. Inset: SDS/PAGE of protein markers
(lane A) and pronase (lane B).
718 A. B. Vishu Kumar et al. (Eur. J. Biochem. 271) Ó FEBS 2004
temperature [27]. Nevertheless, it could also be due to
increased mobility of the individual chains resulting from
decrease in chain length, as evidenced by decreased
molecular mass of LMWC. The DA calculated using
13
C-NMR spectra was in accordance with the one calcula-
ted by IR-spectra (Table 1). The peak corresponding to
-CH
3
showed a slight decrease in the height in case of
LMWC further supporting a decrease in the DA [33]
(Table 3 and Fig. 1). In LMWC, the -C¼O peak showed
splitting and considerable difference in chemical shift value
(3.467 p.p.m.) compared to native chitosan, further con-
firming the conformational inhomogeneity.
Liquid-state 13C-NMR.
13
C-NMR in the liquid state
(Fig. 8) was performed as the peaks corresponding to
-CH
3
and -C¼O were not obvious in solid-state spectra.
There was a decrease in the peak height corresponding to
-CH
3
in LMWC compared to chitosan, whereas chito-
oligomers + monomer showed slight increase in the same.
The DA (%) calculated using the spectra was 26.02 and
18.97%, respectively, for chitosan and LMWC [22], which
were in good agreement with those calculated before
(Table 1).
Solubility of LMWC. The solubility study was performed
according to the method described by Qin et al. (2003) [35].
Although the molecular mass of LMWC was <10 kDa, it
was not readily soluble in aqueous medium (water-solubility
of LMWC, 1 h sample )72%, 5 h )63%), instead it
required a very dilute acidic medium for complete
solubilization (LMWC, 100% solubility compared to 13%
solubility of chitosan in 0.01% acetic acid, chitosan required
1% acetic acid for complete dissolution). There was no
evidence for annealed polymorphism in LMWC, as
indicated by the absence of a 15° reflection in the X-ray
diffraction pattern [25]. This observation was contrary to
the earlier reports that decrease in the molecular mass of
chitosan is associated with increased solubility, attributed to
decreased intermolecular interactions, such as van der Walls
forces and hydrogen bonds, provided that the DA did not
change after degradation [35]. However, chitosanolysis by
pronase was associated with decreased DA as evidenced by
the spectral data and hence the observed decreased
solubility (in water) could probably be due to the exposure
and thus conversion of -NH
2
groups on LMWC to the
sodiated form (Na
+
, added to terminate the reaction),
which could result in a different molecular conformation.
This was obvious from the d-spacing of LMWC (8.898 A
˚
),
which was neither typical of tendon nor of L-2 polymorph.
Compared to the 1 h sample, LMWC obtained after 5 h
incubation showed much lower solubility as there was a
further decrease in the DA (Table 1), exposing more -NH
2
groups for sodiation. Cheng et al. (2000) made use of two
volumes of acetonitrile [36], instead of an equal volume of
2 N NaOH as in the present study, to arrest the catalytic
reaction. Similar use of acetonitrile in the present study
Fig. 4. Effect of (A) pH and (B) temperature on pronase activity and the stability studies (C & D).
Ó FEBS 2004 Chitosanolysis by pronase (Eur. J. Biochem. 271) 719
resulted in LMWC that was readily soluble in water, thus,
supporting the formation of sodiated LMWC when alkali
was added. The drawbacks of using acetonitrile were, its
high cost and flash treatment of the supernatant at elevated
temperature, which may result in Maillard reaction
products limiting one step production of LMWC and
oligomers + monomer. Although 0.01% acetic acid was
necessary for LMWC solubilization, the pH value of
resulting solution was near neutrality ( 6.8).
Nevertheless, the decrease in molecular mass, DA and
CrI, and molecular inhomogeneity of LMWC did not
hinder its biofunctionality. LMWC exhibited potent anti-
microbial activity towards Bacillus cereus [10
6
colony
forming units (CFU)] and Escherichia coli (10
3
CFU), with
a minimum inhibitory concentration of 0.01 and 0.03%
(w/v), respectively. The inhibitory activity of LMWC was
much superior over that of chitosan, and resulted in a
progressive lysis of the bacterial cells as evidenced by SEM
(unpublished observations).
Characterization of the mono-oligomeric mixture
Chito-oligomers + monomer, due to their affinity, bind to
charcoal through a weak van der Wall’s force and their
binding capacity is dependent on charge/mass ratio. The
affinity decreases with increase in the charge/mass ratio of
the binding molecules. The bound fractions, due to their
varying solubility, are desorbed using organic solvent
gradient [37,38]. In the present study, use of 60% ethanol
resulted in the elution of all the bound chito-oligomers +
monomer. Fraction I (obtained after re-N-acetylation), by
both GPC (Biogel P2 column) and HPLC (aminopropyl
column) (Figs 8 and 9, respectively) showed the existence of
dimer and trimer in abundance along with higher oligosac-
charides (tetra- to hexamer), whereas Fraction II showed
mainly dimer and tetramer along with GlcNAc.
Fig. 5. Environmental scanning electron microscopy (3500) of (A)
chitosan and (B) LMWC.
Fig. 6. Circular dichroic (CD) spectra of chitosan and LMWC.
Fig. 7. X-ray diffractograms of chitosan and LMWC.
720 A. B. Vishu Kumar et al. (Eur. J. Biochem. 271) Ó FEBS 2004
IR-spectrum of the freeze-dried chito-oligomers +
monomer showed a DA value of 31.2% (spectrum not
shown), which was in accordance with that calculated using
13
C-NMR ( 30.83%, Fig. 1). GPC-HPLC profiles of
Fraction I and II are depicted in Figs 9 and 10, respectively.
In the solid-state
13
C-NMR spectra (Fig. 1), appearance of
peaks at 25.831 and 173 600 p.p.m. corresponding to -CH
3
and -C¼O groups, respectively, indicated the release of
GlcNAc/GlcNAc-rich oligomers; this was further con-
firmed by liquid-state
13
C-NMR (Fig. 8). The DA value
calculated using liquid-state spectrum was 31.33%, which
was in good agreement with that calculated by solid-state
spectrum (Table 1).
The monomeric residue sequence in chitosan is of four
types, -GlcN-GlcN-, -GlcN-GlcNAc-, -GlcNAc-GlcN-
and -GlcNAc-GlcNAc-, of which the first is the major
type and the last one results from the heterogeneous de-N-
acetylation. Formation of chito-oligomers as one of the
products and a drastic decrease in molecular mass of
chitosan indicates an endo-type activity of pronase.
Addition of hexosaminidase (specific for the release of
GlcNAc from the nonreducing end) to LMWC and
Fraction II did not result in the release of reducing groups
indicating action of pronase on -GlcNAc-GlcN-linkage
resulting in the products (LMWC and oligomers) with
GlcNAc at reducing ends. In addition, the presence of
GlcNAc in Fraction II and the absence of GlcN in
Fraction I demonstrates the exo-type action of pronase
and this was further confirmed by using (GlcNAc)
2
and
(GlcNAc)
3
as substrates, where the activities were found
to be 0.09 and 0.18 units, respectively. From these data,
Table 3. Solid-state CP-MAS
13
C-NMR chemical shift values of ring and methyl carbons of native chitosan, LMWC and chito-oligomers.
Sample
Chemical shift values (p.p.m.)
CH
3
C2/C6 C3/C5 C4 C1 -C¼O
Chitosan 26.843 60.906 78.703 84.703 108.103 176.524
LMWC (1 h) 25.521 62.942 77.878 87.332 107.025 173.057
Chito-oligomers + monomer 25.831 61.025 78.051 87.140 107.562 173.600
Fig. 8. Liquid state
13
C-NMR spectra of chitosan, LMWC and freeze
dried chito-oligomers + monomer.
Fig. 9. Chromatographic profile of the chito-oligomeric Fractions (I and
II) on Biogel P2 column (Bed volume, 80 mL).
Ó FEBS 2004 Chitosanolysis by pronase (Eur. J. Biochem. 271) 721
along with that of hexosaminidase, it could be concluded
that during exo-type of activity, pronase prefers GlcNAc
at the nonreducing ends, i.e. -GlcNAc-GlcNAc-linkage,
the action on which results in the release of GlcNAc and
products with GlcNAc at the reducing ends.
The observed decrease in DA value of LMWC is due to
the release of GlcNAc and GlcNAc-rich oligomers as some
of the products. An examination of DA values indicates that
the total DA of the products is equal to that of native
chitosan (19% for LMWC and 31.2% for chito-oligomers
+ monomer, the average of these is 25.1%, in agreement
with DA of native chitosan, Table 1). From these data, it
was also evident that in the reaction catalyzed by pronase,
only glycosidic bonds were cleaved leaving the N-acetyl
groups intact.
Evaluation of the ionization constants of pronase
towards chitosanolysis
The ionization constants of enzymes that obey Michaelis–
Menten kinetics can be further evaluated by analyzing the
curves of log (V
max
/K
m
) vs. pH, which yields pK
E
values,
and often provides valuable clues as to the identities of the
amino acid residues essential for enzymatic activity [39]. In
the present study, the calculated pK
E
was 4.0, suggesting
the involvement of aspartic (Asp, pK
a
3.90)/glutamic (Glu,
pK
a
4.07) acid residues for the catalysis. Moreover, the pH
optima of pronase towards proteolysis and chitosanolysis
were at two extremes (Fig. 2A), suggesting possible varia-
tions in the protein conformation. Use of 1 m
M
phenyl-
methanesulfonyl fluoride in the reaction medium brought
about 100% inhibition of proteolysis, whereas, the chitos-
anolytic activity was inhibited by only 30%, which sugges-
ted the involvement of a serine residue in this nonspecific
catalysis. As a serine protease, pronase bears a triad
consisting Asp, His and Ser residues in the catalytic site
[39,40]. Watanabe et al. [41], by site directed mutagenesis,
identified the involvement of crucial Glu and Asp residues
during the chitinolytic activity of chitinase A1 from Bacillus
circulans W-12. Replacement of SerfiAla decreased the
catalytic activity without affecting the K
m
, and the mutant
retained only 10% of the wild-type activity. It was
concluded that Ser might have an important role in
maintaining the structural features of the catalytic site. On
similar lines, it may be tempting to speculate that Asp/
Glu + Ser are probably involved during the pronase-
catalyzed chitosanolysis.
While screening the proteases for chitosanolysis, highest
activity was shown by pepsin, followed by papain, pronase
and a protease from Aspergillus niger (4.98, 1.78, 1.16 and
0.058 units, respectively). Though, pepsin and papain were
inexpensive, the former showed a decrease in the activity
during the course of time due to its auto-catalytic property
and the latter, due to its higher initial velocity, resulting in
the formation of LMWC of 4–5 kDa and below. As
pronase overcomes these drawbacks, it could be considered
as a better chitosanolytic agent in comparison with other
proteases screened.
In conclusion, depolymerization of chitosan using pro-
nase, though unusual and nonspecific, is a viable alternative
way of catalysis to produce LMWC, chito-oligomers (DP
2–6) and monomer (GlcNAc), quantitatively and econom-
ically with multiple applications. Although chitosanase is
Ôthe enzymeÕ for chitosanolysis, it is expensive ( 15 $ per
unit), unavailable in bulk and results in more monomer and
oligomers (DP 2–3), whereas pronase is relatively inexpen-
sive ( 0.13 $ per unit), easily available and LMWC of any
desired molecular mass can be custom made by manipula-
ting the reaction conditions. Use of pronase in place of
chitosanase is still feasible even though pronase quantity has
to be increased by 40-fold to mimic the specific activity of
chitosanase. Thus, the results add value to otherwise
commercially available raw materials, viz. chitosan from
the offal of marine food processing industry (and pronase),
and show the biofunctionalities of these materials.
Acknowledgements
Authors thank Dr S. Subramanian (Indian Institute of Science,
Bangalore) for X-ray analysis, Dr A.G. Appu Rao and Dr Sridevi
Annapurna Singh (Department of Protein Chemistry and Technology,
CFTRI, Mysore) for CD measurements. A.B.V.K. thanks CSIR (New
Delhi) for the senior research fellowship.
References
1. Tharanathan, R.N. & Kittur, F.S. (2003) Chitin – The undisputed
biomolecule of great potential. Crit.Rev.FoodSci.Nutr.43,
61–87.
Fig. 10. HPLC profiles of chito-oligomeric Fractions I and II separated
on charcoal/Celite column (values in the parenthesis indicate retention
time of the individual peaks in minutes).
722 A. B. Vishu Kumar et al. (Eur. J. Biochem. 271) Ó FEBS 2004
2. Shahidi, F., Arachchi, J.K.V. & Jeon, Y.J. (1999) Food
applications of chitin and chitosans. J. Food. Sci. Technol. 10,
37–51.
3. Ikeda,I.,Sugano,M.,Yashida,K.,Sasaki,E.,Iwamoto,Y.&
Hatono, K. (1995) In Dietary Fibre in Health and Disease,
(Kritchevsky,D.&Bonefield,C.,eds),pp.95,EaganPress,USA.
4. Shon, D.H. (2001) Chitosan oligosaccharides for functional foods
and microbial enrichment of chitosan oligosaccharides in soy-
paste. Proceedings of the International Workshop on Bioactive
Natural Products, Japan, pp. 56–66, The Committee on Science
and Technology in Developing Countries (COSTED) and The
Science Council of Japan, Tokyo, Japan.
5. Sukwattanasinitt, M., Zhu, H., Sashiwa, H. & Aiba, S. (2002)
Utilization of commercial non-chitinase enzymes from fungi for
preparation of 2-acetamido-2-deoxy-
D
-glucose from b-chitin.
Carbohydr. Res. 337, 133–137.
6. Rupley, J.A. (1964) The hydrolysis of chitin by concentrated
hydrochloric acid and the preparation of low molecular weight
substrates for lysozyme. Biochim. Biophys. Acta 83, 245–250.
7. Patil, R.S., Ghormade, V. & Deshpande, M.V. (2000) Chito-
sanolytic enzymes: an exploration. Enz. Microb. Technol. 36,
473–483.
8. Macarron, R., Acebal, C., Castillon, M.P. & Claeysens, M. (1996)
Mannanase activity of endoglucanase III from Trichoderma reesei
QM 9414. Biotechnol. Lett. 18, 559–602.
9. Hedges, A. & Walfe, R.S. (1974) Extracellular enzyme from
Myxobacter AL1 that exhibits both b-1,4-glucanase and chitosa-
nase activities. J. Bacteriol. 120, 844–853.
10. Ohtakara, A. (1988) Chitosanases from Streptomyces griseus.
Methods Enzymol. 161, 505–510.
11. Pelletier, A. & Sygush, J. (1990) Purification and characterization
of three chitosanase activities from Bacillus megaterium P1.
J. Appl. Environ. Microbiol. 56, 844–848.
12. Mitsutomi, M., Isono, M., Uchiyama, A., Nikaidou, N., Ikegami,
T. & Watanabe, T. (1998) Chitosanase activity of the enzyme
previously reported as b)1,3/1,4 glucanase from Bacillus circulans
WL12. Biosci. Biotechnol. Biochem. 62, 2107–2114.
13. Pantaleone, D., Yalpani, M. & Scollar, M. (1992) Unusual sus-
ceptibility of chitosan to enzymic hydrolysis. Carbohydr. Res. 237,
325–332.
14. Zhang, H. & Neau, S.H. (2001) In vitro degradation of chitosan by
a commercial enzyme preparation: effect of molecular weight and
degree of acetylation. Biomaterials 22, 1653–1658.
15. Kittur, F.S., Vishu Kumar, A.B., Gowda, L.R. & Tharanathan,
R.N. (2003) Chitosanolysis by an isozyme of Aspergillus niger –A
non-specific activity. Carbohydr. Polym. 53, 191–196.
16. Kittur, F.S., Kumar, K.R. & Tharanathan, R.N. (1998) Func-
tional packaging properties of chitosan films. Z. Lebensm. Unter.
Forsch. A 206, 44–47.
17. Laemmli, U.K. (1970) Cleavage of structural proteins during the
assembly of head of Bacteriophage T4. Nature 227, 680–685.
18. Imoto, T. & Yagishita, K. (1971) A simple activity measurement
of lysozyme. Agric. Biol. Chem. 33, 1154–1157.
19. Whitaker, J.R. (1972) Principles of Enzymology for the Food
Sciences. Marcel Dekker, New York.
20. Rinaudo, M., Milas, M. & Dung, L.P. (1993) Characterization of
chitosan – influence of ionic strength and degree of acetylation on
chain expansion. Int. J. Biol. Macromol. 15, 281–285.
21. Sekiguchi, S., Miura, Y., Kaneko, H., Nishimura, S.L., Nishi, N.,
Iwase, M. & Tokura, S. (1994) Molecular weight dependency of
antimicrobial activity by chitosan oligomers. In Food Hydro-
colloids: Structure, Properties and Functions, (Nishinari, K. & Doi,
E.,eds),pp.71–76,PlenumPress,NewYork.
22. Baxter, A., Michael, D. & Taylor, K.D.A. (1992) Improved
method for i.r. determination of the degree of N-acetylation of
chitosan. Int. J. Biol. Macromol. 14, 166–169.
23. Raymond, L., Morin, F.G. & Marchessault, R.H. (1993) Degree
of deacetylation of chitosan using conductometric titration and
solid state NMR. Carbohydr. Res. 246, 331–336.
24. Domard, A. (1987) pH and c.d. measurements on a fully deacet-
ylated chitosan: application to Cu
II
–polymer interactions. Int.
J. Biol. Macromol. 9, 333–336.
25. Focher, B., Beltrame, P.L., Naggi, A. & Tori, G. (1990) Alkaline
N-deacetylation of chitin enhanced by flash treatments: Reaction
kinetics and structure modifications. Carbohydr. Polym. 12,
405–418.
26. Ottoy, M.H., Varum, K.M. & Smidsord, O. (1996) Compositional
heterogeneity of heterogeneously deacetylated chitosans. Carbo-
hydr. Polym. 29, 17–24.
27. Focher, B., Naggi, A., Tori, G., Cosani, A. & Terbojevich, M.
(1992) Chitosans from Euphausia superba. 2: Characterization of
solid-state structure. Carbohydr. Polym. 18, 43–49.
28. Muzzarelli, R.A.A., Tomasetti, M. & Hari, P. (1994) Depoly-
merization of chitosan with the aid of papain. Enz. Microb.
Technol. 16, 110–114.
29. Yamamoto, A., Kawada, J., Yui, T. & Ogawa, K. (1997) Con-
formational behavior of chitosan in the acetate slat: an X-ray
study. Biosci. Biotechnol. Biochem. 61, 1230–1232.
30. Ibrahim, A.A., Seema, S.B., Hua, A., Barryl, A.E. & Steven, H.N.
(2002) Molecular weight and degree of deacetylation effects on
lipase-loaded chitosan bead characteristics. Biomaterials 23,
3637–3644.
31. Harish Prashanth, K.V., Kittur, F.S. & Tharanathan, R.N. (2002)
Solid-state structure of chitosan prepared under different N-dea-
cetylating conditions. Carbohydr. Polym. 50, 27–33.
32. Brugnerotto, J., Lizardi, J., Goycoolea, F.M., Argiielles, M.W.,
Desbrieres, J. & Rinaudo, M. (2001) An infrared investigation in
relation with chitin and chitosan characterization. Polymer 42,
3569–2580.
33. Kittur, F.S., Vishu Kumar, A.B. & Tharanathan, R.N. (2003)
Low molecular weight chitosans – preparation by depolymeriza-
tion with Aspergillus niger pectinase, and characterization. Car-
bohydr. Res. 338, 1283–1290.
34. Ogawa, K. (1991) Effect of heating an aqueous suspension of
chitosan on the crystallinity and polymorphs. Agric. Biol. Chem.
55, 2375–2379.
35. Qin, C.Y., Zong, L., Zeng, F., Liu, Y. & Zhou, B. (2003) Effect of
hemicellulase on the molecular weight and structure of chitosan.
Polym. Degradation Stability 80, 435–441.
36. Cheng, C.Y. & Li, Y.K. (2000) An Aspergillus chitosanase with
potential for large-scale preparation of chitosan oligosaccharide.
Biotechnol. Appl. Biochem. 32, 197–203.
37. Allan, G.G., Altman, L.C., Bensinger, R.E., Ghosh, D.K., Hira-
bayashi, Y., Neogi, A.N. & Neogi, S. (1984) In Chitin, Chitosan
and Related Enzymes (Zikaki, J.P., ed), p. 119, Academic Press,
New York.
38. Muraki, E., Yaku, F. & Kojima, H. (1993) Preparation and
crystallization of
D
-glucosamine oligosaccharide with DP 6–8.
Carbohydr. Res. 239, 227–237.
39. Voet,D.&Voet,J.G.(1995)Biochemistry, 2nd edn. pp. 360–362,
John Wiley & Sons, Inc, New York.
40. Garner, M.H., Garner, W.H. & Gurd, R.R.N. (1974) Recognition
of primary sequence variations among sperm whale myoglobin
components with successive proteolysis procedures. J. Biol. Chem.
249, 1513–1518.
41. Watanabe,T.,Kobori,K.,Kiyotaka,Miyashita,Fujii,T.,Sakai,
H. & Makot, Uchida and Tanaka, H. (1993) Identification of
glutamic acid 204 and aspartic acid 200 in chitinase A1 of Bacillus
circulans WL-12 as essential residues for chitinase activity. J. Biol.
Chem. 268, 18567–18572.
Ó FEBS 2004 Chitosanolysis by pronase (Eur. J. Biochem. 271) 723